. 2021 Jul 23;12(1):4496.
doi: 10.1038/s41467-021-24677-6.

Lineage-defined leiomyosarcoma subtypes emerge years before diagnosis and determine patient survival

Affiliations

Lineage-defined leiomyosarcoma subtypes emerge years before diagnosis and determine patient survival

Nathaniel D Anderson et al. Nat Commun. .

Abstract

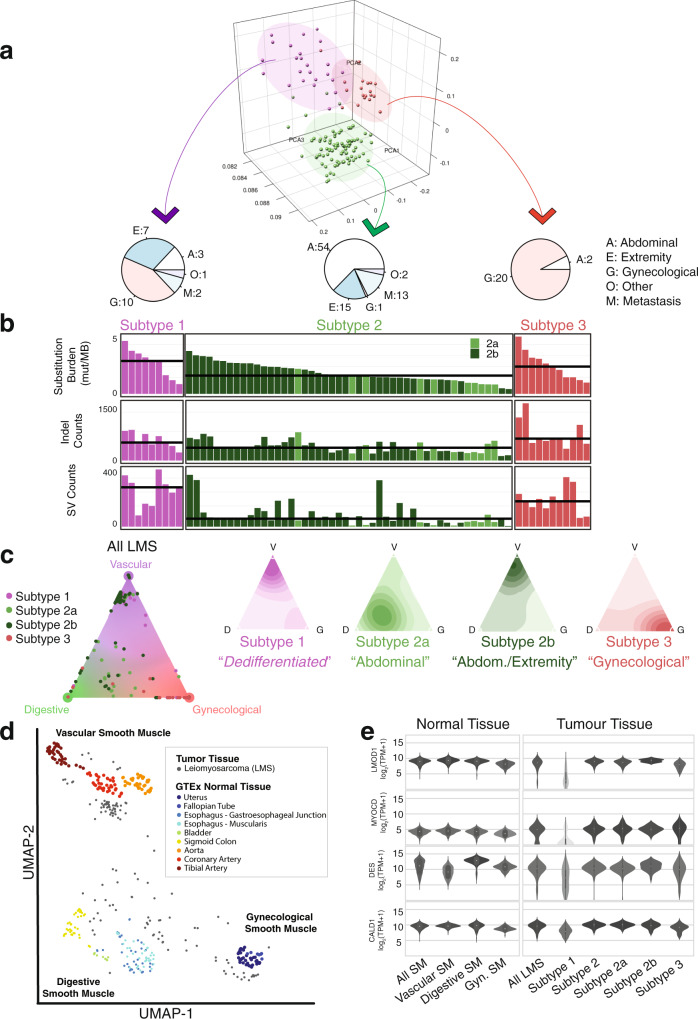
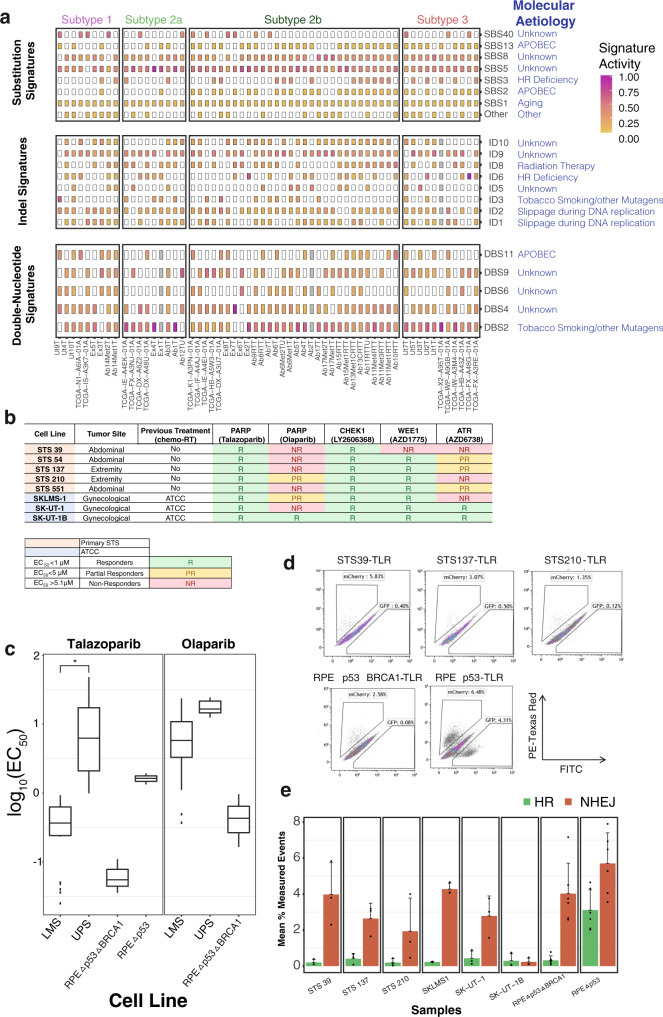
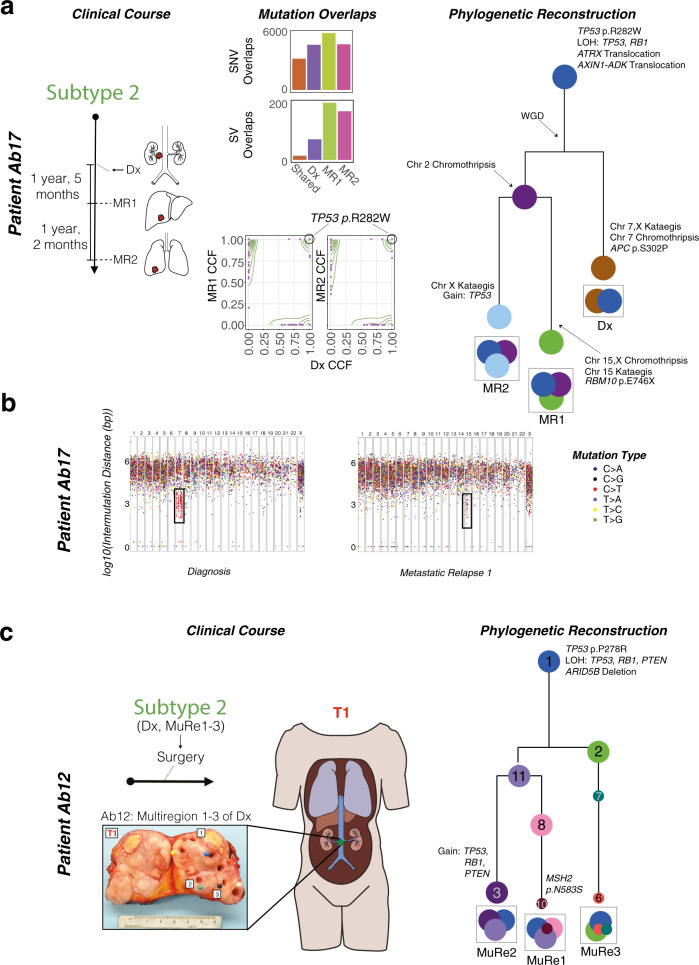
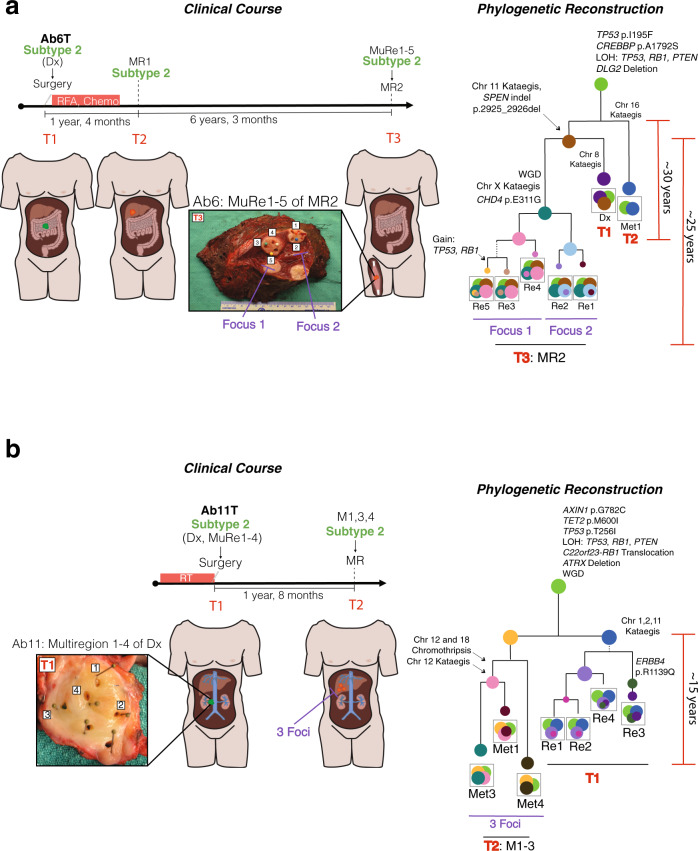
Leiomyosarcomas (LMS) are genetically heterogeneous tumors differentiating along smooth muscle lines. Currently, LMS treatment is not informed by molecular subtyping and is associated with highly variable survival. While disease site continues to dictate clinical management, the contribution of genetic factors to LMS subtype, origins, and timing are unknown. Here we analyze 70 genomes and 130 transcriptomes of LMS, including multiple tumor regions and paired metastases. Molecular profiling highlight the very early origins of LMS. We uncover three specific subtypes of LMS that likely develop from distinct lineages of smooth muscle cells. Of these, dedifferentiated LMS with high immune infiltration and tumors primarily of gynecological origin harbor genomic dystrophin deletions and/or loss of dystrophin expression, acquire the highest burden of genomic mutation, and are associated with worse survival. Homologous recombination defects lead to genome-wide mutational signatures, and a corresponding sensitivity to PARP trappers and other DNA damage response inhibitors, suggesting a promising therapeutic strategy for LMS. Finally, by phylogenetic reconstruction, we present evidence that clones seeding lethal metastases arise decades prior to LMS diagnosis.


Conflict of interest statement

The authors declare no competing interests.

Figures

Fig. 1
Fig. 1. Genomic differences and normal cellular lineages of LMS transcriptional subtypes.
a Principal Component Analysis (PCA) of LMS transcriptomes (n = 79 TCGA RNA-seq and n = 51 Toronto RNA-seq) leads to three defined subtypes of LMS, in which segregation is broadly influenced by anatomical location. While subtype 1 is a mix of all sites (extremity, abdominal and gynecological), subtype 2 is largely abdominal, with some extremity tumors. Subtype 2 can be further sub-stratified into subtype 2a and 2b. The metastatic lesions in subtype 2 cluster with their matched primary tumors. There are two metastatic tumors in subtype 1 that are from the same patient. Lastly, subtype 3 represents a largely gynecological (uterine, vaginal, fallopian tube) subtype. b Genomic point mutation, indel (insertion/deletion), and structural variant (SV) burdens are lower in subtype 2 than subtypes 1 or 3. Horizontal black lines represent the median values for each subtype. Source data are provided in Supplementary Data 7. c LMS molecular subtypes are of distinct smooth muscle lineages: vertices of the triangular plot represent smooth muscle of vasculature, digestive tissue, and gynecological tissue. Individual dots represent LMS cancers and where they lie in the cluster. Adjacent contour plots illustrate density distribution of LMS molecular subtypes. d Uniform Manifold Approximation and Projection (UMAP) illustrates clustering of 271 muscle-related GTEx normal tissue types (from the Genotype-Tissue Expression Program) and 130 LMS reveals distinct smooth muscle lineages of LMS subtypes. e Boxplots represent the expression (in transcripts per million, TPM), for smooth muscle (SM) genes: LMOD1 (leiomodin 1), MYOCD (myocardin), DES (desmin), and CALD1 (caldesmon) are key smooth muscle genes that are commonly expressed in LMS. The boxes represent the 25th and 75th percentile (bottom and top of box), and median value (horizontal band). The whiskers indicate the variability outside the upper and lower quartiles. These genes are highly expressed in vascular (n = 110), digestive (n = 119), and gynecological (Gyn., n = 42) normal smooth muscle. Genes are also expressed in subtype 2 (n = 85) and subtype 3 (n = 22) LMS, but not as highly in LMS subtype 1 (n = 23).
Fig. 2
Fig. 2. Genomic mutation signatures in LMS and functional evaluation of defects in the DNA damage response.
a Non-negative matrix factorization (NMF)-extracted and decomposed single-substitution (SBS), indel (ID) and double-nucleotide signatures (DBS) are illustrated in the heatmaps. Common substitution signatures include SBS1, SBS5, SBS8, and SBS40. SBS3 and ID6 (HR-deficiency) are found in 64% of samples. SBS2, SBS13, and DBS11 reflect localized hypermutation events, also called ‘kataegis’. ID8 represents a radiation signature, commonly seen in patients treated with radiation therapy. ‘Other’ substitution signatures, present in less than 5% of samples, can be found in Supplementary Fig. 13. Color refers to signature activity. b Evaluation of sensitivity to DNA damage response pathway, including PARPi, in soft tissue (ST) LMS cell lines (STS39, STS54, STS137, STS210, and STS551) and gynecological LMS cell lines (SKLMS-1, SK-UT-1 and SK-UT-1B). c Representative boxplots of EC50 from LMS (n = 8) and UPS (n = 5) cell lines treated with the PARP inhibitors, talazoparib, and olaparib. The boxes represent the 25th and 75th percentile (bottom and top of box), and median value (horizontal band). The whiskers indicate the variability outside the upper and lower quartiles. For olaparib treatment, boxplots were generated for seven LMS and three UPS cell lines only, as growth suppression failed to occur in the remaining one LMS and two UPS cell lines along with the RPEΔp53 control. In contrast, all LMS cell lines are responsive to talazoparib (median EC50 0.37 µM) compared to UPS cell lines (median EC50 6.26 µM, p = 0.072, one-sided Welch’s t-test). Detailed information for all patient derived cell lines (LMS and UPS) can be found in Supplementary Data 8 and 9. d The Traffic Light Reporter (TLR) assay uses a fluorescent-based system (GFP and mCherry) to determine Homologous Recombination (HR) and Non-homologous End Joining (NHEJ) efficiencies, upon induction of a double-strand break (DSB). Stable LMS-TLR (STS39-TLR, STS137-TLR, and STS210-TLR) and control cell lines (RPEΔp53-TLR and RPEΔp53ΔBRCA1-TLR) containing a single copy of the TLR I-SceI target site were generated. An I-SceI tagged with BFP was introduced to evaluate repair efficiencies. Repair of the DSB by HR generates distinct fluorescent signals (GFP+), compared to NHEJ (mCherry+). LMS cell lines demonstrate HR-deficiency comparable with the RPEΔp53ΔBRCA1 control cell line. In contrast, GFP+ cells were detected in the HR proficient RPEΔp53 cell line. e The bar plot illustrates quantification of GFP to mCherry signal in each LMS cell line and controls. Intact HR (GFP+) is 6X higher in RPEΔp53, compared to LMS cell lines or the RPEΔp53ΔBRCA1 control. Data are derived from eight cell lines examined over three independent experiments and the error bars represent the standard deviation. Source data are provided as a Source Data file.
Fig. 3
Fig. 3. Clonal evolution and phylogenetic analysis of LMS tumors.
a The clinical course of patient Ab17 with a primary (Dx) and two metastatic relapses (MR1 and MR2) is shown (far left, n = 3 samples). Structural variant (SV) overlaps (middle, top) and the cancer cell fraction (CCF) of single-nucleotide variants (SNVs) (middle, bottom) illustrate that there are many SVs and clonal variants that arise independently in the primary tumors and metastatic relapses. Phylogenetic reconstruction of Ab17’s tumors can be seen on the far right. The founder clone harbors a pathogenic TP53 substitution, whole-genome duplication (WGD), as well as loss-of-heterozygosity (LOH) events encompassing TP53 and RB1. The color of each circle represents a distinct clone population. The clonal trajectory and final composition are shown per sample. Branch lengths are proportional to Treeomics mutation assignments. b Rainfall plots of patient Ab17 in diagnosis and their first metastatic relapse illustrate differential kataegis events at different chromosomes between the two time points. Targeted sequencing data were used to confirm kataegis events were unique to each specimen. c The clinical course for patient Ab12 is depicted, which involved no prior treatment and only surgery. The primary specimen at diagnosis (Dx) was located in the inferior vena cava. The tumor was bisected and punch-hole biopsied in three physically distant multiregion (MuRe) locations (n = 3 samples). The phylogenetic reconstruction of this tumor is shown on the right of the schematic and a photo of the resection. The founder clone harbors a pathogenic TP53 substitution, as well as LOH events encompassing TP53, RB1, and PTEN. Larger circles represent major clones, whereas smaller circles represent subclones. The color of each circle represents a distinct clone population. The clonal trajectory and final composition are shown per sample. Branch lengths are proportional to Treeomics mutation assignments, except for clones 8,10 and 6,7 where DPClust mutation assignments were used to stratify the sample.
Fig. 4
Fig. 4. Parallel evolution of LMS tumors.
The clinical courses of two patients with LMS are shown (samples per patient >3). For the phylogenies, larger circles represent major clones, whereas smaller circles represent subclones. The color of each clone represents a distinct clone population. The clonal trajectory and final composition are shown per sample. Branch lengths are proportional to Treeomics mutation assignments. (a) Patient Ab6 was treated with radiofrequency ablation (RFA) and chemotherapy (chemo). They had three tumors at three separate time points (T1, T2, and T3). The primary tumor at diagnosis (Dx) was located in the small intestine, while the first metastatic relapse (MR1) was located in the liver. The second metastatic relapse (MR2) was multifocal and detected in the vastus lateralis (thigh muscle). MR2 was bisected and biopsies were taken from five distinct sections from both foci (Regions/Re 1–5). Following bulk (Dx, MR1) and multiregion (MR2) sequencing, phylogenetic reconstruction can be seen on the right. Early substitutions in TP53, RB1 and CREBBP, as well as LOH events of chromosomes 10 (PTEN), 13 (RB1), and 17 (TP53) are observed in the founder clone of this patient’s tumors. Chromosome 11 kataegis events and an SPEN deletion were common to Dx and MR2, but not MR1. Genome doubling and chromosome X kataegis occurred only in MR2. Metastatic multifocal nodes greatly resemble each other. Using clock-like mutagenesis, the Dx and MR1 diverge approximately 30 years pre-diagnosis in these patients, while Dx and MR2 diverge approximately 25 years pre-diagnosis. (b) Patient Ab11 was treated with radiation therapy (RT) and had two tumors at two separate time points (T1 and T2). The Dx was located at the posterior aspect of the right kidney and inferior vena cava. This tumor was bisected en face and biopsies were taken from four regions. The metastatic relapses (MR1-3) were taken from the liver. Following bulk (T2: MR1-3) and multiregion (T1: Dx, Regions/Re1-4) sequencing, phylogenetic reconstruction can be seen on the right. Much like Ab6, early losses of chromosomes 10, 13, and 17 are observed. Also seen early are AXIN1 and TET2 point mutations, an ATRX deletion, and a RB1 translocation. Chromosome 2 kataegis events are unique to Dx, while chr 6 chromothripsis events are unique to MR1-3. A chromosome12 kataegis event occurs only in 2/3 liver metastases. Using clock-like mutagenesis, Dx and MR1-3 diverge approximately 15 years pre-diagnosis in this patient.

References

    1. WHO Classification of Tumours of Soft Tissue and Bone, 5th Edition, vol 3. Lyon (France). (International Agency for Research on Cancer, 2020).
    1. Gladdy, R. A. et al. Predictors of survival and recurrence in primary leiomyosarcoma. Ann. Surg. Oncol. (2013), 10.1245/s10434-013-2876-y. - PMC - PubMed
    1. Mbatani, N., Olawaiye, A. B. & Prat, J. Uterine sarcomas. Int. J. Gynecol. Obstet. (2018), 10.1002/ijgo.12613. - PubMed
    1. Judson, I. et al. Doxorubicin alone versus intensified doxorubicin plus ifosfamide for first-line treatment of advanced or metastatic soft-tissue sarcoma: a randomised controlled phase 3 trial. Lancet Oncol. (2014), 10.1016/S1470-2045(14)70063-4. - PubMed
    1. Chudasama, P. et al. Integrative genomic and transcriptomic analysis of leiomyosarcoma. Nat. Commun. (2018), 10.1038/s41467-017-02602-0. - PMC - PubMed

Publication types

MeSH terms

Grants and funding