. 2021 Jul 23;11(1):15082.
doi: 10.1038/s41598-021-93404-4.

A quantum material spintronic resonator

Affiliations

A quantum material spintronic resonator

Jun-Wen Xu et al. Sci Rep. .

Abstract

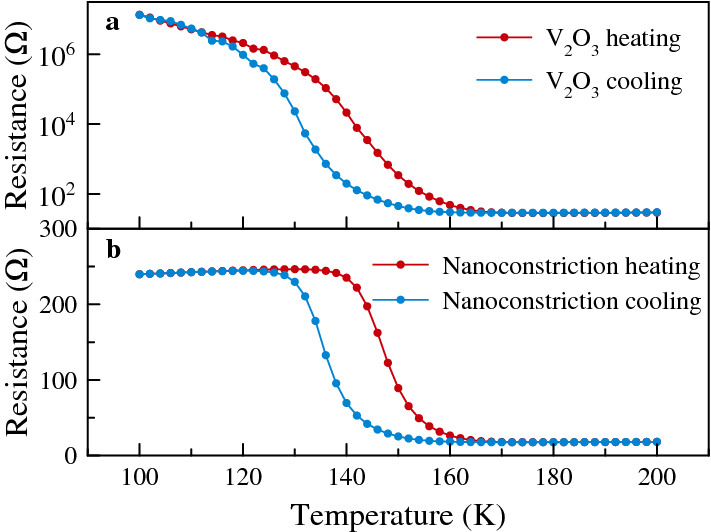
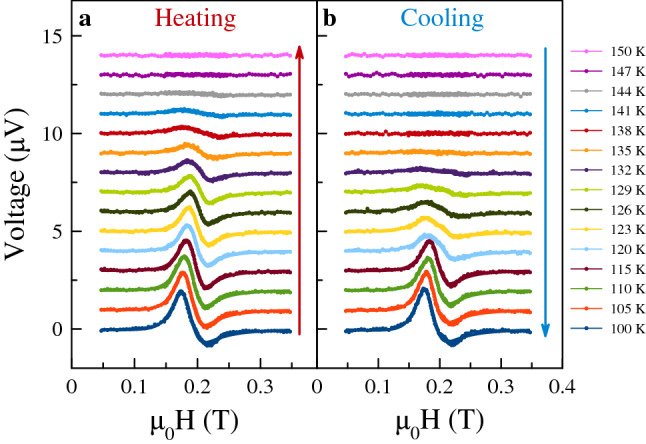
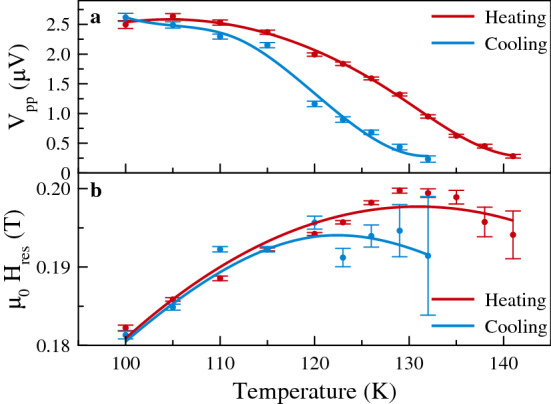
In a spintronic resonator a radio-frequency signal excites spin dynamics that can be detected by the spin-diode effect. Such resonators are generally based on ferromagnetic metals and their responses to spin torques. New and richer functionalities can potentially be achieved with quantum materials, specifically with transition metal oxides that have phase transitions that can endow a spintronic resonator with hysteresis and memory. Here we present the spin torque ferromagnetic resonance characteristics of a hybrid metal-insulator-transition oxide/ ferromagnetic metal nanoconstriction. Our samples incorporate [Formula: see text], with Ni, Permalloy ([Formula: see text]) and Pt layers patterned into a nanoconstriction geometry. The first order phase transition in [Formula: see text] is shown to lead to systematic changes in the resonance response and hysteretic current control of the ferromagnetic resonance frequency. Further, the output signal can be systematically varied by locally changing the state of the [Formula: see text] with a dc current. These results demonstrate new spintronic resonator functionalities of interest for neuromorphic computing.


Conflict of interest statement

The authors declare no competing interests.

Figures

Figure 1
Figure 1
A nanoconstriction spintronic resonator. (a) Schematic shows the layers and the geometry. The signal (S) and ground (G) electrical contacts are indicated (not to scale). (b) SEM image of a 200 nm nanoconstriction. The blue lines with arrows illustrate the current flow through the constriction. The line density is proportional to the current density determined from a COMSOL simulation.
Figure 2
Figure 2
Sample electrical properties. (a) Resistance versus temperature measurement of a V2O3 film. (b) Resistance versus temperature measurement of a 200 nm lateral scale nanoconstriction formed from V2O3|Ni|Py|Pt layers.
Figure 3
Figure 3
ST-FMR spectra. The field is swept at a fixed rf frequency of 7 to 16 GHz and the curves are offset from one another to align their baseline with their rf frequency on the right axis. Prior to each measurement the sample is cooled to 100 K and then raised to the measurement temperature of 120 K to ensure the V2O3 is in an insulating state. The square symbols indicate the resonance field associated with the rf frequency on the right hand y-axis. The pink curve is a fit to the Kittel model described in the main text.
Figure 4
Figure 4
ST-FMR on heating and cooling through the V2O3 phase transition. (a) Data obtained on heating the sample, from 100 to 150 K. (b) Data obtained on cooling the sample within the same temperature range. The long red (in (a)) and blue (in (b)) arrows indicate in the sense in which the temperature was changed. In both cases the rf frequency is fixed at 10 GHz.
Figure 5
Figure 5
ST-FMR hysteresis. Signal amplitudes (a) and resonance fields (b) at an rf frequency of 10 GHz obtained from fits to the data in Fig. 4. The red points are from ST-FMR data taken on heating and the blue symbols from data on cooling the sample. The lines are guides to the eye. The increasing uncertainty in the resonance field with increasing temperature is associated with the decreasing signal amplitude with temperature (see Fig. 4).
Figure 6
Figure 6
Tuning nanoconstriction characteristics with a dc current. (a) Nanoconstriction resistance versus current up to 20 mA starting at different initial temperatures. (b) Resistance versus current up to different maximum currents at a fixed temperature of 135 K. After each resistance-current sweep the sample was initialized by cooling to 100 K. (c) The ST-FMR spectra corresponding to the states in (b) at zero current, i.e. after applying the dc current indicated. Each curve is offset by 0.5μV. As a reference the black curve shows the ST-FMR spectra before applying current. The resonance fields are marked by the pink squares and the trend is illustrated by the pink curve.

References

    1. Hellman F, et al. Interface-induced phenomena in magnetism. Rev. Mod. Phys. 2017;89:025006. doi: 10.1103/RevModPhys.89.025006. - DOI - PMC - PubMed
    1. Saerbeck T, et al. Coupling of magnetism and structural phase transitions by interfacial strain. J. Mater. Res. 2014;29:2353. doi: 10.1557/jmr.2014.253. - DOI
    1. De La Venta J, et al. Coercivity enhancement in V2O3/Ni bilayers driven by nanoscale phase coexistence. Appl. Phys. Lett. 2014;104:062410. doi: 10.1063/1.4865587. - DOI
    1. Lauzier J, Sutton L, De La Venta J. Magnetic irreversibility in VO2/Ni bilayers. J. Phys.: Condens. Matter. 2018;30:374004. - PubMed
    1. Ramírez JG, et al. Collective mode splitting in hybrid heterostructures. Phys. Rev. B. 2016;93:214113. doi: 10.1103/PhysRevB.93.214113. - DOI