. 2021 Jul 23;11(1):15108.
doi: 10.1038/s41598-021-93970-7.

Genomic evolution of antimicrobial resistance in Escherichia coli

Collaborators, Affiliations

Genomic evolution of antimicrobial resistance in Escherichia coli

Pimlapas Leekitcharoenphon et al. Sci Rep. .

Abstract

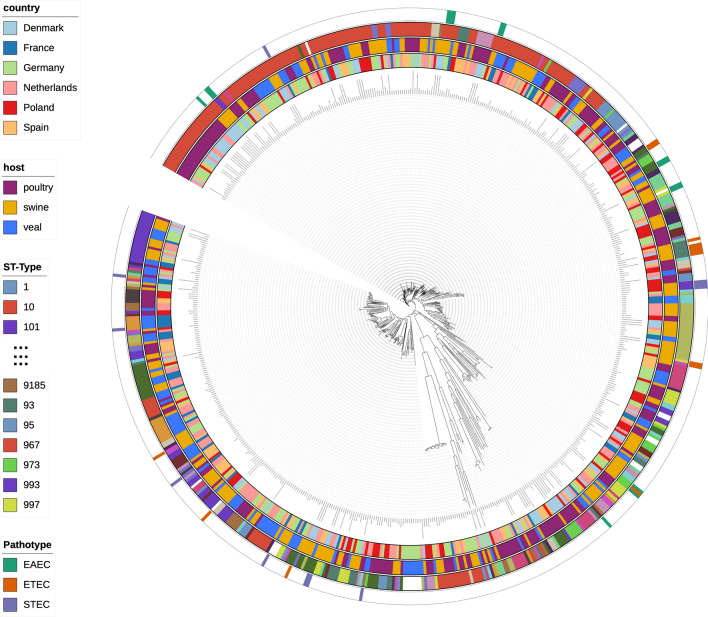
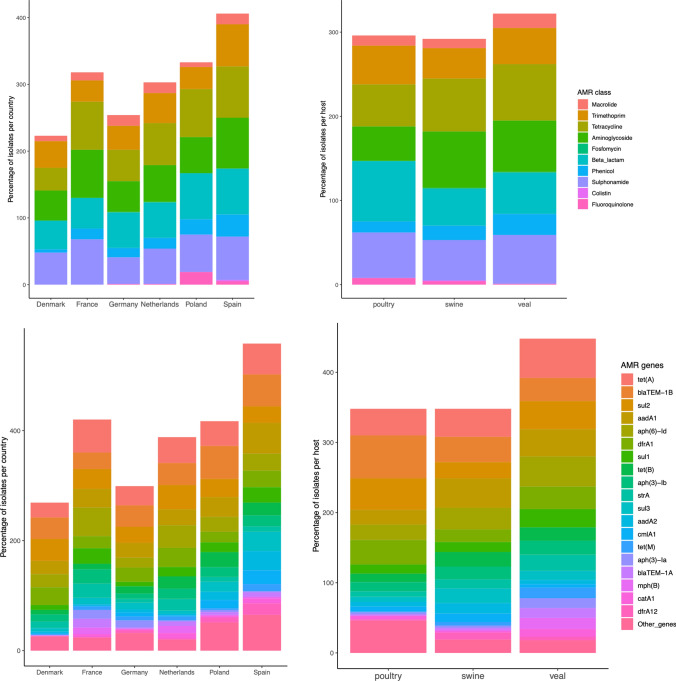
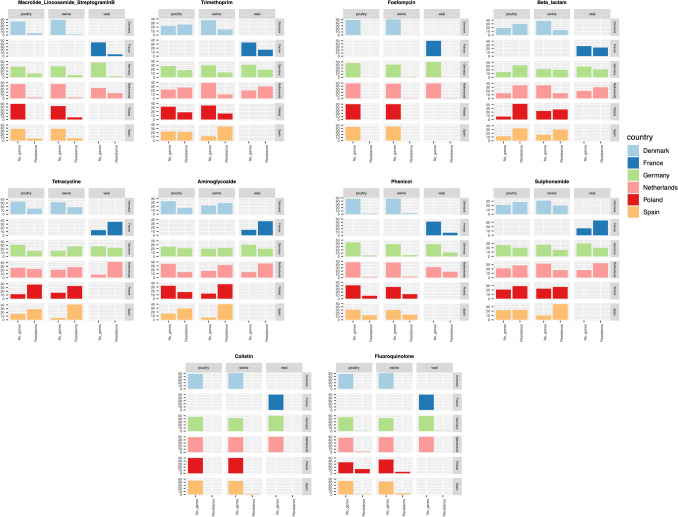
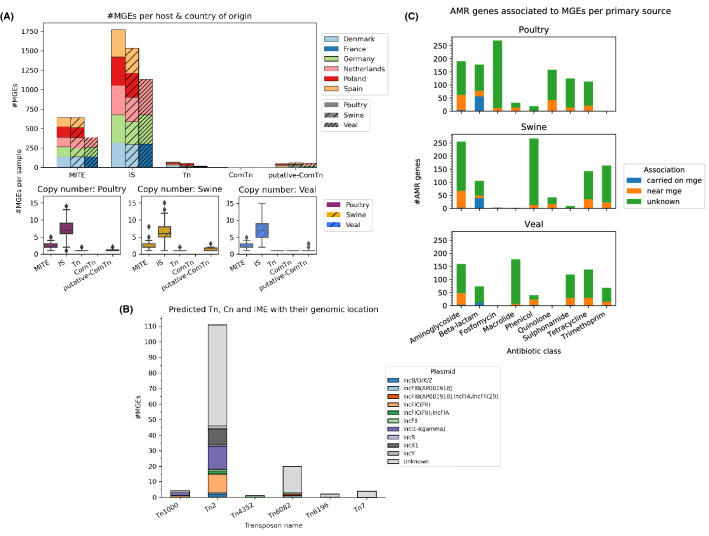
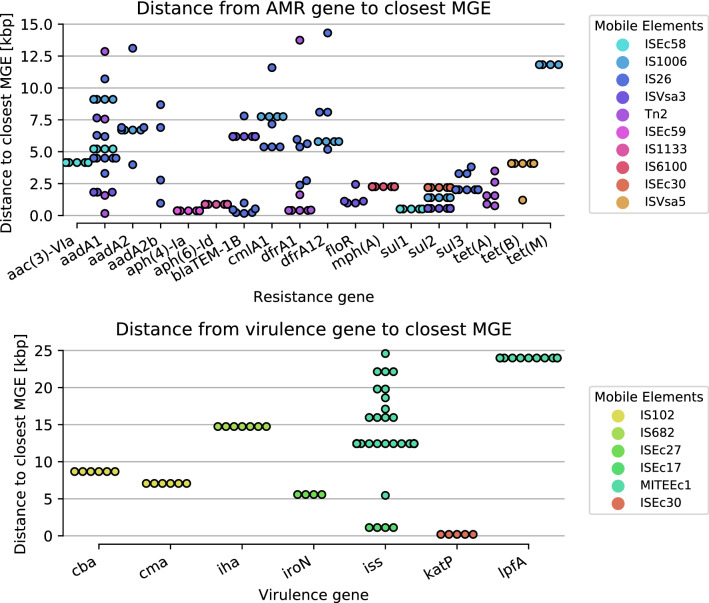
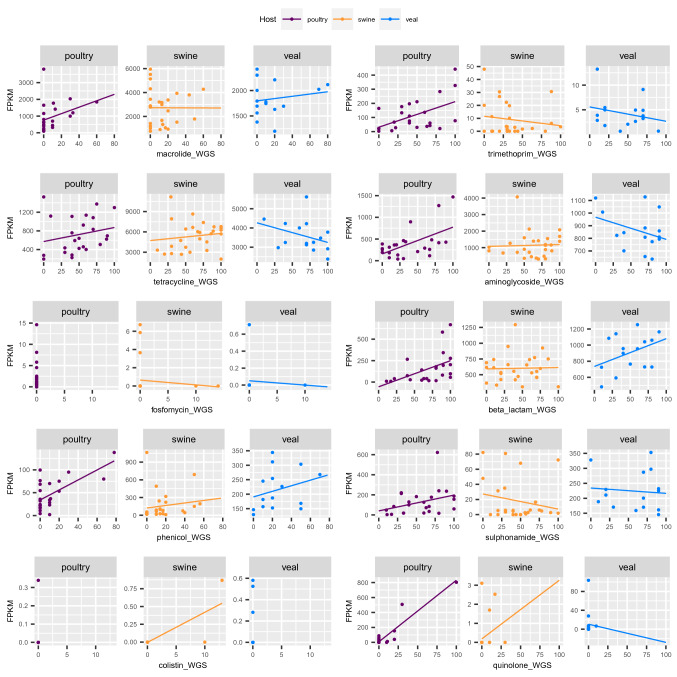
The emergence of antimicrobial resistance (AMR) is one of the biggest health threats globally. In addition, the use of antimicrobial drugs in humans and livestock is considered an important driver of antimicrobial resistance. The commensal microbiota, and especially the intestinal microbiota, has been shown to have an important role in the emergence of AMR. Mobile genetic elements (MGEs) also play a central role in facilitating the acquisition and spread of AMR genes. We isolated Escherichia coli (n = 627) from fecal samples in respectively 25 poultry, 28 swine, and 15 veal calf herds from 6 European countries to investigate the phylogeny of E. coli at country, animal host and farm levels. Furthermore, we examine the evolution of AMR in E. coli genomes including an association with virulence genes, plasmids and MGEs. We compared the abundance metrics retrieved from metagenomic sequencing and whole genome sequenced of E. coli isolates from the same fecal samples and farms. The E. coli isolates in this study indicated no clonality or clustering based on country of origin and genetic markers; AMR, and MGEs. Nonetheless, mobile genetic elements play a role in the acquisition of AMR and virulence genes. Additionally, an abundance of AMR was agreeable between metagenomic and whole genome sequencing analysis for several AMR classes in poultry fecal samples suggesting that metagenomics could be used as an indicator for surveillance of AMR in E. coli isolates and vice versa.


Conflict of interest statement

The authors declare no competing interests.

Figures

Figure 1
Figure 1
SNP tree of 627 E. coli isolates. The tree was constructed from 17,213 SNPs. The legends from inner circle to outer circle are country, host, ST type and pathotype. There are 182 different ST types with 24 isolates characterized as unknown ST type. Only a number of ST type can be showed in figure legend. EAEC Enteroaggregative E. coli, ETEC Enterotoxigenic E. coli and STEC Shiga toxin-producing E. coli.
Figure 2
Figure 2
Average nucleotide identity in mean percent identity of E. coli isolates from the same farm (A) and from the same animal host (B). DK Denmark, FR France, DE Germany, NL The Netherlands, PL Poland and ES Spain. Vertical line represents points within 1st/3rd + 1.5 IQR. A red horizontal line indicates mean of overall nucleotide identity (98.34%).
Figure 3
Figure 3
Bar plot showing percentage of resistant E. coli isolates in AMR classes (top) and genes (bottom) stratified by country (left) and host (right).
Figure 4
Figure 4
Distribution of resistance and susceptible E. coli isolates in different AMR class and host. Y-axis is number of isolates. Three columns are number of isolates from poultry, swine and veal. In each column, first bar is number of susceptible isolates and second bar is number of resistant isolates.
Figure 5
Figure 5
(A) Distribution of mobile genetic elements (MGEs) in E. coli isolates per animal host and country of origin (top). Distribution of MGEs per E. coli isolate in different animal hosts (bottom). Cn XX, IS insertion sequences, MITE miniature inverted-repeat transposable elements, and Tn transposons. (B) Distribution of transposons and their plasmids. (C) Number of MGEs associated with mobile elements per antimicrobial class and animal source. There are three levels of associations, carried on MGEs, if MGE is located within 31 kbp from an AMR and unknown association.
Figure 6
Figure 6
Distance from AMR gene (top) and virulence gene (bottom) to closest MGE.
Figure 7
Figure 7
Scatter plot between abundance of AMR genes from metagenomic fecal samples and percentage of E. coli isolates carrying AMR genes from the same farm. X-axis is percentage of E. coli isolates carrying resistance genes. Y-axis represents abundance of resistance genes in FPKM (Fragments Per Kilo base per Million fragments) from metagenomic fecal samples.

References

    1. Berg RD. The indigenous gastrointestinal microflora. Trends Microbiol. 1996;4:430–435. doi: 10.1016/0966-842X(96)10057-3. - DOI - PubMed
    1. Gordon DM, Cowling A. The distribution and genetic structure of Escherichia coli in Australian vertebrates: Host and geographic effects. Microbiology. 2003;149:3575–3586. doi: 10.1099/mic.0.26486-0. - DOI - PubMed
    1. Kosek M, Bern C, Guerrant RL. The global burden of diarrhoeal disease, as estimated from studies published between 1992 and 2000. Bull. World Health Organ. 2003;81:197–204. - PMC - PubMed
    1. Russo TA, Johnson JR. Medical and economic impact of extraintestinal infections due to Escherichia coli: Focus on an increasingly important endemic problem. Microbes Infect. 2003;5:449–456. doi: 10.1016/S1286-4579(03)00049-2. - DOI - PubMed
    1. Tenaillon O, Skurnik D, Picard B, Denamur E. The population genetics of commensal Escherichia coli. Nat. Rev. Microbiol. 2010;8:207–217. doi: 10.1038/nrmicro2298. - DOI - PubMed

Publication types

MeSH terms

Substances