. 2021 Nov 10;40(25):5487-5500.
doi: 10.1002/sim.9136. Epub 2021 Jul 24.

Penalized regression for left-truncated and right-censored survival data

Affiliations

Penalized regression for left-truncated and right-censored survival data

Sarah F McGough et al. Stat Med. .

Abstract

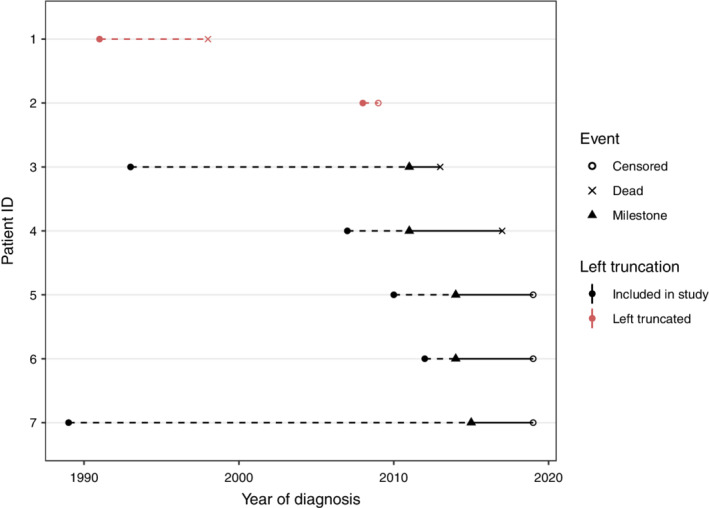
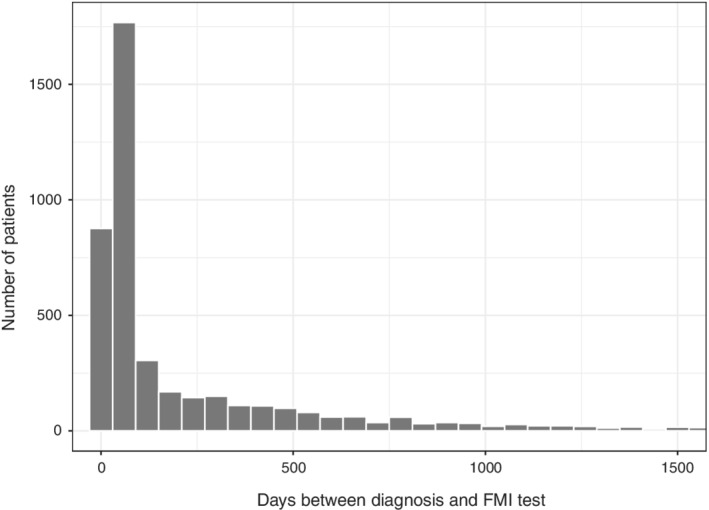
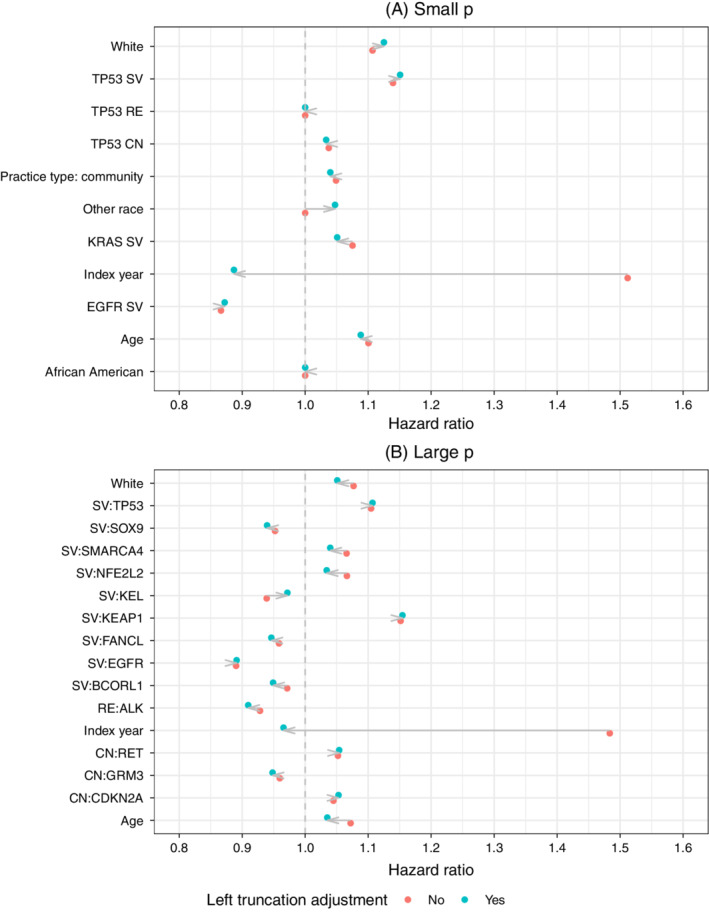
High-dimensional data are becoming increasingly common in the medical field as large volumes of patient information are collected and processed by high-throughput screening, electronic health records, and comprehensive genomic testing. Statistical models that attempt to study the effects of many predictors on survival typically implement feature selection or penalized methods to mitigate the undesirable consequences of overfitting. In some cases survival data are also left-truncated which can give rise to an immortal time bias, but penalized survival methods that adjust for left truncation are not commonly implemented. To address these challenges, we apply a penalized Cox proportional hazards model for left-truncated and right-censored survival data and assess implications of left truncation adjustment on bias and interpretation. We use simulation studies and a high-dimensional, real-world clinico-genomic database to highlight the pitfalls of failing to account for left truncation in survival modeling.

Keywords: Cox model; high-dimensional data; lasso; left truncation; penalized regression; survival analysis.


Figures

FIGURE 1
FIGURE 1
Left‐truncated and right‐censored patient follow‐up in a hypothetical study cohort, ordered chronologically by event time. Patients who receive a diagnosis (closed circle) become eligible to enter the cohort after reaching a milestone (black triangle), for example a genomic test. Patients are followed until death (open circle) or censoring (cross). However, patients who die or are censored before reaching the milestone are left‐truncated (in red), and only those who have survived until eligibility (in black) are observed. Left truncation time, or the time between diagnosis and cohort entry, is shown with a dashed line. Left truncation time is also referred to as “entry time” [Colour figure can be viewed at wileyonlinelibrary.com]
FIGURE 2
FIGURE 2
Distribution of left truncation time (days) in nonsmall cell lung cancer patients in the clinico‐genomic database
FIGURE 3
FIGURE 3
Calibration of survival predictions for lasso model in simulation: Notes: The Cox model with lasso penalty using the training data and was subsequently used to predict the survival function for each patient in the test set. The small and large p models contained 21 and 1011 predictors, respectively. Patients were divided into deciles at each time point based on their predicted survival probabilities. Each point in the plot represents patients within a decile. The “Predicted survival probability” is the average of the predicted survival probabilities from the Cox model across patients within each decile and the “Observed survival probability” is the Kaplan‐Meier estimate of the proportion surviving within each decile. A perfect prediction lies on the black 45 degree line [Colour figure can be viewed at wileyonlinelibrary.com]
FIGURE 4
FIGURE 4
Hazard ratios from Cox lasso model: Notes: The figure for the “Large” p model only includes variables ranked in the top 10 by the absolute value of the hazard ratio in either the left truncation adjusted or nonadjusted model [Colour figure can be viewed at wileyonlinelibrary.com]
FIGURE 5
FIGURE 5
Calibration of survival predictions in the clinico‐genomic database from the Cox lasso model [Colour figure can be viewed at wileyonlinelibrary.com]

References

    1. Gui J, Li H. Penalized Cox regression analysis in the high‐dimensional and low‐sample size settings, with applications to microarray gene expression data. Bioinformatics. 2005;21(13):3001‐3008. - PubMed
    1. Wishart GC, Azzato EM, Greenberg DC, et al. PREDICT: a new UK prognostic model that predicts survival following surgery for invasive breast cancer. Breast Cancer Res. 2010;12(1):R1. - PMC - PubMed
    1. Ow GS, Kuznetsov VA. Big genomics and clinical data analytics strategies for precision cancer prognosis. Sci Rep. 2016;6:36493. - PMC - PubMed
    1. Yousefi S, Amrollahi F, Amgad M, et al. Predicting clinical outcomes from large scale cancer genomic profiles with deep survival models. Sci Rep. 2017;7(1):1‐11. - PMC - PubMed
    1. Tibshirani R. The lasso method for variable selection in the Cox model. Stat Med. 1997;16(4):385‐395. - PubMed

LinkOut - more resources