

Management of arterial partial pressure of carbon dioxide in the first week after traumatic brain injury: results from the CENTER-TBI study
- PMID: 34302517
- PMCID: PMC8308080
- DOI: 10.1007/s00134-021-06470-7
Management of arterial partial pressure of carbon dioxide in the first week after traumatic brain injury: results from the CENTER-TBI study
Abstract
Purpose: To describe the management of arterial partial pressure of carbon dioxide (PaCO2) in severe traumatic brain-injured (TBI) patients, and the optimal target of PaCO2 in patients with high intracranial pressure (ICP).
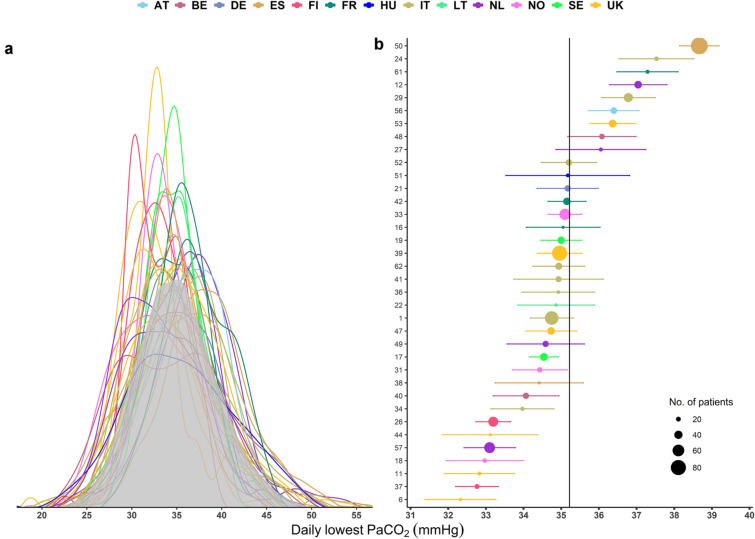
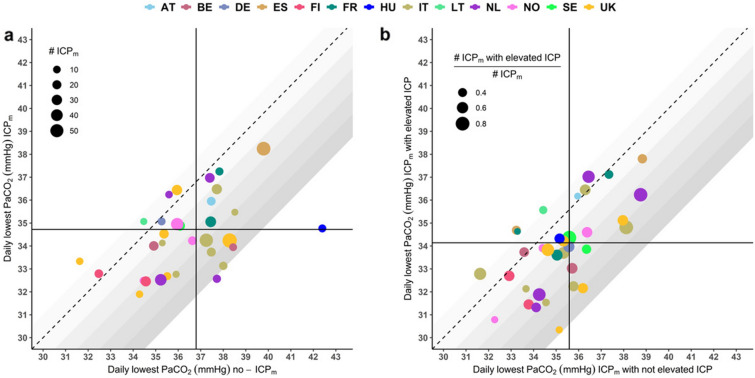
Methods: Secondary analysis of CENTER-TBI, a multicentre, prospective, observational, cohort study. The primary aim was to describe current practice in PaCO2 management during the first week of intensive care unit (ICU) after TBI, focusing on the lowest PaCO2 values. We also assessed PaCO2 management in patients with and without ICP monitoring (ICPm), and with and without intracranial hypertension. We evaluated the effect of profound hyperventilation (defined as PaCO2 < 30 mmHg) on long-term outcome.
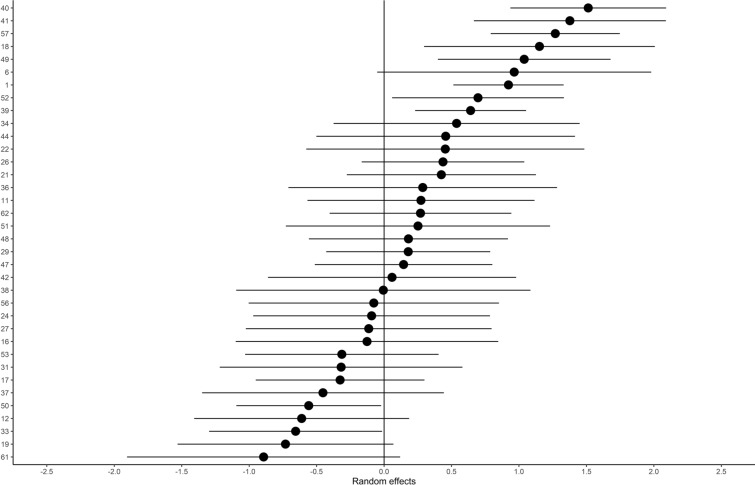
Results: We included 1100 patients, with a total of 11,791 measurements of PaCO2 (5931 lowest and 5860 highest daily values). The mean (± SD) PaCO2 was 38.9 (± 5.2) mmHg, and the mean minimum PaCO2 was 35.2 (± 5.3) mmHg. Mean daily minimum PaCO2 values were significantly lower in the ICPm group (34.5 vs 36.7 mmHg, p < 0.001). Daily PaCO2 nadir was lower in patients with intracranial hypertension (33.8 vs 35.7 mmHg, p < 0.001). Considerable heterogeneity was observed between centers. Management in a centre using profound hyperventilation (HV) more frequently was not associated with increased 6 months mortality (OR = 1.06, 95% CI = 0.77-1.45, p value = 0.7166), or unfavourable neurological outcome (OR 1.12, 95% CI = 0.90-1.38, p value = 0.3138).
Conclusions: Ventilation is manipulated differently among centers and in response to intracranial dynamics. PaCO2 tends to be lower in patients with ICP monitoring, especially if ICP is increased. Being in a centre which more frequently uses profound hyperventilation does not affect patient outcomes.
Trial registration: ClinicalTrials.gov NCT02210221.
Keywords: Carbon dioxide; Hyperventilation; Intracranial pressure; Outcome; Traumatic brain injury.
© 2021. The Author(s).
Conflict of interest statement
GC reports grants, personal fees as Speakers’ Bureau Member and Advisory Board Member from Integra and Neuroptics. DKM reports grants from the European Union and UK National Institute for Health Research, during the conduct of the study; grants, personal fees, and non-financial support from GlaxoSmithKline; personal fees from Neurotrauma Sciences, Lantmaanen AB, Pressura, and Pfizer, outside of the submitted work. The other authors declare that they have no competing interests.
Figures
Comment in
-
Moderate hypocapnia for intracranial pressure control after traumatic brain injury: a common practice requiring further investigations.Intensive Care Med. 2021 Sep;47(9):1009-1010. doi: 10.1007/s00134-021-06489-w. Epub 2021 Aug 14. Intensive Care Med. 2021. PMID: 34392424 No abstract available.
References
-
- Hoiland RL, Fisher JA, Ainslie PN (2019) Regulation of the Cerebral Circulation by Arterial Carbon Dioxide. In: Compr. Physiol. Wiley. 10.1002/cphy.c180021 - PubMed
-
- Lundberg N, Kjallquist A, Bien C (1949) Reduction of increased intracranial pressure by hyperventilation. A therapeutic aid in neurological surgery, Acta Psychiatr. Scand. Suppl. 34:1–64. http://www.ncbi.nlm.nih.gov/pubmed/14418913. - PubMed
