. 2021 Jul 24;116(1):46.
doi: 10.1007/s00395-021-00886-4.

Regulatory B cells improve ventricular remodeling after myocardial infarction by modulating monocyte migration

Affiliations

Regulatory B cells improve ventricular remodeling after myocardial infarction by modulating monocyte migration

Jiao Jiao et al. Basic Res Cardiol. .

Abstract

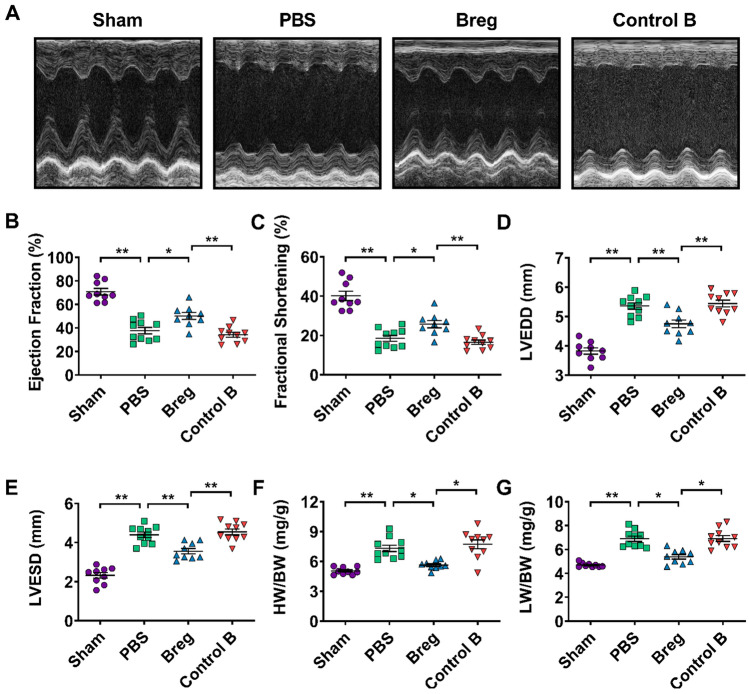
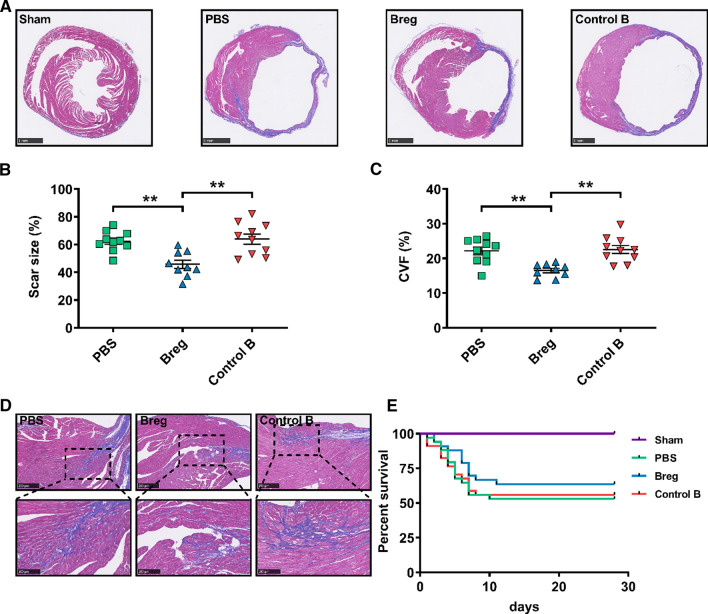
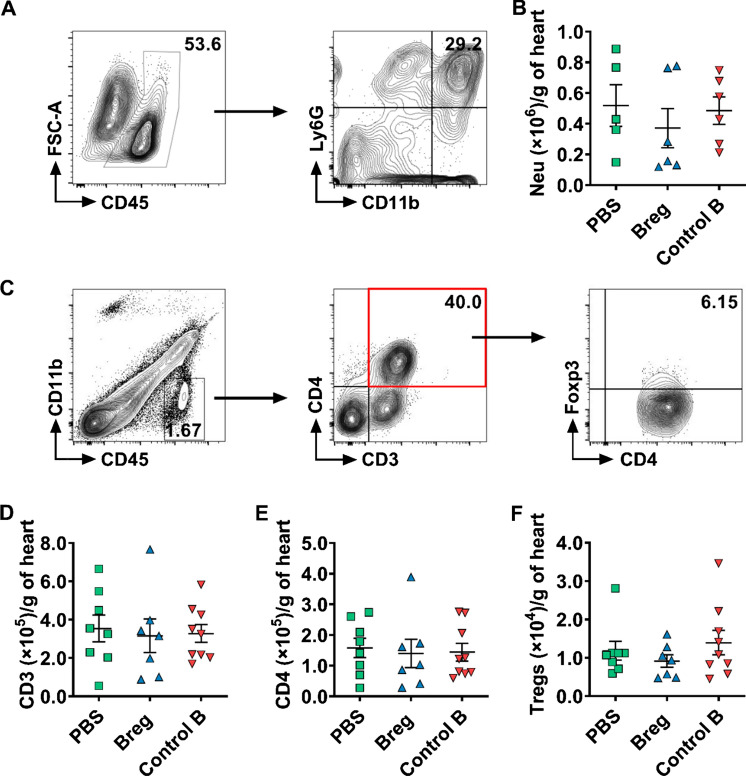
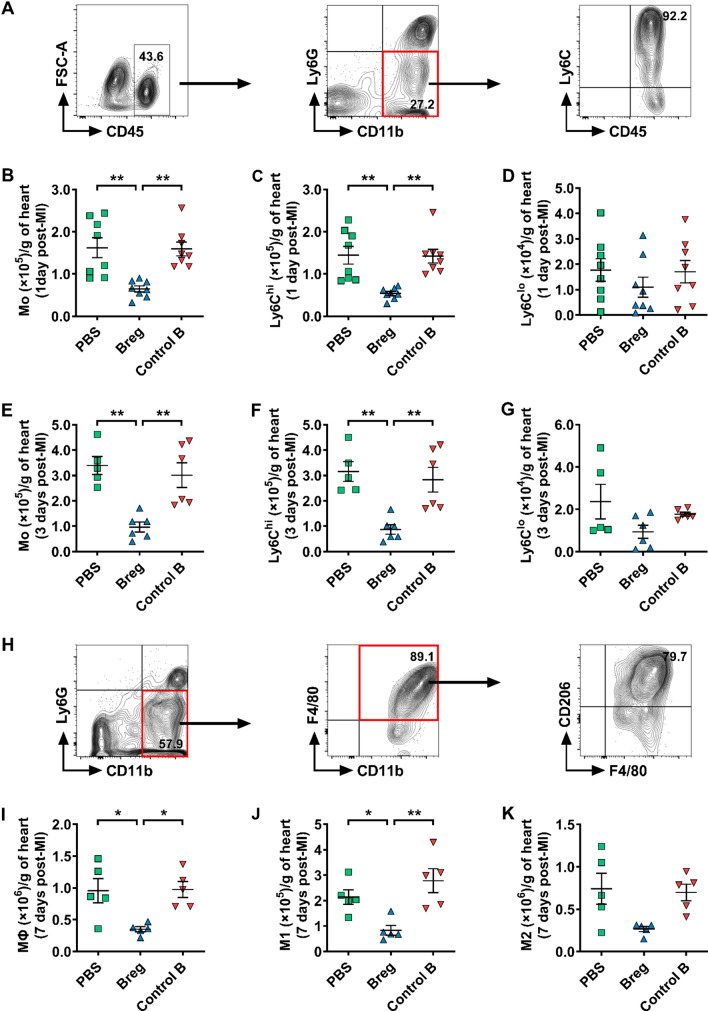
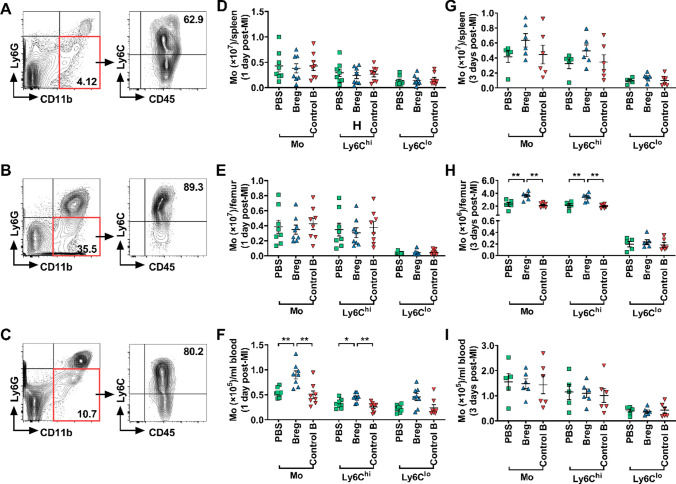
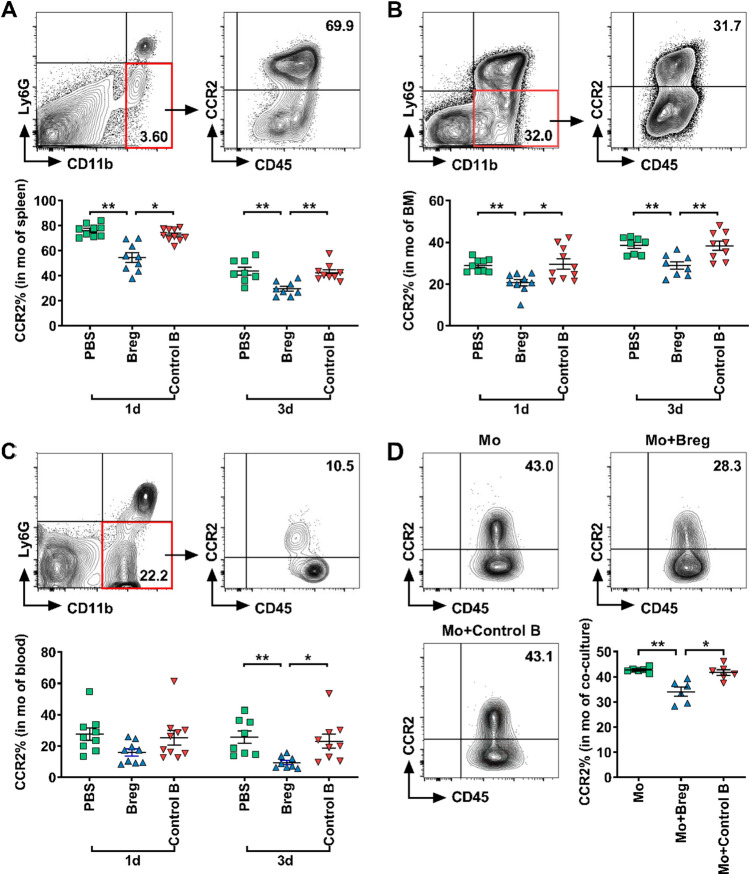
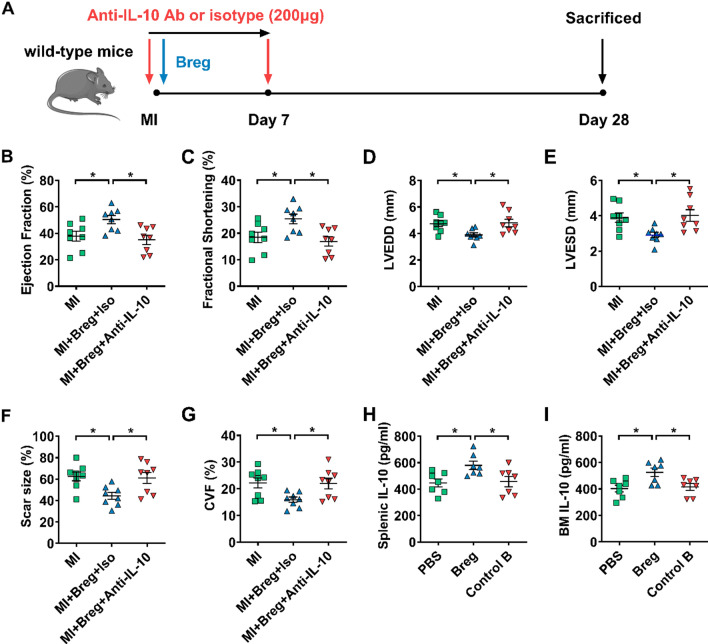
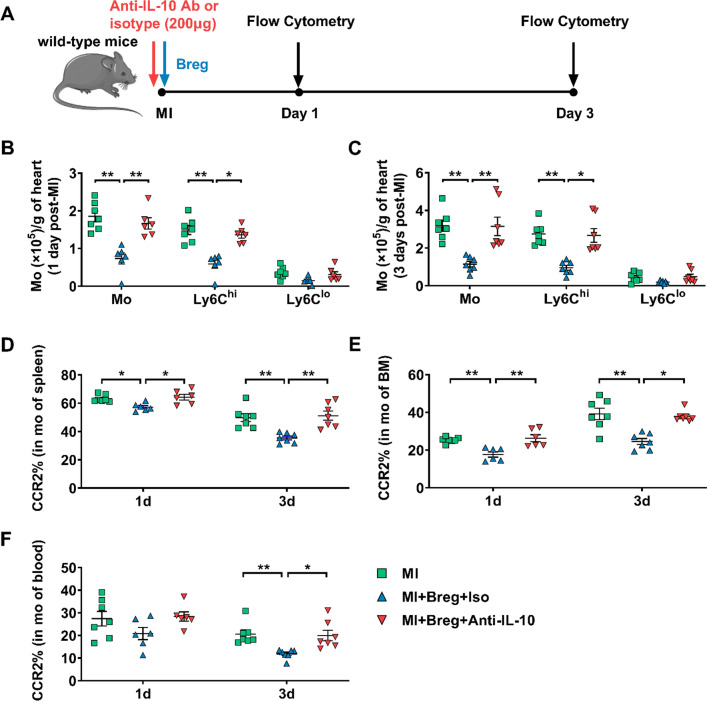
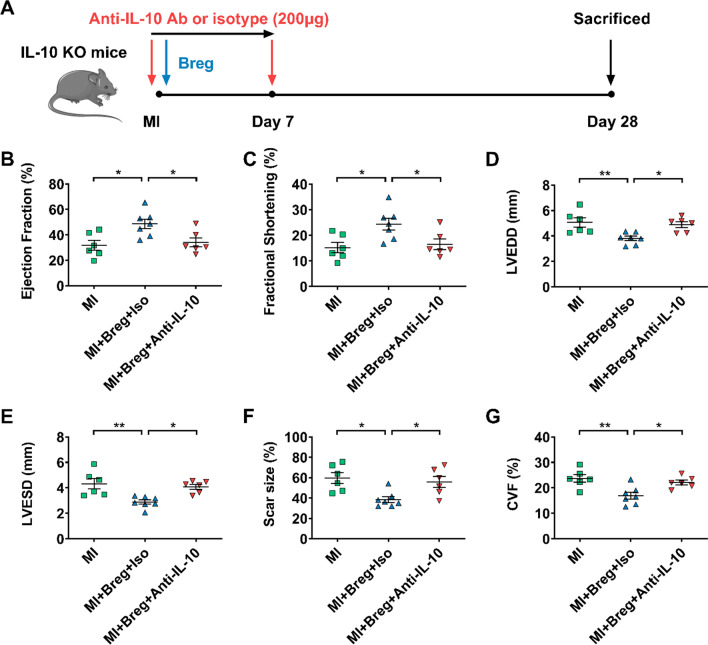
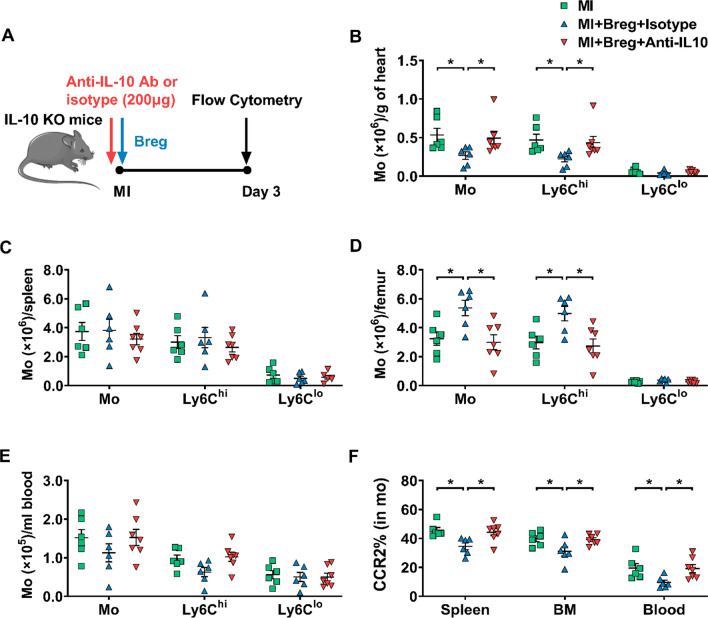
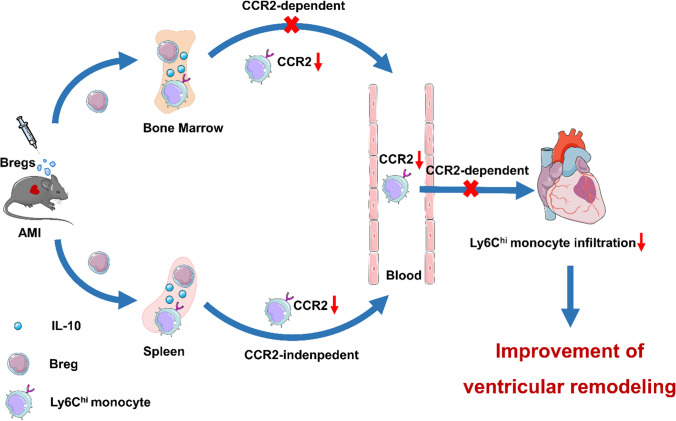
Overactivated inflammatory responses contribute to adverse ventricular remodeling after myocardial infarction (MI). Regulatory B cells (Bregs) are a newly discovered subset of B cells with immunomodulatory roles in many immune and inflammation-related diseases. Our study aims to determine whether the expansion of Bregs exerts a beneficial effect on ventricular remodeling and explore the mechanisms involved. Here, we showed that adoptive transfer of Bregs ameliorated ventricular remodeling in a murine MI model, as demonstrated by improved cardiac function, decreased scar size and attenuated interstitial fibrosis without changing the survival rate. Reduced Ly6Chi monocyte infiltration was found in the hearts of the Breg-transferred mice, while the infiltration of Ly6Clo monocytes was not affected. In addition, the replenishment of Bregs had no effect on the myocardial accumulation of T cells or neutrophils. Mechanistically, Bregs reduced the expression of C-C motif chemokine receptor 2 (CCR2) in monocytes, which inhibited proinflammatory monocyte recruitment to the heart from the peripheral blood and mobilization from the bone marrow. Breg-mediated protection against MI was abrogated by treatment with an interleukin 10 (IL-10) antibody. Finally, IL-10 neutralization reversed the effect of Bregs on monocyte migration and CCR2 expression. The present study suggests a therapeutic value of Bregs in limiting ventricular remodeling after MI through decreasing CCR2-mediated monocyte recruitment and mobilization.

Keywords: Interleukin 10; Monocytes; Myocardial infarction; Regulatory B cells; Ventricular remodeling.


Conflict of interest statement

The authors declare that they have no conflicts of interest.

Figures

Fig. 1
Fig. 1
Adoptive transfer of Bregs improves cardiac function after MI. a Representative M‐mode echocardiographic images of the left ventricle 28 days after MI. be Analysis of ejection fraction (b), fractional shortening (c), LVEDD (d) and LVESD (e) by echocardiography at day 28 after MI. n = 9–10 per group. f, g HW/BW and LW/HW were measured at day 28 after MI. n = 9–10 per group. Data are expressed as means ± SEM. *P < 0.05, **P < 0.01. Data in be were analyzed by one-way ANOVA, followed by Tukey’s post hoc test. Data in f and g were analyzed by Kruskal–Wallis test with Dunn’s multiple comparisons test. Sham sham-operated group, PBS MI mice that received phosphate buffered saline, Breg MI mice that received regulatory B cells, Control B MI mice that received control B cells, LVEDD left ventricular end-diastolic dimension, LVESD left ventricular end-systolic dimension, HW/BW heart weight/body weight ratio, LW/BW lung weight/body weight ratio
Fig. 2
Fig. 2
Adoptive transfer of Bregs reduces scar size and fibrosis post-MI. a Representative photomicrographs of scar size evaluated by Masson trichrome staining at day 28 post-MI. Scale bar: 1 mm. b Quantitative analysis of scar size evaluated by Masson trichrome staining at day 28 post-MI. n = 9–10 per group. c Fibrosis assessed by CVF in the peri-infarct zone was compared among the different treatments at day 28 post-MI. n = 9–10 per group. d Representative images showing collagen deposition (blue) evaluated by Masson trichrome staining 28 days after MI. Scale bar: 250 μm (top) or 100 μm (bottom). e Survival analysis of sham mice (n = 18), PBS-treated MI mice (n = 34), Breg-treated MI mice (n = 33), control B cell-treated mice (n = 34) up to 28 days following the operation. Data are expressed as means ± SEM. **P < 0.01. Data in b and c were analyzed by one-way ANOVA, followed by Tukey’s post hoc test. Survival distributions were estimated by the Kaplan–Meier method and compared by log-rank test. Sham sham-operated group, PBS MI mice that received phosphate buffered saline, Breg MI mice that received regulatory B cells, Control B MI mice that received control B cells, CVF collagen volume fraction
Fig. 3
Fig. 3
Bregs do not affect the infiltration of neutrophils or T cells into the myocardium following MI. a Representative flow cytometric images of neutrophils (gated on CD45+CD11b+Ly6G+) in the heart 3 day post-MI. b Absolute numbers of neutrophils infiltrating the heart were analyzed. n = 5–6 per group. c Representative flow cytometric images of CD3+ T cells (gated on CD45+CD11bCD3+), CD4+ T cells (gated on CD45+CD11bCD3+CD4+) and Tregs (gated on CD45+CD11bCD3+CD4+Foxp3+) in the heart 7 days after MI. df Absolute numbers of CD3+ T cells (d), CD4+ T cells (e) and Tregs (f) infiltrating the heart were analyzed. n = 7–9 per group. Data are expressed as means ± SEM. Data in b, e and f were analyzed by Kruskal–Wallis test with Dunn’s multiple comparisons test. Data in d were analyzed by one-way ANOVA, followed by Tukey’s post hoc test. PBS MI mice that received phosphate buffered saline, Breg MI mice that received regulatory B cells, Control B MI mice that received control B cells, Neu neutrophils
Fig. 4
Fig. 4
Bregs impair monocyte infiltration into the heart after MI. a Leukocytes were collected from the heart 1 and 3 day post-MI and stained for CD45, CD11b, Ly6G and Ly6C. Representative flow cytometric images of monocytes (gated on CD45+CD11b+Ly6G) are shown. bd Absolute numbers of monocytes and their subpopulations in the heart 1 day post-MI were analyzed. n = 8 per group. eg Absolute numbers of monocytes and their subpopulations in the heart 3 day post-MI were analyzed. n = 5–6 per group. h Leukocytes were collected from the heart 7 day post-MI and stained for CD45, CD11b, Ly6G, F4/80 and CD206. Representative flow cytometric images of macrophages (gated on CD45+CD11b+Ly6GF4/80+) are shown. ik Absolute numbers of macrophages and their subpopulations in the heart at day 7 post-MI were analyzed. n = 5 per group. Data are expressed as means ± SEM. *P < 0.05, **P < 0.01. Data in b, c, g, i and k were analyzed by Kruskal–Wallis test with Dunn’s multiple comparisons test. Data in df and j were analyzed by one-way ANOVA, followed by Tukey’s post hoc test. PBS MI mice that received phosphate buffered saline, Breg MI mice that received regulatory B cells, Control B MI mice that received control B cells, Mo monocytes, macrophages
Fig. 5
Fig. 5
Breg transfer inhibits monocyte mobilization and recruitment. ac Monocytes were collected from different tissues 1 and 3 days after MI and stained for CD45, CD11b, Ly6G and Ly6C. Representative flow cytometric images of monocytes are shown, respectively. df Absolute numbers of monocytes and their subpopulations in the spleen (d), bone marrow (e), and blood (f) at day 1 post-MI were analyzed. n = 8 per group. gi Absolute numbers of monocytes and their subpopulations in the spleen (g), bone marrow (h), and blood (i) at day 3 post-MI were analyzed. n = 5–6 per group. Data are expressed as means ± SEM. *P < 0.05, **P < 0.01. Data in d, e and f were analyzed by one-way ANOVA, followed by Tukey’s post hoc test (monocytes and Ly6Chi monocytes) or Kruskal–Wallis test with Dunn’s multiple comparisons test (Ly6Clo monocytes). Data in g were analyzed by one-way ANOVA, followed by Tukey’s post hoc test (Ly6Clo monocytes) or Kruskal–Wallis test with Dunn’s multiple comparisons test (monocytes and Ly6Chi monocytes). Data in h and i were analyzed by one-way ANOVA, followed by Tukey’s post hoc test. PBS MI mice that received phosphate buffered saline, Breg MI mice that received regulatory B cells, Control B MI mice that received control B cells, Mo monocytes
Fig. 6
Fig. 6
Bregs reduce CCR2 expression in monocytes. ac Monocytes were collected from different tissues 1 and 3 days after MI and stained for CD45, CD11b, Ly6G and CCR2. Representative flow cytometric images and analysis of CCR2 expression in monocytes after MI in the spleen (a), bone marrow (b) and blood (c) are shown. n = 8–10 per group. d Monocytes sorted from the spleen were co-cultured with Bregs for 1 day, and the CCR2 expression in monocytes were detected using flow cytometry. Representative flow cytometric images and analysis of CCR2 expression in monocytes among the different treatments are shown. n = 6 per group. Data are expressed as means ± SEM. *P < 0.05, **P < 0.01. Data in a and b were analyzed by one-way ANOVA, followed by Tukey’s post hoc test (3d) or Kruskal–Wallis test with Dunn’s multiple comparisons test (1d). Data in c and d were analyzed by Kruskal–Wallis test with Dunn’s multiple comparisons test. PBS MI mice that received phosphate buffered saline, Breg MI mice that received regulatory B cells, Control B MI mice that received control B cells, 1d 1 day post-MI, 3d 3 day post-MI, Mo monocytes cultured alone, Mo + Breg monocytes co-cultured with regulatory B cells, Mo + Control B monocytes co-cultured with control B cells, mo monocytes, BM bone marrow
Fig. 7
Fig. 7
IL-10 plays a critical role in Breg-mediated protection against MI. a Experimental procedures and timeline of surgery and treatment are shown. MI mice were administered with Bregs along with the anti-IL-10 antibody or isotype control antibody. be Ejection fraction (b), fractional shortening (c), LVEDD (d) and LVESD (e) were assessed using echocardiography 28 day post-MI. n = 8 per group. f, g Scar size (f) and CVF (g) were measured by Masson trichrome staining 28 day post-MI. n = 8 per group. h, i PBS, Bregs or control B cells were injected intravenously after the coronary artery was ligated and the expression of IL-10 in the spleen (h) and bone marrow (i) was measured by ELISA at day 1 post-MI. n = 7 per group. Data are expressed as means ± SEM. *P < 0.05. Data in bi were analyzed by one-way ANOVA, followed by Tukey’s post hoc test. MI MI mice control group, MI + Breg + Iso MI mice that received regulatory B cells along with the isotype control antibody, MI + Breg + Anti-IL-10 MI mice that received regulatory B cells along with the anti-IL-10 antibody, PBS MI mice that received phosphate buffered saline, Breg MI mice that received regulatory B cells, Control B MI mice that received control B cells, Ab antibody, LVEDD left ventricular end-diastolic dimension, LVESD left ventricular end-systolic dimension, CVF collagen volume fraction, BM bone marrow
Fig. 8
Fig. 8
Anti-IL-10 antibody antagonizes the effect of Bregs on monocytes in vivo. a Experimental procedures and timeline of surgery and treatment are shown. MI mice were administered with Bregs along with the anti-IL-10 antibody or isotype control antibody. b, c Numbers of monocytes and their subsets that infiltrated into the heart at day 1 (b) and day 3 (c) after MI were detected using flow cytometry. n = 6–7 per group. f CCR2 expression in monocytes from the spleen (d), bone marrow (e), and blood (f) was measured 1 and 3 day post-MI. n = 6–7 per group. Data are expressed as means ± SEM. *P < 0.05, **P < 0.01. Data in b were analyzed by one-way ANOVA, followed by Tukey’s post hoc test (monocytes and Ly6Clo monocytes) or Kruskal–Wallis test with Dunn’s multiple comparisons test (Ly6Chi monocytes). Data in c were analyzed by Kruskal–Wallis test with Dunn’s multiple comparisons test. Data in d were analyzed by one-way ANOVA, followed by Tukey’s post hoc test (3d) or Kruskal–Wallis test with Dunn’s multiple comparisons test (1d). Data in e and f were analyzed by one-way ANOVA, followed by Tukey’s post hoc test (1d) or Kruskal–Wallis test with Dunn’s multiple comparisons test (3d). MI MI mice control group, MI + Breg + Iso MI mice received regulatory B cells along with the isotype control antibody, MI + Breg + Anti-IL-10 MI mice received regulatory B cells along with the anti-IL-10 antibody, Ab antibody, Mo or mo monocytes, BM bone marrow
Fig. 9
Fig. 9
Bregs protect against MI through an IL-10-dependent mechanism. a Experimental procedures and timeline of surgery and treatment are shown. IL-10 KO MI mice were administered with Bregs along with the anti-IL-10 antibody or isotype control antibody. be Ejection fraction (b), fractional shortening (c), LVEDD (d) and LVESD (e) were assessed using echocardiography 28 days after MI. n = 6–7 per group. f, g Scar size (f) and CVF (g) were measured by Masson trichrome staining 28 days after MI. n = 6–7 per group. Data are expressed as means ± SEM. *P < 0.05, **P < 0.01. Data in bg were analyzed by one-way ANOVA, followed by Tukey’s post hoc test. MI MI mice control group, MI + Breg + Iso MI mice that received regulatory B cells along with the isotype control antibody, MI + Breg + Anti-IL-10 MI mice that received regulatory B cells along with the anti-IL-10 antibody, KO knock-out, Ab antibody, LVEDD left ventricular end-diastolic dimension, LVESD left ventricular end-systolic dimension, CVF collagen volume fraction
Fig. 10
Fig. 10
Anti-IL-10 antibody antagonizes the effect of Bregs on monocytes in vivo. a Experimental procedures and timeline of surgery and treatment are shown. IL-10 KO MI mice were administered with Bregs along with the anti-IL-10 antibody or isotype control antibody. be Numbers of monocytes and their subsets in the heart (b), spleen (c), bone marrow (d), and blood (e) at day 3 after MI were detected using flow cytometry. n = 6–7 per group. f CCR2 expression in monocytes from the spleen, bone marrow and blood were measured 3 day post-MI. n = 6–7 per group. Data are expressed as means ± SEM. *P < 0.05. Data in b were analyzed by one-way ANOVA, followed by Tukey’s post hoc test (Ly6Clo monocytes) or Kruskal–Wallis test with Dunn’s multiple comparisons test (monocytes and Ly6Chi monocytes). Data in c, d and e were analyzed by one-way ANOVA, followed by Tukey’s post hoc test. Data in f were analyzed by one-way ANOVA, followed by Tukey’s post hoc test (BM and blood) or Kruskal–Wallis test with Dunn’s multiple comparisons test (spleen). MI MI mice control group, MI + Breg + Iso MI mice received regulatory B cells along with the isotype control antibody, MI + Breg + Anti-IL-10 MI mice received regulatory B cells along with the anti-IL-10 antibody, KO knock-out, Ab antibody, Mo or mo monocytes, BM bone marrow
Fig. 11
Fig. 11
Bregs ameliorate ventricular remodeling after MI by modulating monocyte migration. Bregs adoptively transferred to MI mice migrated to the bone marrow and spleen, where they acted on monocytes by secreting IL-10 to reduce their CCR2 expression. The decline in CCR2 expression not only led to a decrease of Ly6Chi monocyte recruitment from the blood to the heart, but also impaired Ly6Chi monocyte mobilization from the bone marrow after MI. Thus, ventricular remodeling post-MI was ameliorated due to the reduced monocyte infiltration. AMI acute myocardial infarction

Similar articles

Cited by

References

    1. Bosschaerts T, Guilliams M, Stijlemans B, Morias Y, Engel D, Tacke F, Herin M, De Baetselier P, Beschin A. Tip-DC development during parasitic infection is regulated by IL-10 and requires CCL2/CCR2, IFN-gamma and MyD88 signaling. PLoS Pathog. 2010;6:e1001045. doi: 10.1371/journal.ppat.1001045. - DOI - PMC - PubMed
    1. Braza F, Chesne J, Durand M, Dirou S, Brosseau C, Mahay G, Cheminant MA, Magnan A, Brouard S. A regulatory CD9(+) B-cell subset inhibits HDM-induced allergic airway inflammation. Allergy. 2015;70:1421–1431. doi: 10.1111/all.12697. - DOI - PubMed
    1. Candando KM, Lykken JM, Tedder TF. B10 cell regulation of health and disease. Immunol Rev. 2014;259:259–272. doi: 10.1111/imr.12176. - DOI - PMC - PubMed
    1. DiLillo DJ, Matsushita T, Tedder TF. B10 cells and regulatory B cells balance immune responses during inflammation, autoimmunity, and cancer. Ann NY Acad Sci. 2010;1183:38–57. doi: 10.1111/j.1749-6632.2009.05137.x. - DOI - PubMed
    1. Ding T, Yan F, Cao S, Ren X. Regulatory B cell: new member of immunosuppressive cell club. Hum Immunol. 2015;76:615–621. doi: 10.1016/j.humimm.2015.09.006. - DOI - PubMed

Publication types