. 2021 Sep 17;433(19):167174.
doi: 10.1016/j.jmb.2021.167174. Epub 2021 Jul 21.

A Structural Study of the Cytoplasmic Chaperone Effect of 14-3-3 Proteins on Ataxin-1

Affiliations

A Structural Study of the Cytoplasmic Chaperone Effect of 14-3-3 Proteins on Ataxin-1

Seppe Leysen et al. J Mol Biol. .

Abstract

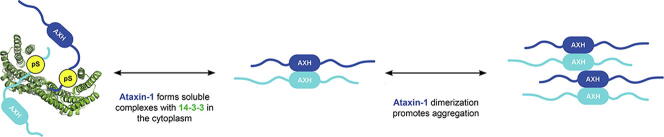
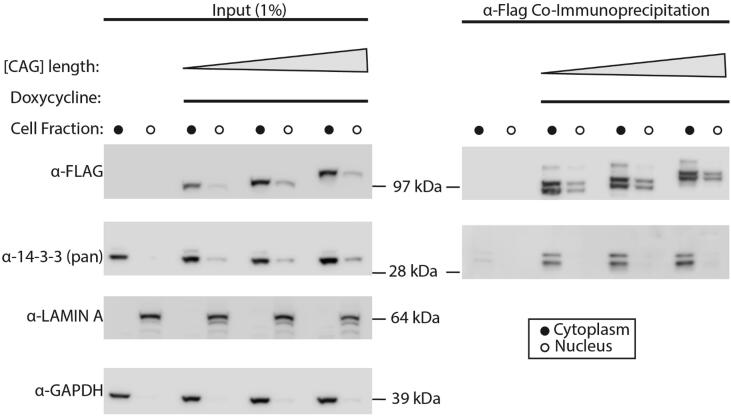
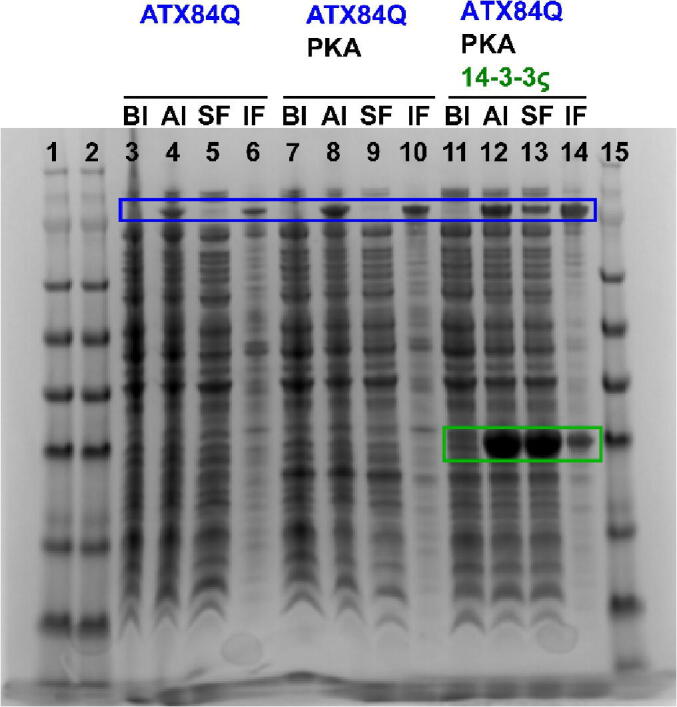
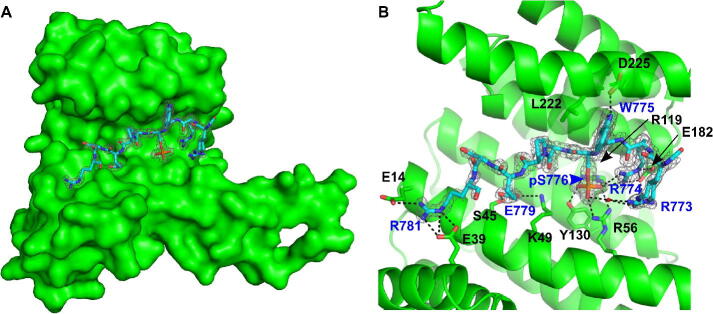
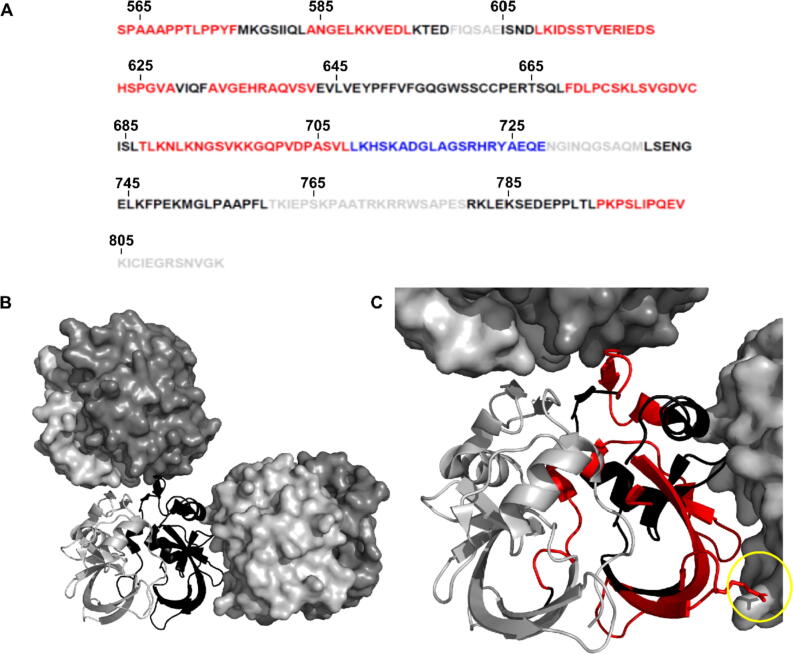
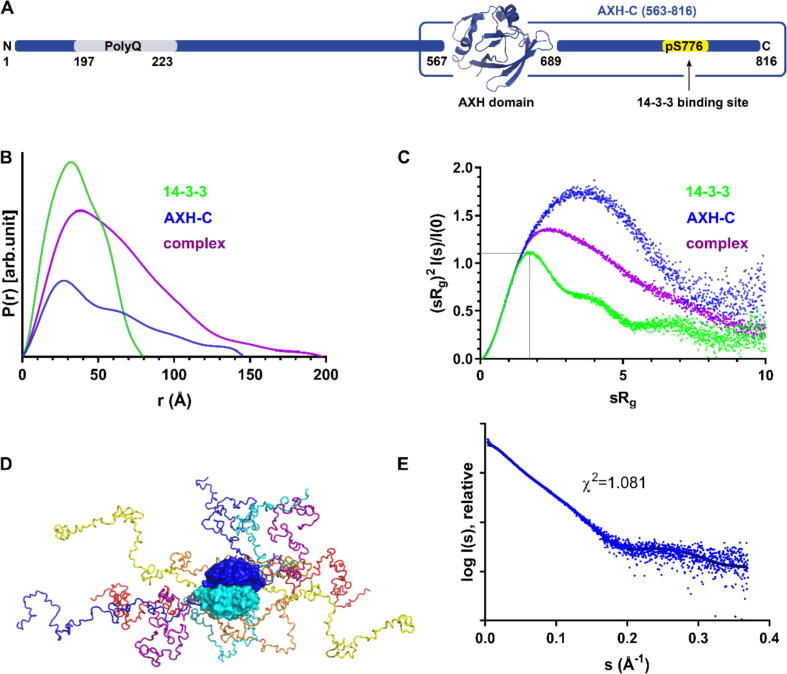
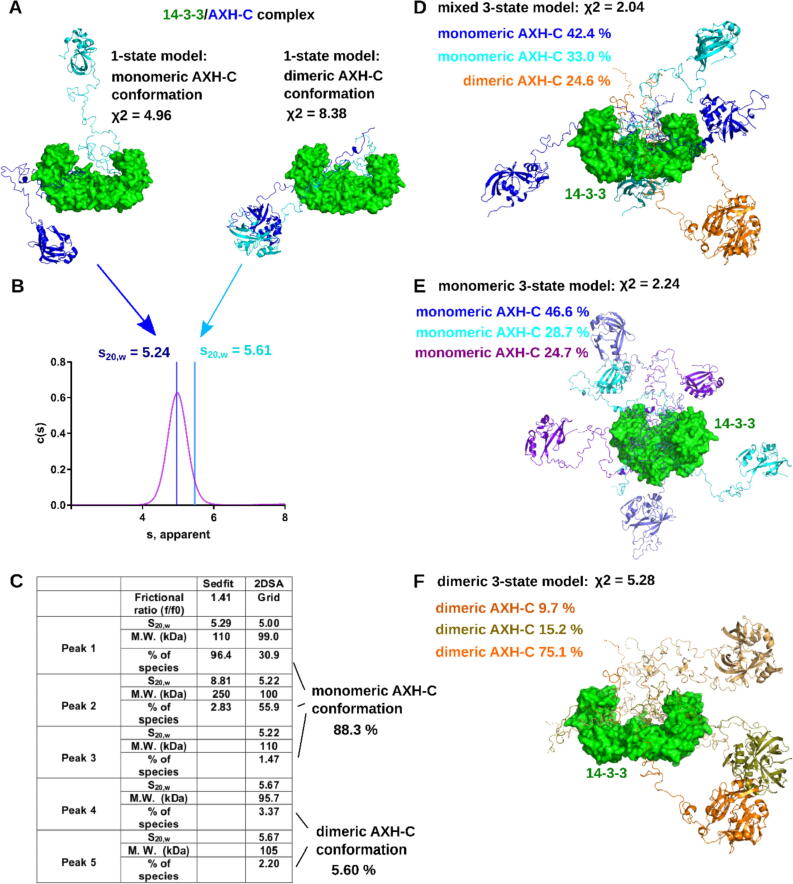
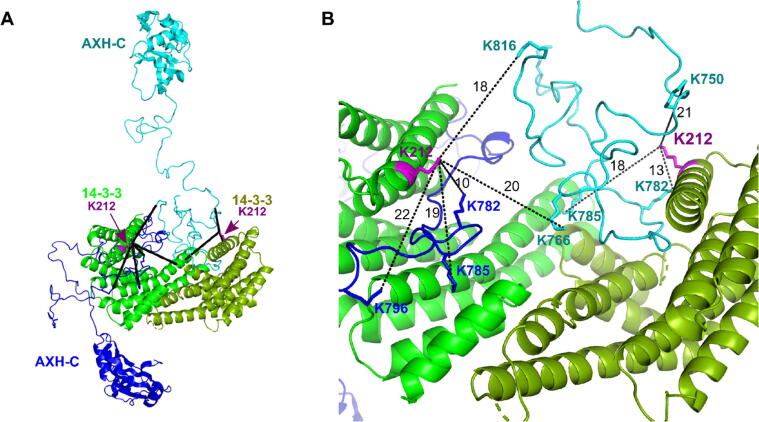
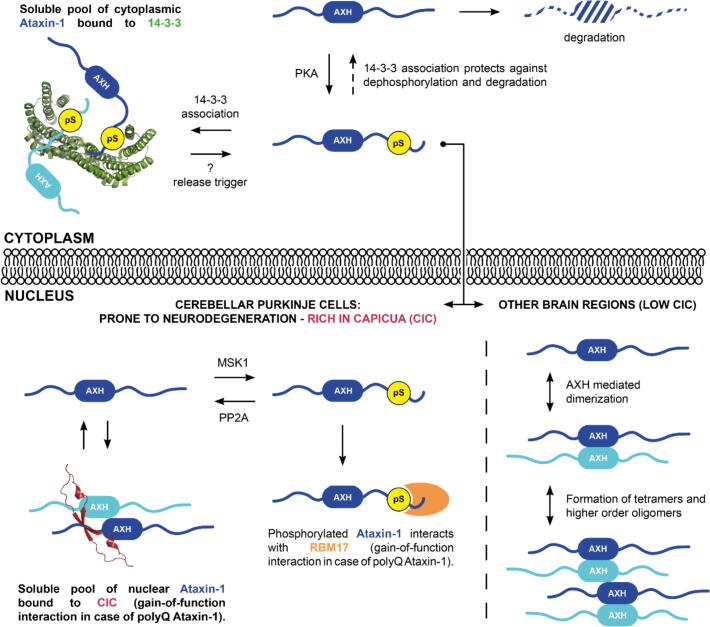
Expansion of the polyglutamine tract in the N terminus of Ataxin-1 is the main cause of the neurodegenerative disease, spinocerebellar ataxia type 1 (SCA1). However, the C-terminal part of the protein - including its AXH domain and a phosphorylation on residue serine 776 - also plays a crucial role in disease development. This phosphorylation event is known to be crucial for the interaction of Ataxin-1 with the 14-3-3 adaptor proteins and has been shown to indirectly contribute to Ataxin-1 stability. Here we show that 14-3-3 also has a direct anti-aggregation or "chaperone" effect on Ataxin-1. Furthermore, we provide structural and biophysical information revealing how phosphorylated S776 in the intrinsically disordered C terminus of Ataxin-1 mediates the cytoplasmic interaction with 14-3-3 proteins. Based on these findings, we propose that 14-3-3 exerts the observed chaperone effect by interfering with Ataxin-1 dimerization through its AXH domain, reducing further self-association. The chaperone effect is particularly important in the context of SCA1, as it was previously shown that a soluble form of mutant Ataxin-1 is the major driver of pathology.

Keywords: HDX-MS; SAXS; crystal structure; neurodegeneration; protein aggregation.


Conflict of interest statement

Conflict of interest The authors declare that they have no conflicts of interest with the contents of this article.

Figures

None
Graphical abstract
Figure 1
Figure 1
Ataxin-1 interacts with 14-3-3 in the cytoplasm. α-FLAG co-immunoprecipitation was performed on nuclear and cytoplasmic fractions of doxycycline inducible cell lines stably expressing FLAG-Ataxin-1 [2Q], FLAG-Ataxin-1 [30Q] and FLAG-Ataxin-1 [82Q] LAMIN A and GAPDH were used as nuclear and cytoplasmic markers, respectively.
Figure 2
Figure 2
SDS-PAGE Solubility analysis of full-length 84Q Ataxin-1 in the E. coli cytoplasm upon co-expression of protein kinase A and 14-3-3. BI, before IPTG induction. AI, after induction. SF, soluble fraction. IF, insoluble fraction. The blue box highlights Ataxin-1 bands, and the green box highlights 14-3-3ζ bands. PKA bands are not visible, due to the weak promotor driving its expression, as opposed to the strong T7 promoter driving expression of Ataxin-1 and 14-3-3.
Figure 3
Figure 3
Binding mechanism of the Ataxin-1 pS776 to the 14-3-3 sigma protein. A. Crystal structure of the Ataxin-1 phosphopeptide including pS776 (cyan), bound to the 14-3-3σ isoform (green). The 14-3-3σ protein exists as a dimeric protein, but only the monomer was observed in the crystal asymmetric unit. The grey mesh shows the electron density for the Ataxin-1 peptide at 1.2σ. B. Interactions between the Ataxin-1 peptide and the 14-3-3σ protein. Dashed lines indicate hydrogen bonds and ionic interactions. Labels for the 14-3-3σ protein and Ataxin-1 residues are shown in black and blue respectively.
Figure 4
Figure 4
Mapping of HD exchange in the presence of 14-3-3ζ, on the sequence of the Ataxin-1 AXH-C construct and the structure of its AXH domain. (A) Amino acid sequence of the AXH-C construct (Ataxin-1 residues 563–816). Red = increased HD exchange in the 14-3-3ζ/AXH-C complex vs AXH-C. Blue = decreased HD exchange in complex vs AHX-C. Black = no change in HD exchange. Grey = no data available. (B) Crystal structure of the AXH domain (Ataxin-1 residues 567–689, PDB ID 4APT), in the absence of 14-3-3ζ. An AXH dimer is shown in cartoon representation with one monomer shown in grey and the other in black. Two other dimers related by crystallographic symmetry are also shown in surface representations. (C) This panel zooms in on panel B, with amino acids with increased HDX exchange (p < 0.001) in the presence of 14-3-3ζ, shown in red on one the AXH molecules (i.e. the one in black cartoon representation). These regions are clearly present in the AXH dimer interface, as well as the interfaces with the two dimers related by crystallographic symmetry, suggesting these regions become more solvent exposed upon the interaction of AXH-C with 14-3-3ζ. The yellow circle highlights residue R638 on the AXH domain, which has been suggested to play a role in Ataxin-1 self-association and fibril formation.
Figure 5
Figure 5
Analysis of SAXS data for AXH-C, 14-3-3 and their complex. (A) schematic structure of the Ataxin-1 protein. The full-length Ataxin-1 protein has 816 amino acids, with a central AXH domain. In this study, a shorter version of the protein including the AXH domain and C terminus was used. It is referred to as AXH-C. The 14-3-3 binding site created upon phosphorylation of S776 (pS776) is marked. (B) Distance distribution functions for 14-3-3, AXH-C and their complex are shown in green, blue and purple respectively. (C) Dimensionless Kratky plots, with same colour coding as in panel B. The grey lines mark the characteristic maximum for globular proteins of 1.107 at sRg = √3. (D) Ensemble model of AXH-C generated by EOM. The AXH dimer is coloured in shades of blue. Various conformations of the disordered C-termini on each monomer are shown as wire model. (E) Crysol fit of the AXH-C ensemble model (black line) to the experimental AXH-C scattering data (blue dots).
Figure 6
Figure 6
Modelling of the 14-3-3ζ/AXH-C complex. (A) On the left, a 1-state model with two AXH-C molecules (cartoon representation, shades of blue) in a monomeric state, bound to a 14-3-3 dimer (green, surface representation). On the right, a 1-state model with two AXH-C molecules in a dimeric state, bound to a 14-3-3 dimer. The models were generated using CORAL. The χ2 values are scores reported by FoXS, for the quality of fit of the models to the experimental SAXS data for the complex. (B) Analytical ultracentrifugation results for the 14-3-3/AXH-C complex. The purple curve shows the c(s) distribution analysis of the 14-3-3ζ/AXH-C complex at 0.5 mg/mL. Sedimentation (s) on x axis represent s apparent only. The blue and cyan lines respectively represent where the 14-3-3ζ/AXH-C complexes, containing either monomeric or dimeric AXH-C molecules bound to the 14-3-3 dimer, would theoretically sediment. (C) Table containing experimentally determined S values (Sedfit method) and Frictional ratios (2DSA analysis) which is the measure of the shape and size of the macromolecule. The 2DSA analyses reveals multiple species sedimenting between 5.0 S and 5.67 S, inferring the 14-3-3ζ/AXH-C complex adopts multiple conformations, predominantly one with a dissociated AXH-C dimer. (D) Mixed 3-state model for the 14-3-3ζ/AXH-C complex, containing monomeric and dimeric AXH-C. (E) 3-state model for the 14-3-3ζ/AXH-C complex containing only monomeric AXH-C conformations. (F) 3-state model for the 14-3-3ζ/AXH-C complex containing only monomeric AXH-C conformations. χ2 values in panels (D, E and F) report on the quality of fit of the respective models to the experimental SAXS data for the complex, as determined by MultiFoXS. For all models shown in this figure, the fits to the 14-3-3ζ/AXH-C SAXS data is shown in SI Figure 5.
Figure 7
Figure 7
Cross-linking MS results for the 14-3-3ζ/AXH-C complex. (A) For simplicity, the complex is shown as a single state model with AXH-C molecules (shades of blue) in monomeric conformation, bound to a 14-3-3 dimer (shades of green). Lysine 112 on 14-3-3 partakes in all observed cross-links (black lines) with AXH-C. Panel. (B) Zooming on panel A, the dashed lines show crosslinks of 14-3-3 residue K212 with lysine residues 750, 766, 782, 785, 796 and 816 on AXH-C. The black numbers are the distances (Nε-Nε) measured in Å.
Figure 8
Figure 8
Overview of cytoplasmic and nuclear protein interactions contributing to Ataxin-1 solubility and pathology. SCA1 pathology is associated with the formation insoluble deposits in the nucleus. However, they also occur in brain regions which do not degenerate. The current opinion in the field is that these nuclear inclusions have a protective role, while a soluble form of Ataxin-1 is the major driver of pathology. In the cytoplasm, phosphorylated Ataxin-1 (blue, with an ordered AXH domain flanked by disordered N- and C-termini) interacts with 14-3-3 (green). This interaction protects Ataxin-1 against proteasomal degradation and aggregation. Upon release from 14-3-3, Ataxin-1 can translocate to the nucleus and – when polyQ expanded – exert its neurodegenerative effect by altering nuclear protein interactions. Capicua (purple) has been shown to stabilise Ataxin-1 by forming soluble oligomeric complexes. The higher abundance of CIC in the cerebellum potentially explains why this region is more vulnerable to neurodegeneration than other regions in the brain. Another nuclear interaction that has been shown to contribute to SCA1 pathology is that between polyQ expanded, phosphorylated Ataxin-1 and RBM17 (orange).

References

    1. Opal P., Ashizawa T. In: GeneReviews((R)) Adam M.P., Ardinger H.H., Pagon R.A., Wallace S.E., Bean L.J.H., Stephens K., editors. University of Washington; Seattle (WA): 1993. Spinocerebellar Ataxia Type 1. - PubMed
    1. Wagner J.L., O'Connor D.M., Donsante A., Boulis N.M. Gene, Stem Cell, and Alternative Therapies for SCA 1. Front. Mol. Neurosci. 2016;9:67. - PMC - PubMed
    1. Cummings C.J., Orr H.T., Zoghbi H.Y. Progress in pathogenesis studies of spinocerebellar ataxia type 1. Philos. Trans. R. Soc. Lond. B Biol. Sci. 1999;354:1079–1081. - PMC - PubMed
    1. Zoghbi H.Y., Orr H.T. Pathogenic mechanisms of a polyglutamine-mediated neurodegenerative disease, spinocerebellar ataxia type 1. J. Biol. Chem. 2009;284:7425–7429. - PMC - PubMed
    1. de Chiara C., Pastore A. Kaleidoscopic protein-protein interactions in the life and death of ataxin-1: new strategies against protein aggregation. Trends Neurosci. 2014;37:211–218. - PMC - PubMed

Publication types