. 2021 Nov:193:114698.
doi: 10.1016/j.bcp.2021.114698. Epub 2021 Jul 23.

Pregnane X receptor exacerbates nonalcoholic fatty liver disease accompanied by obesity- and inflammation-prone gut microbiome signature

Affiliations

Pregnane X receptor exacerbates nonalcoholic fatty liver disease accompanied by obesity- and inflammation-prone gut microbiome signature

Sarah Kim et al. Biochem Pharmacol. 2021 Nov.

Abstract

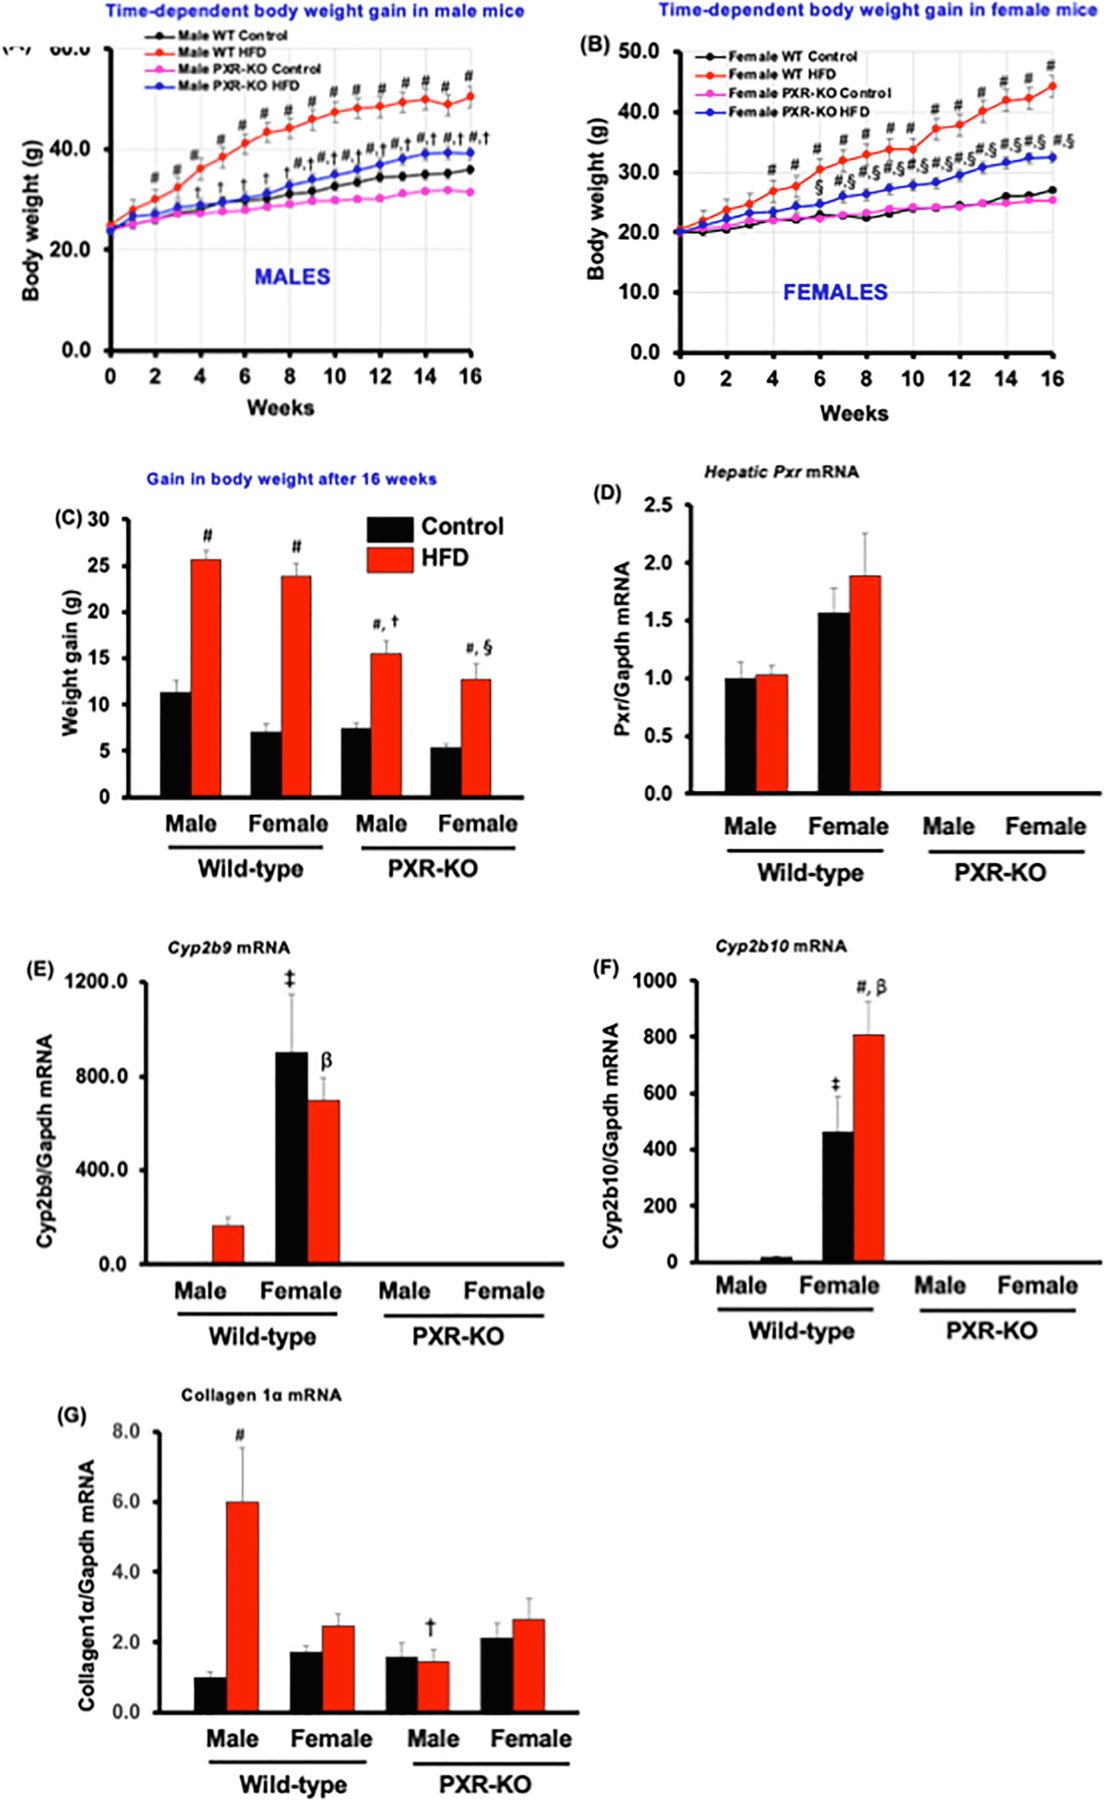
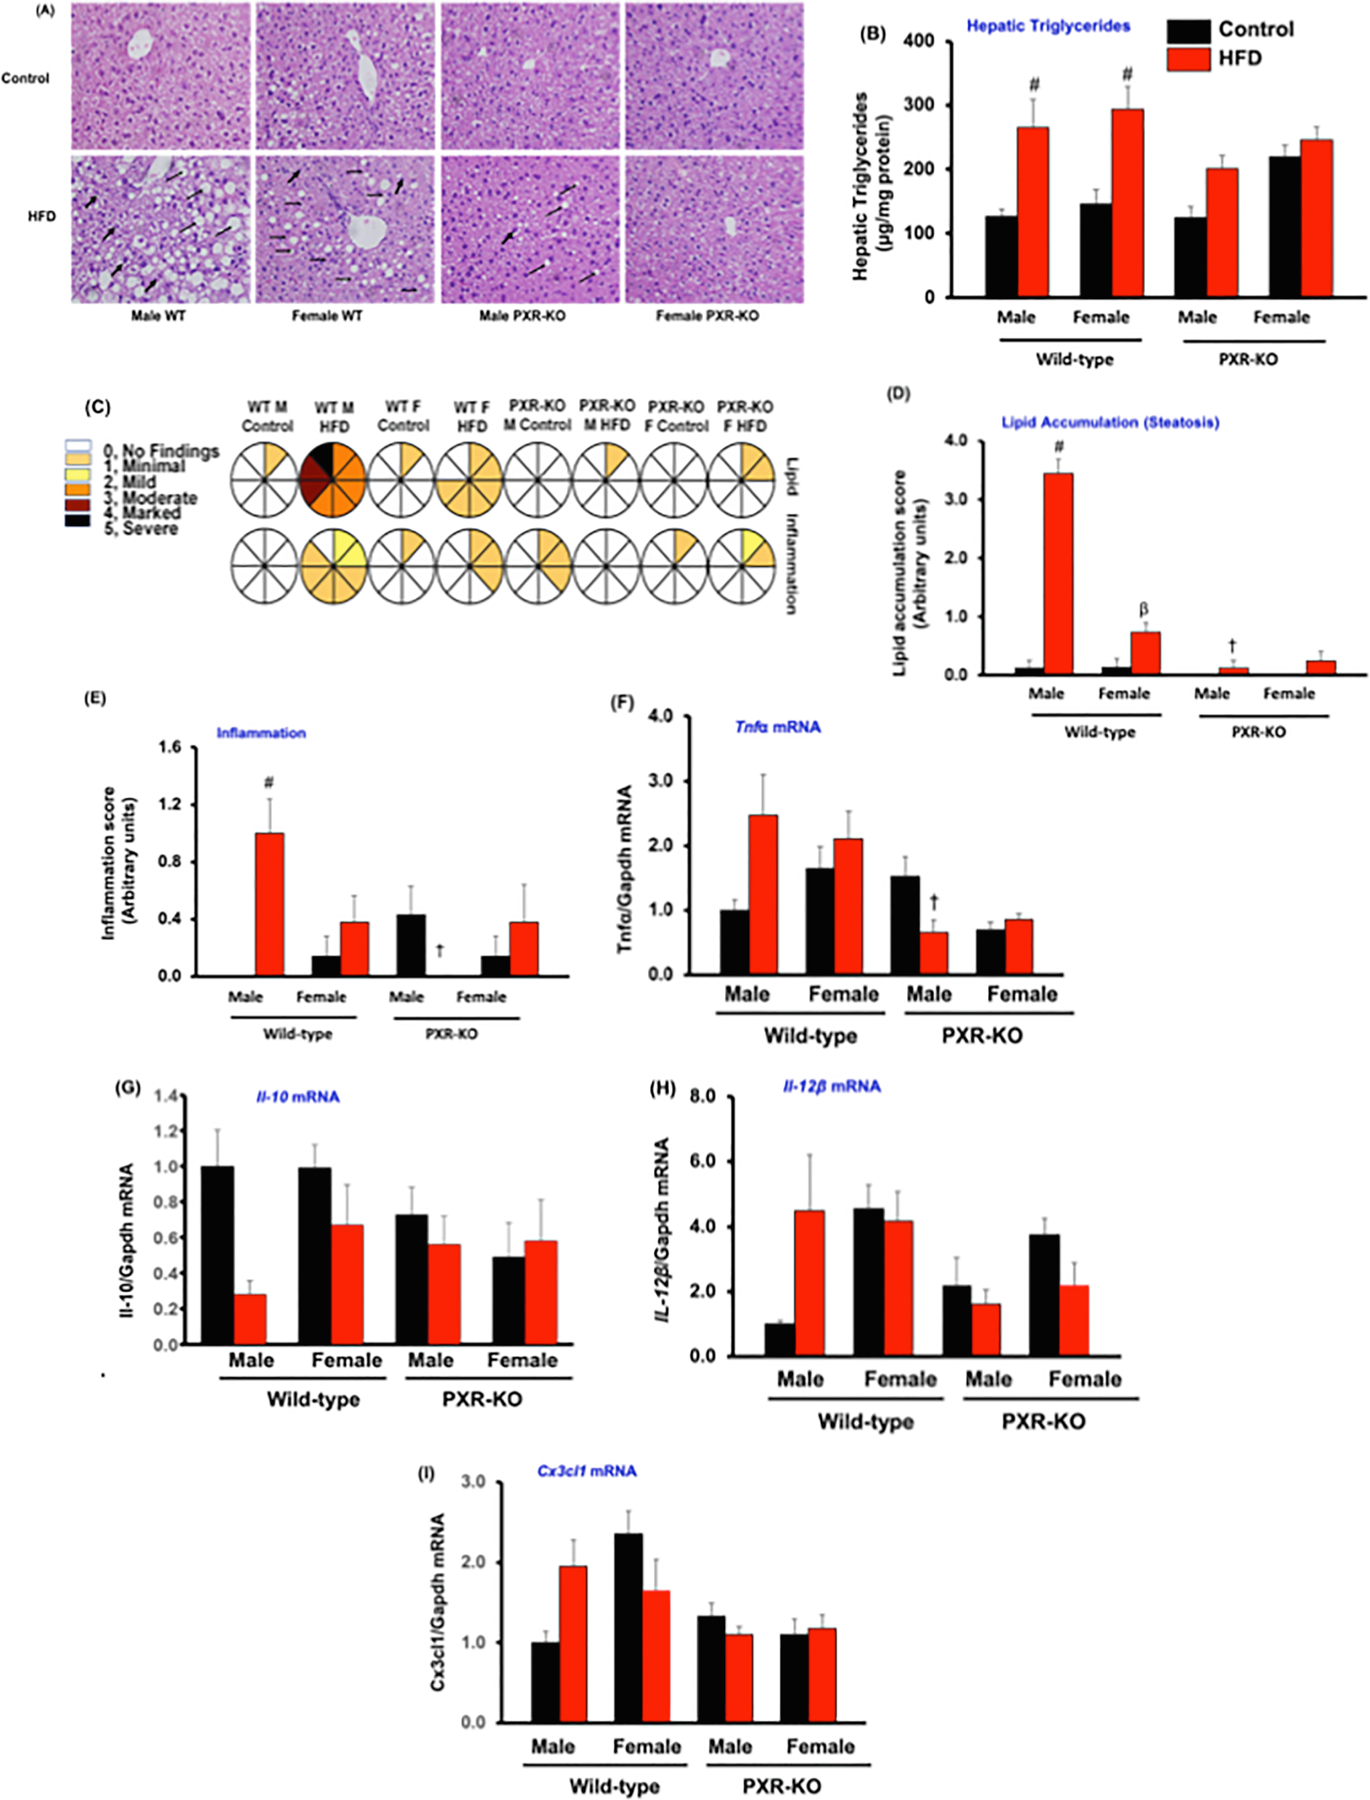
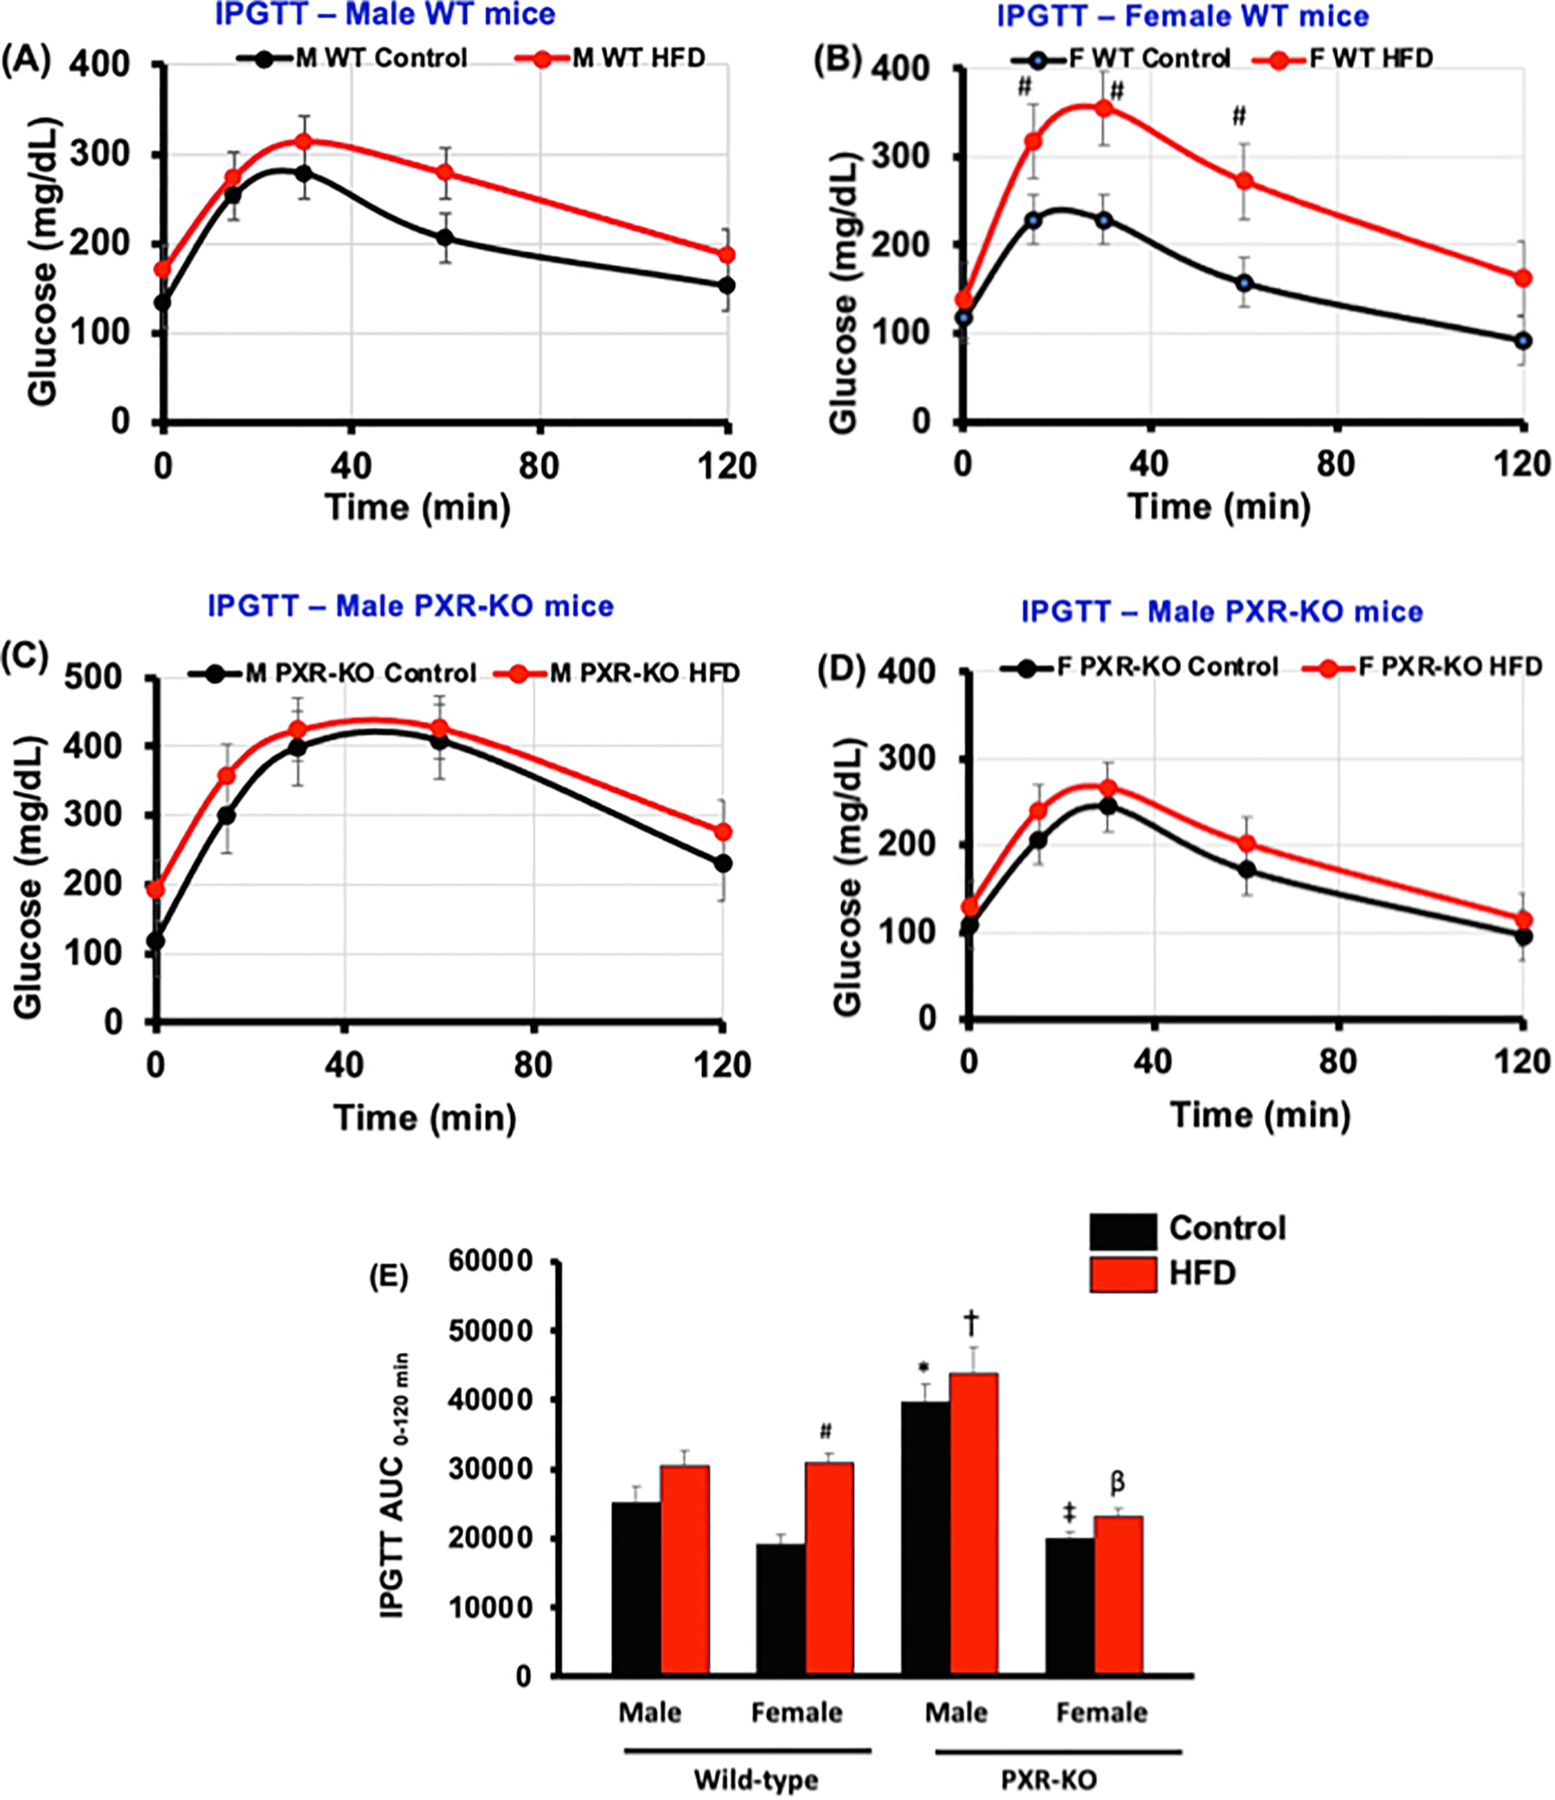
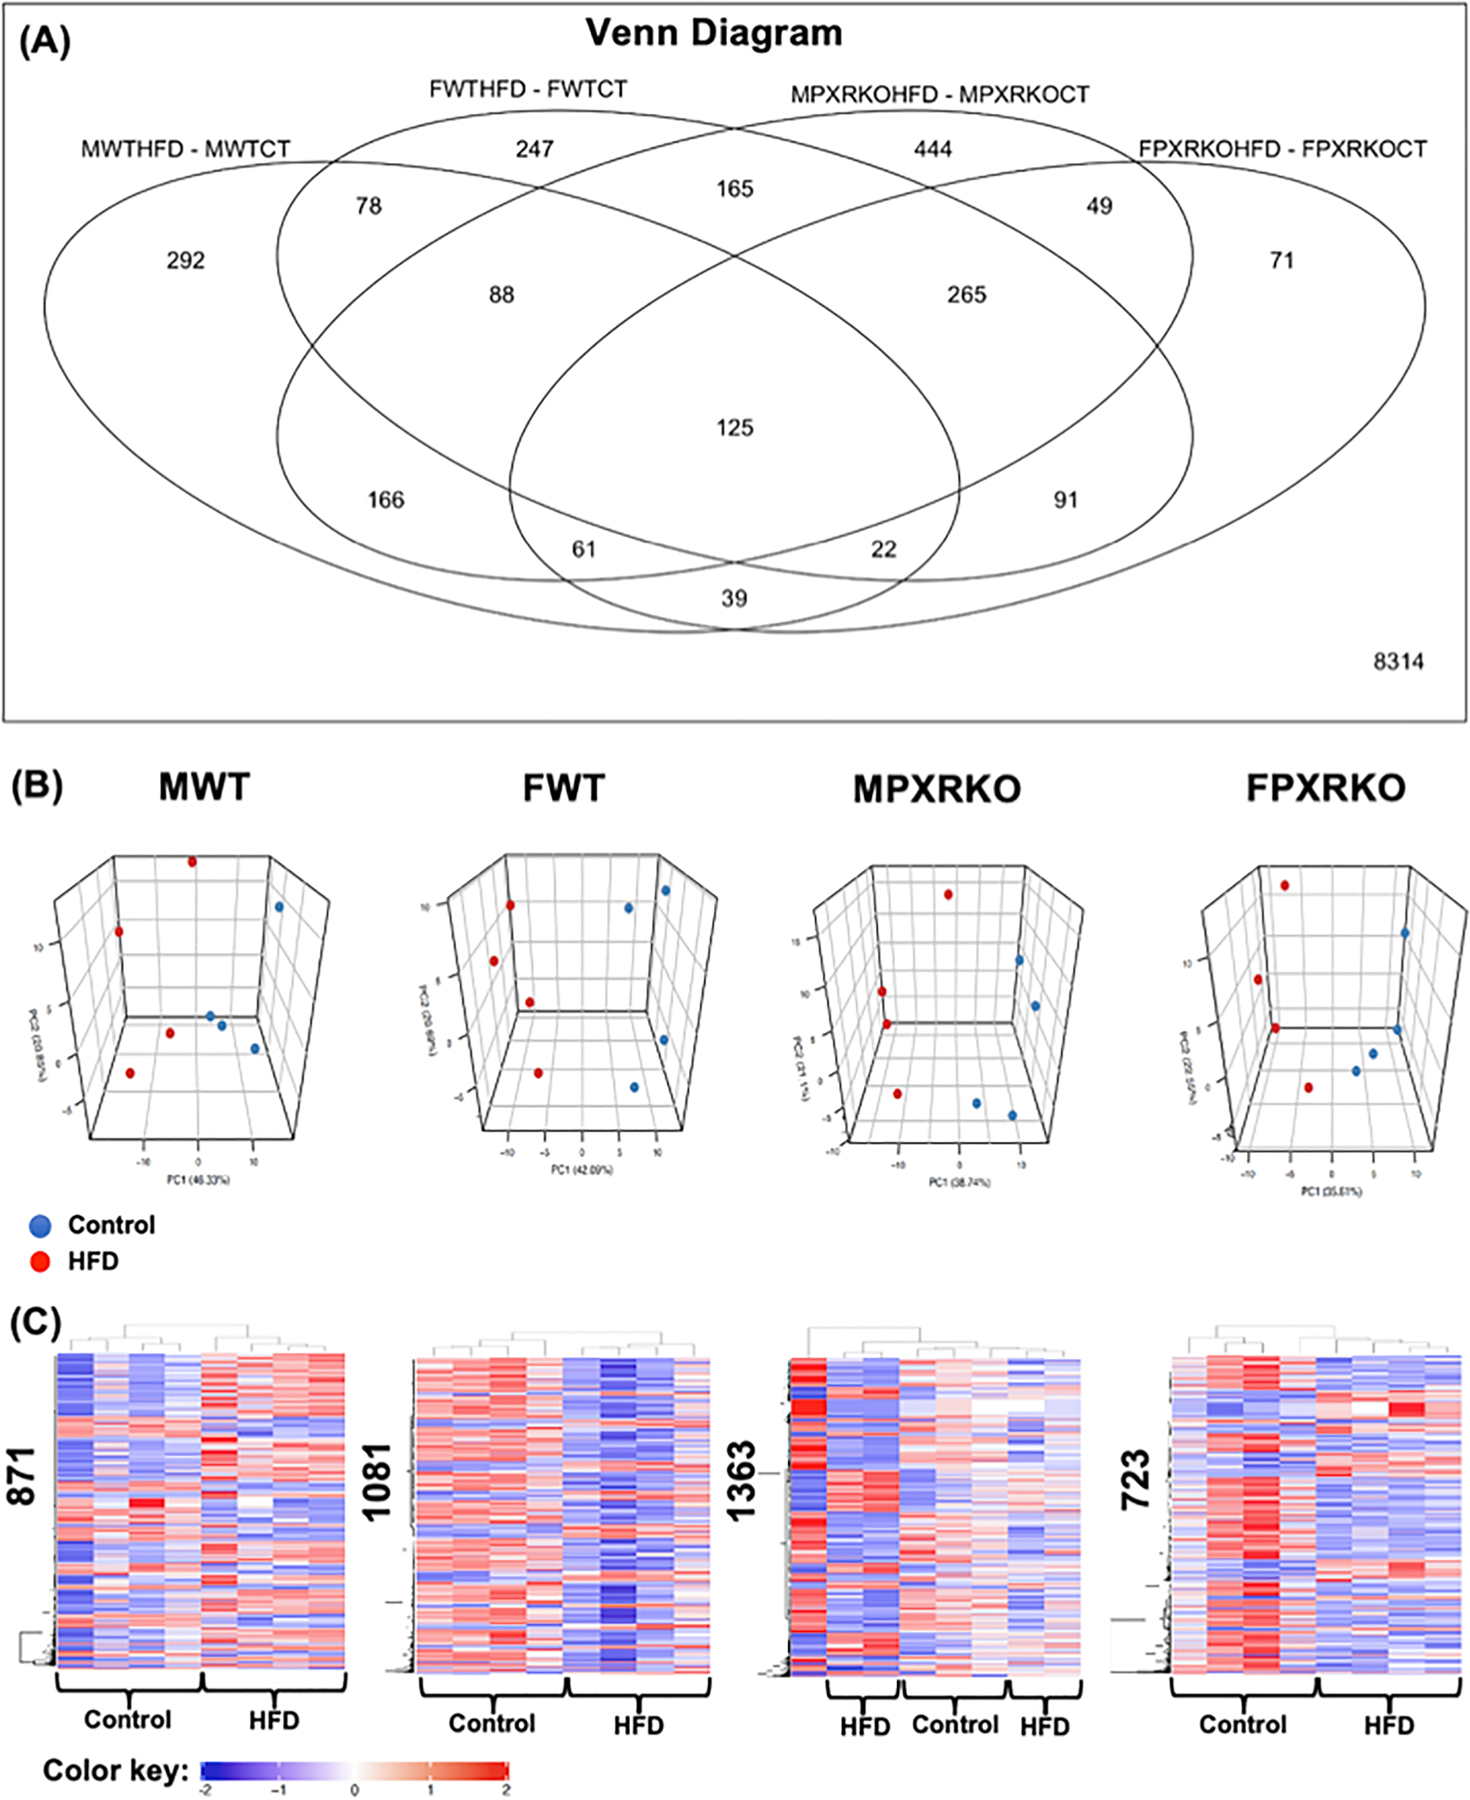
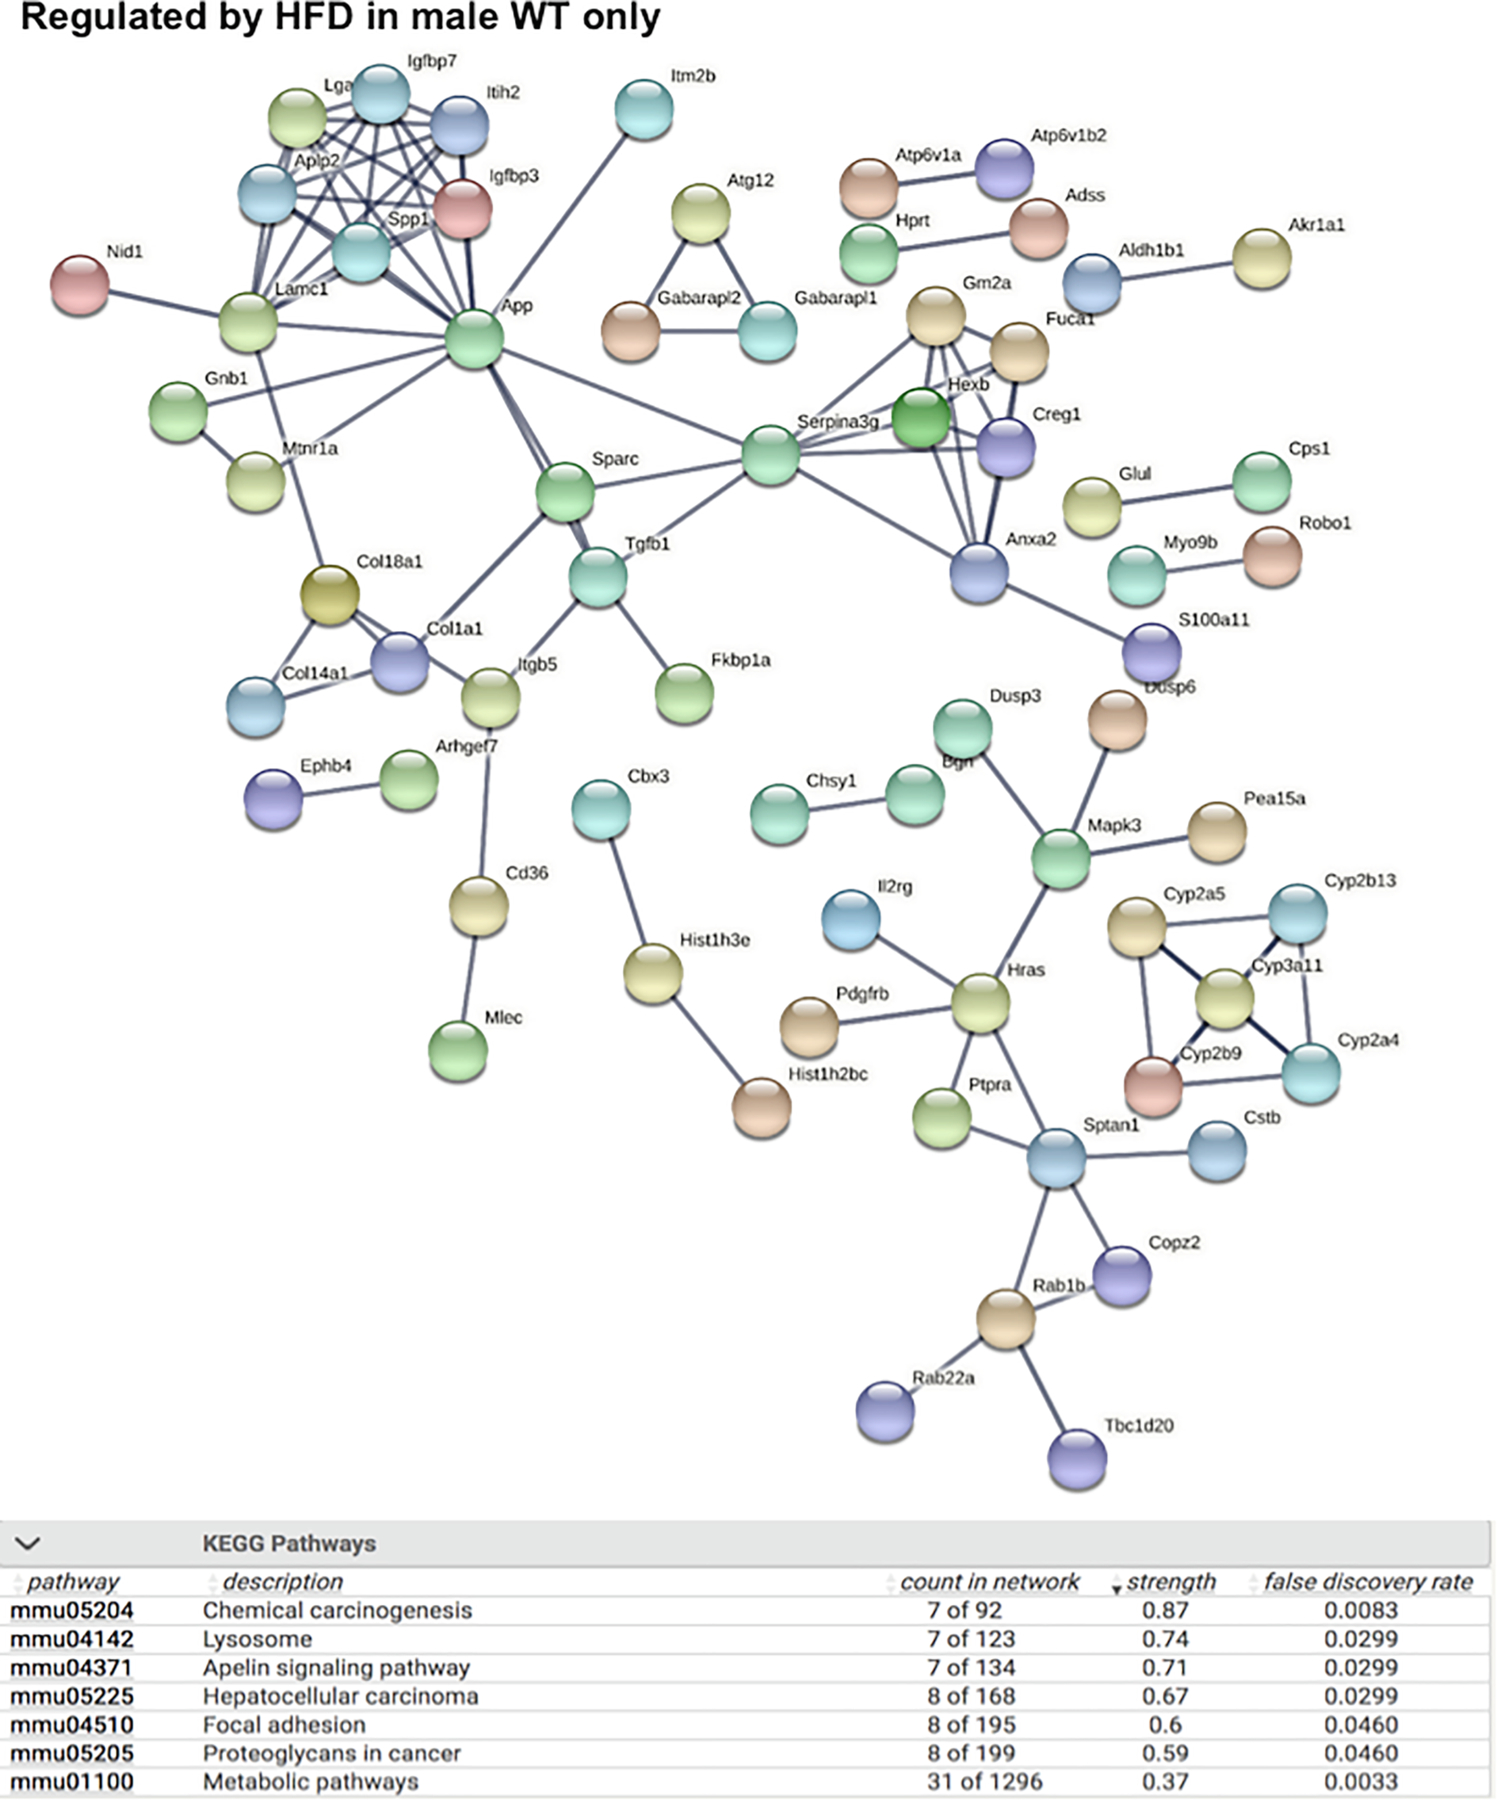
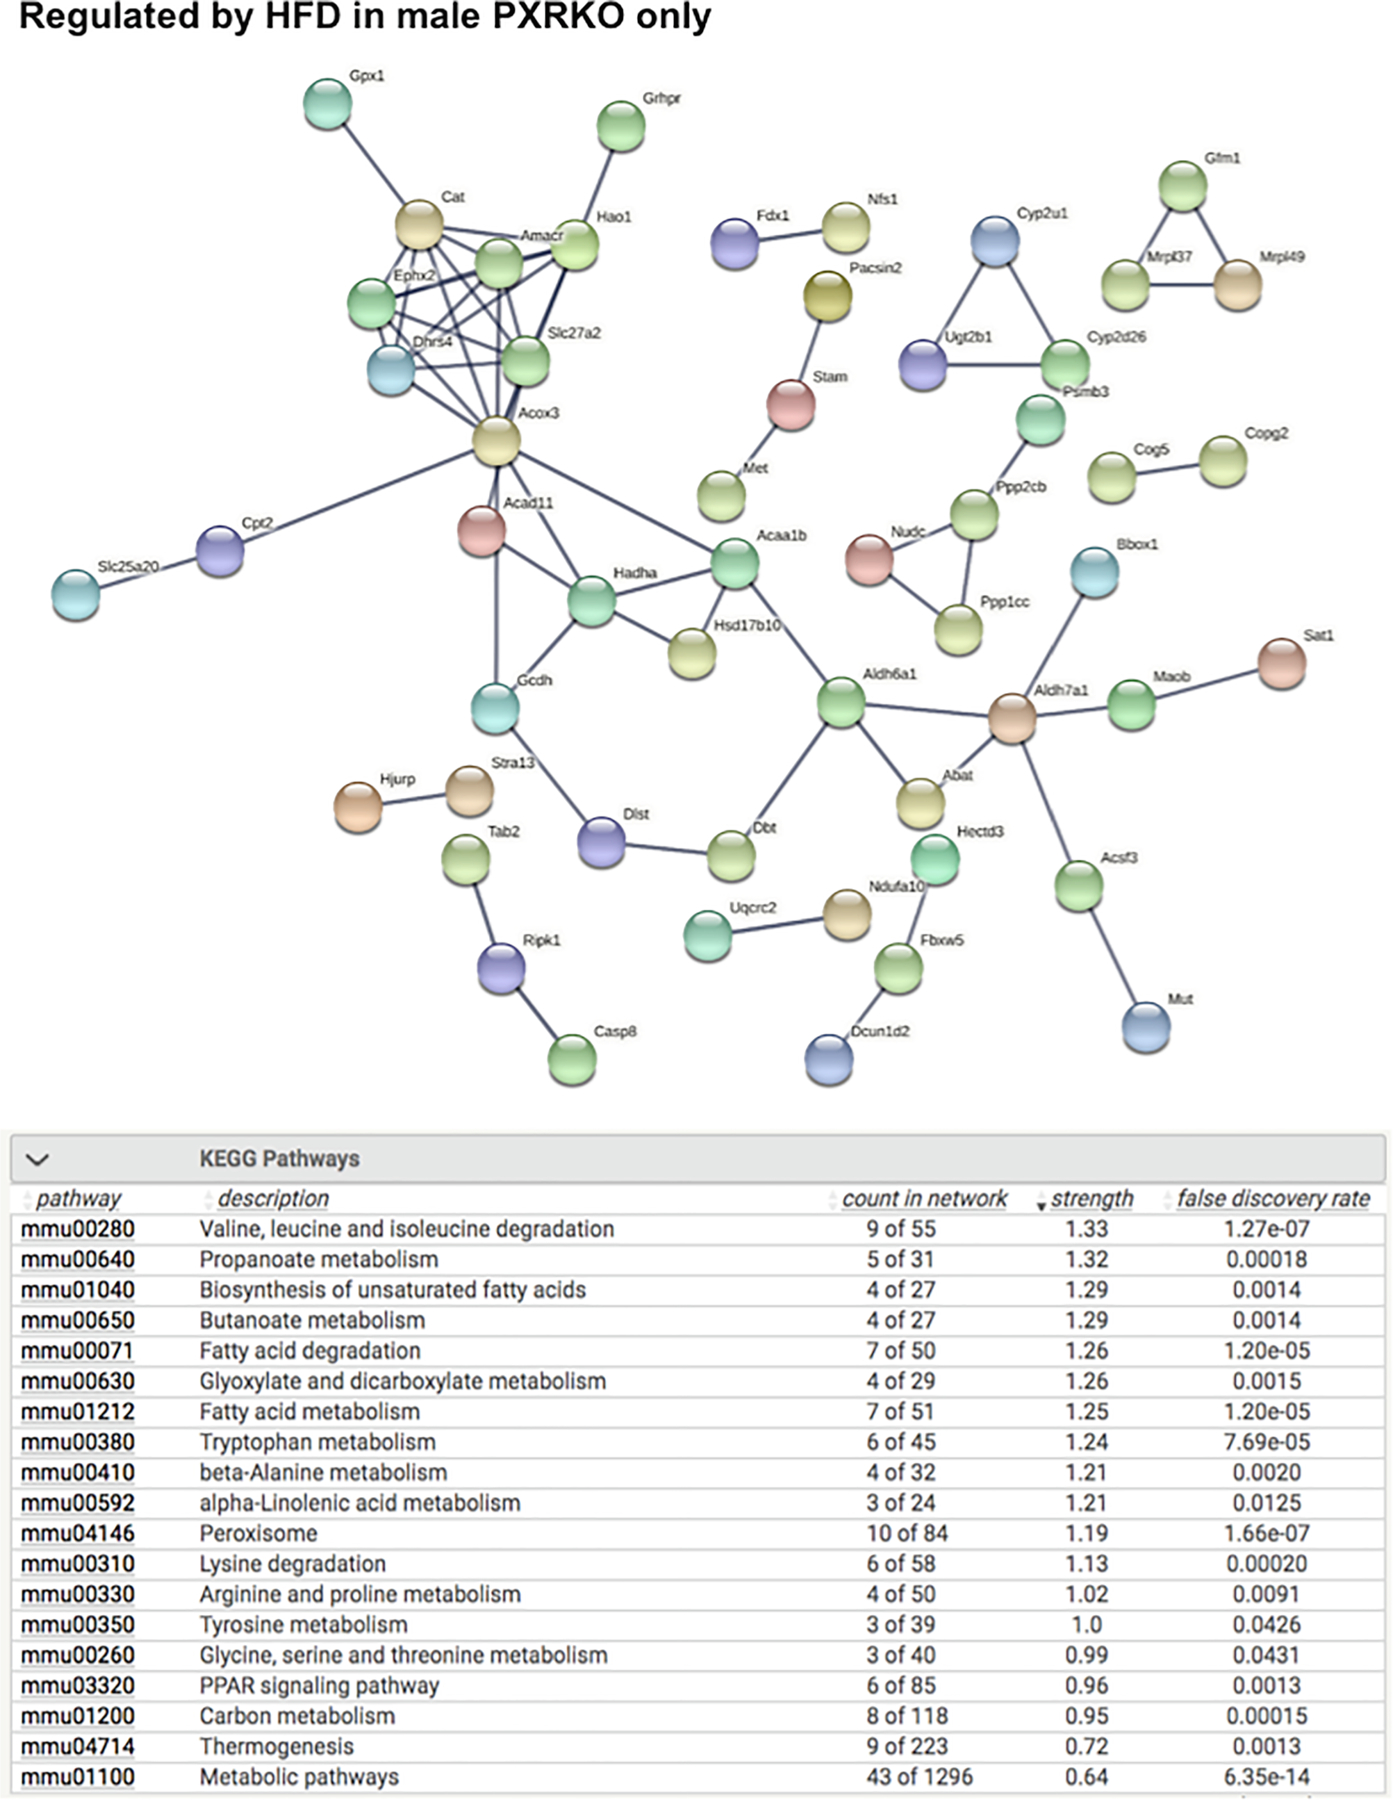
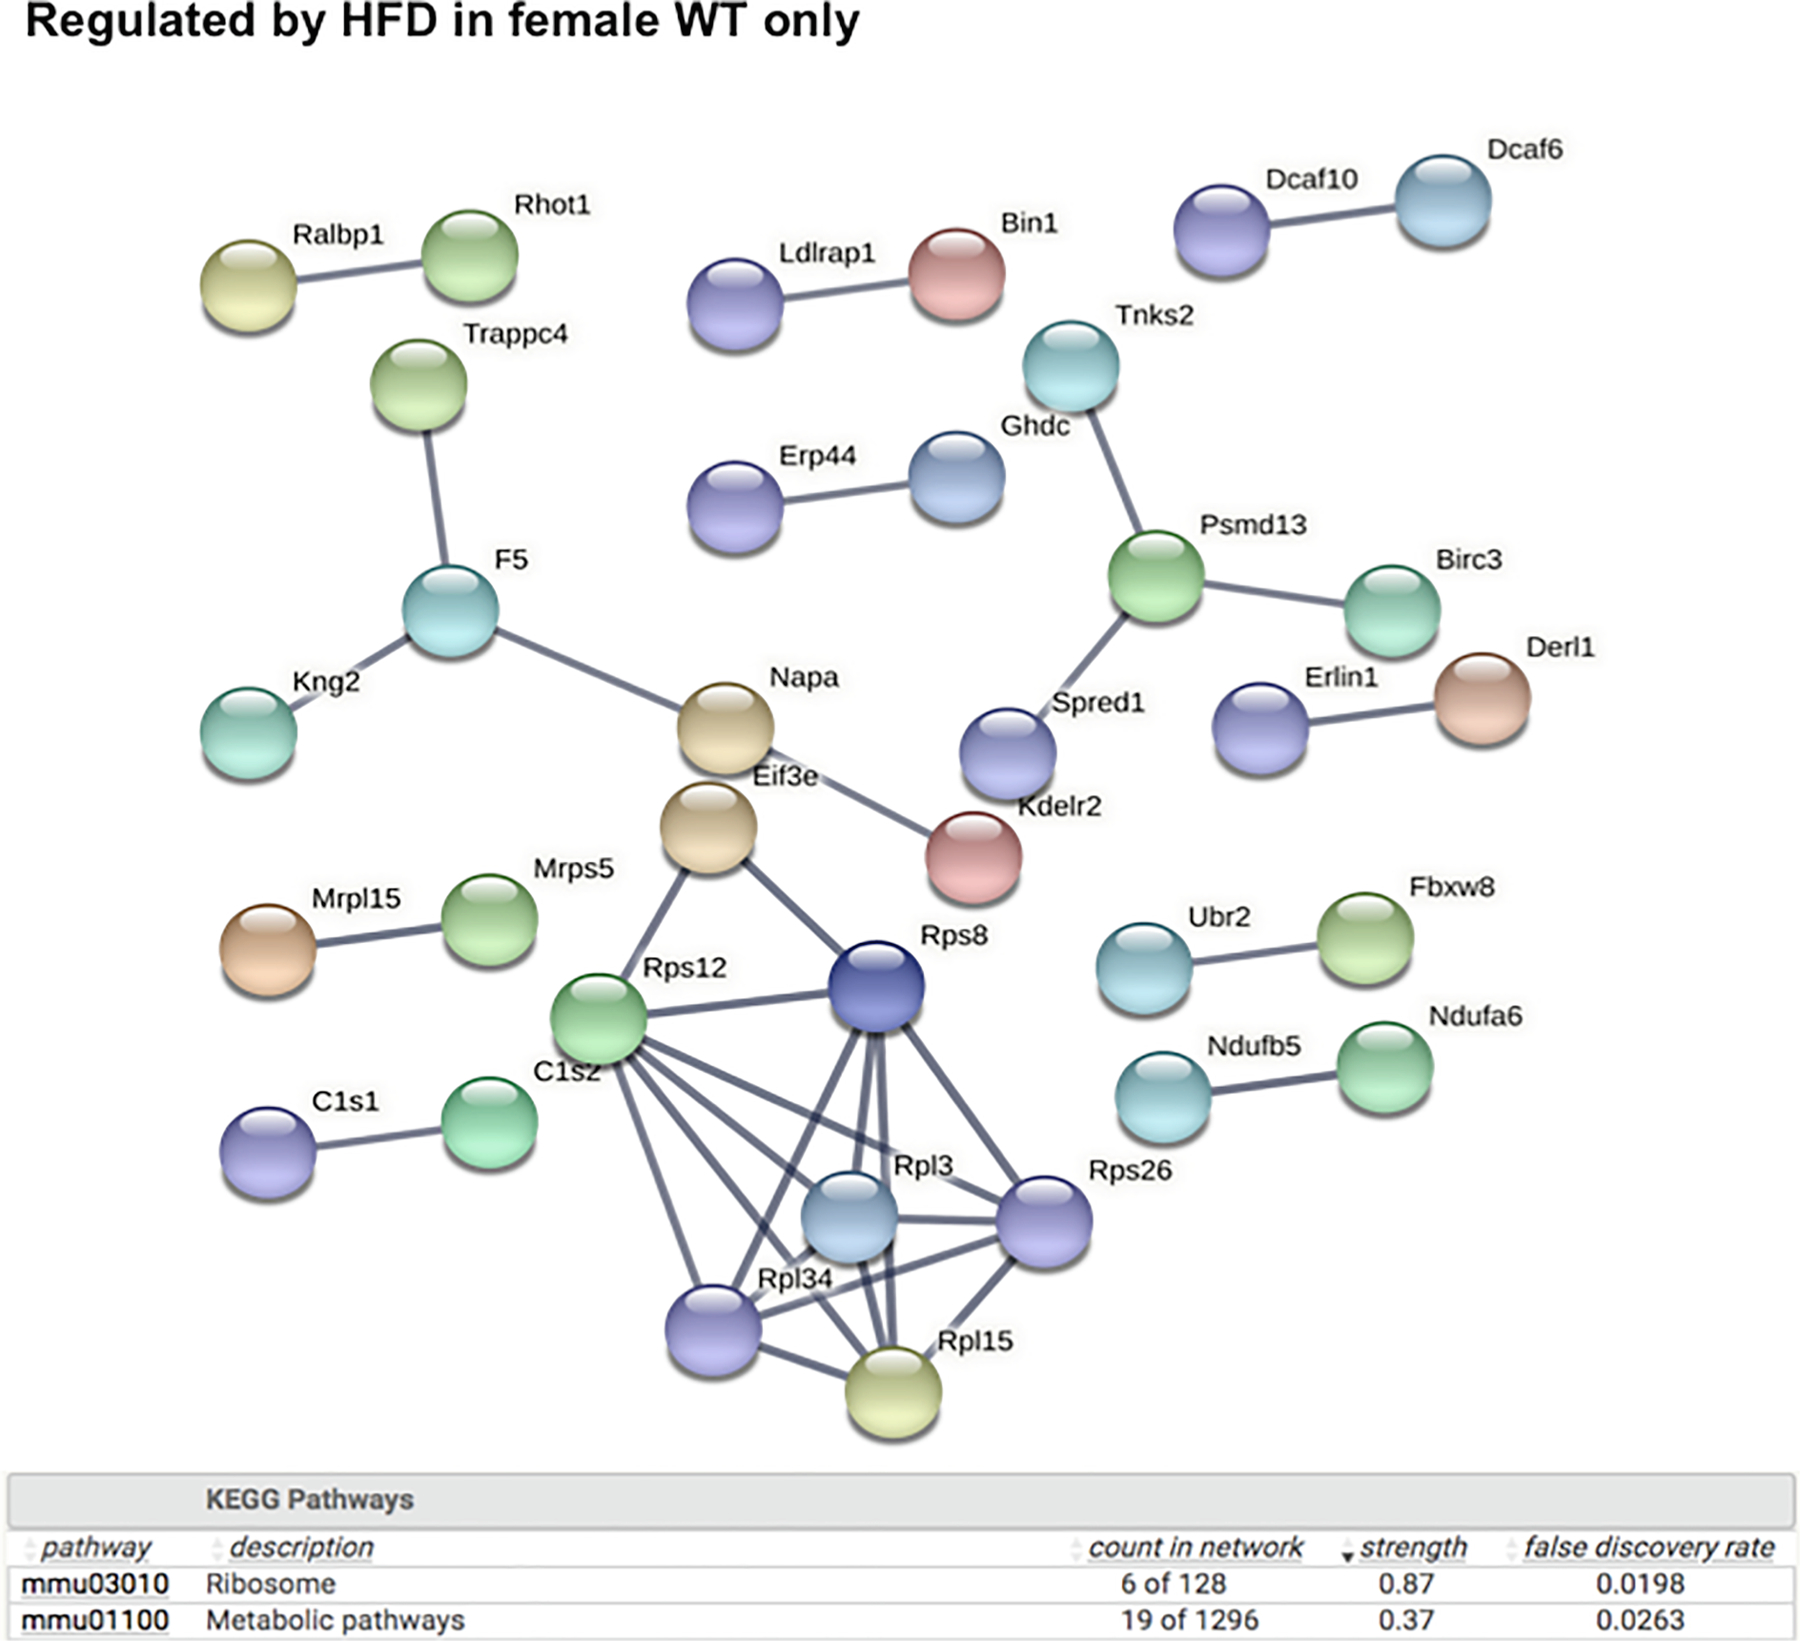
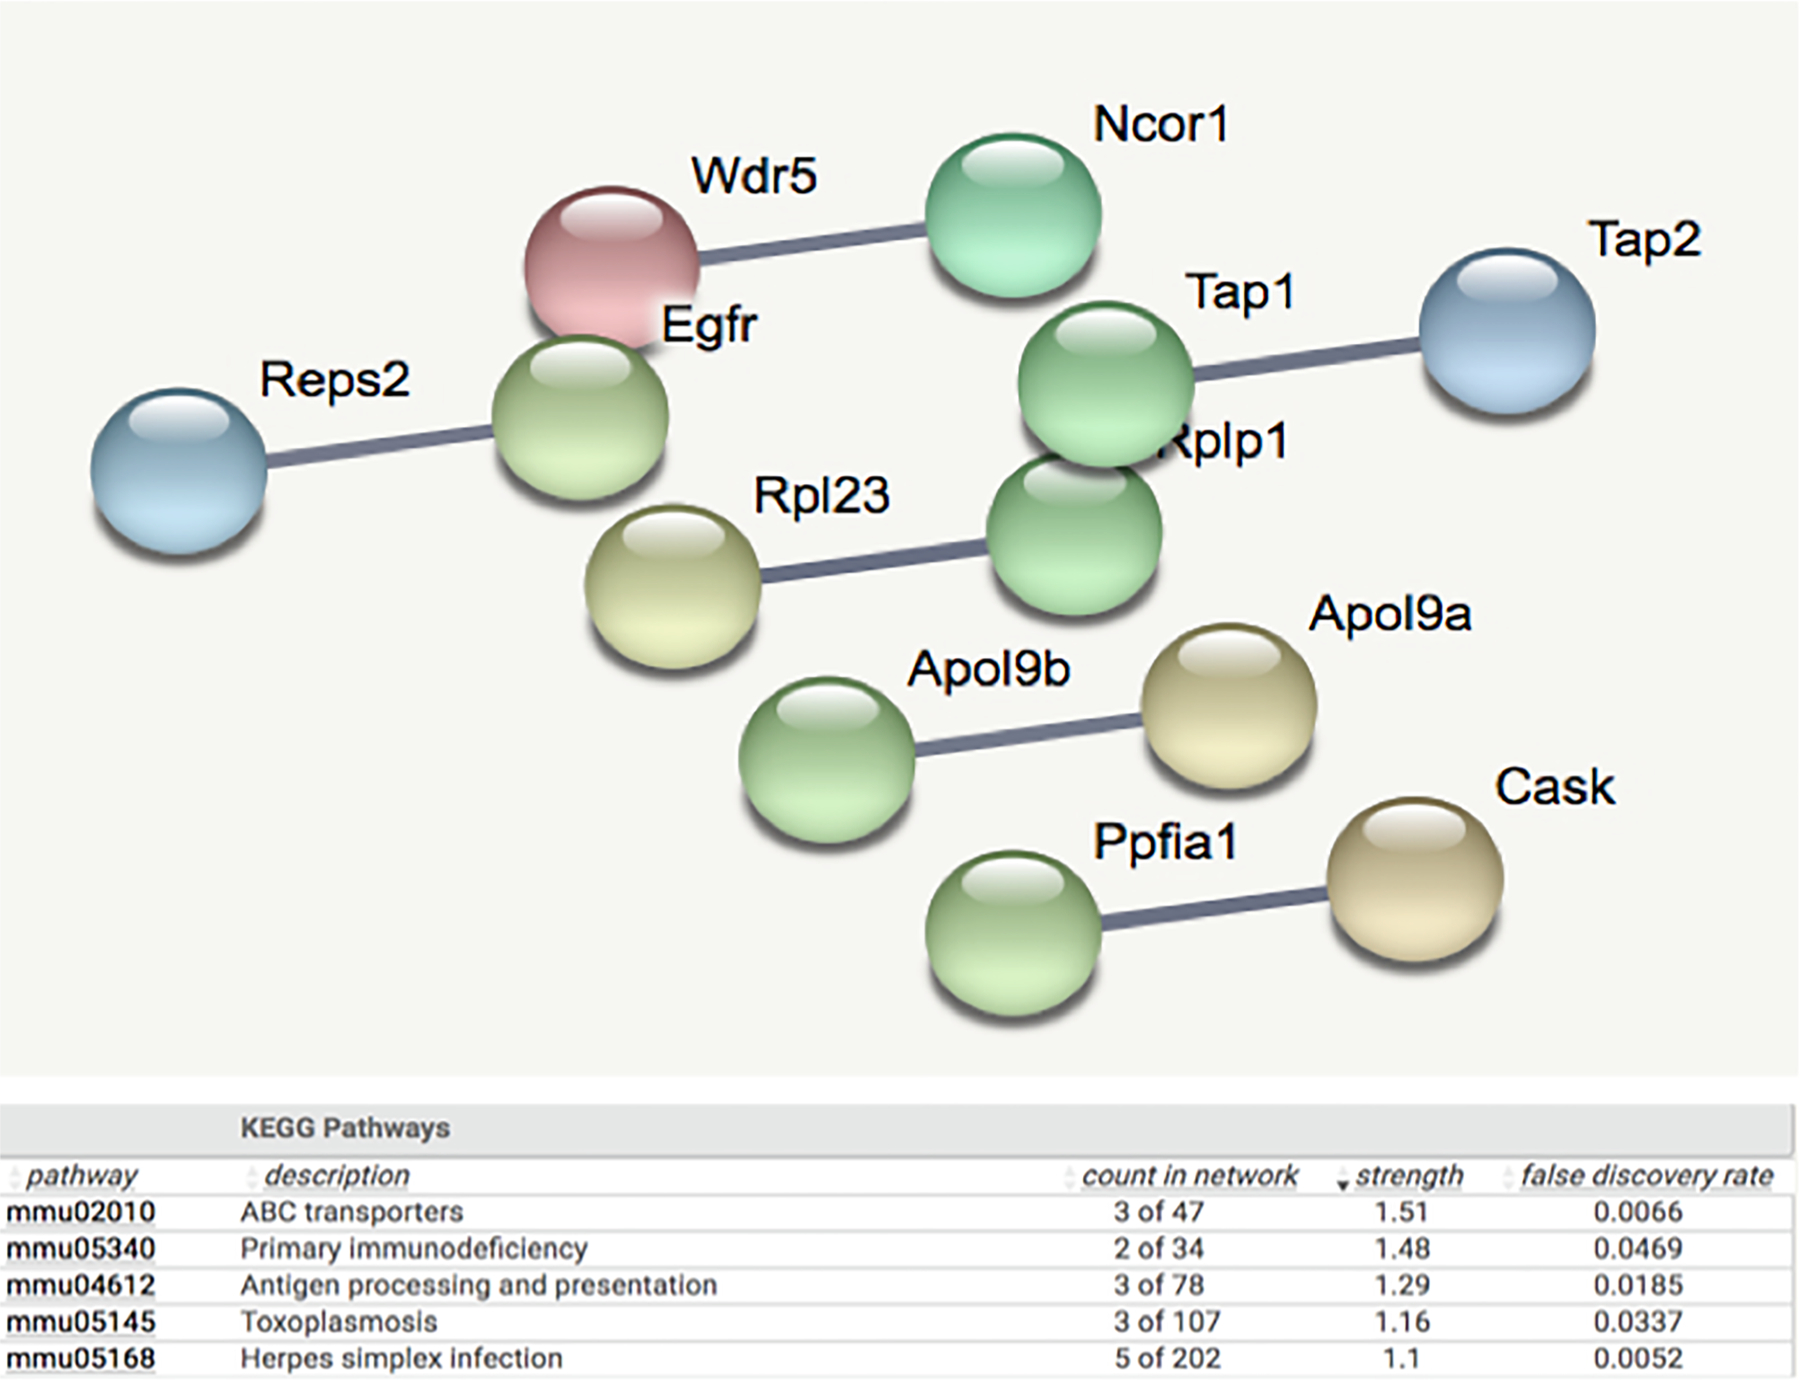
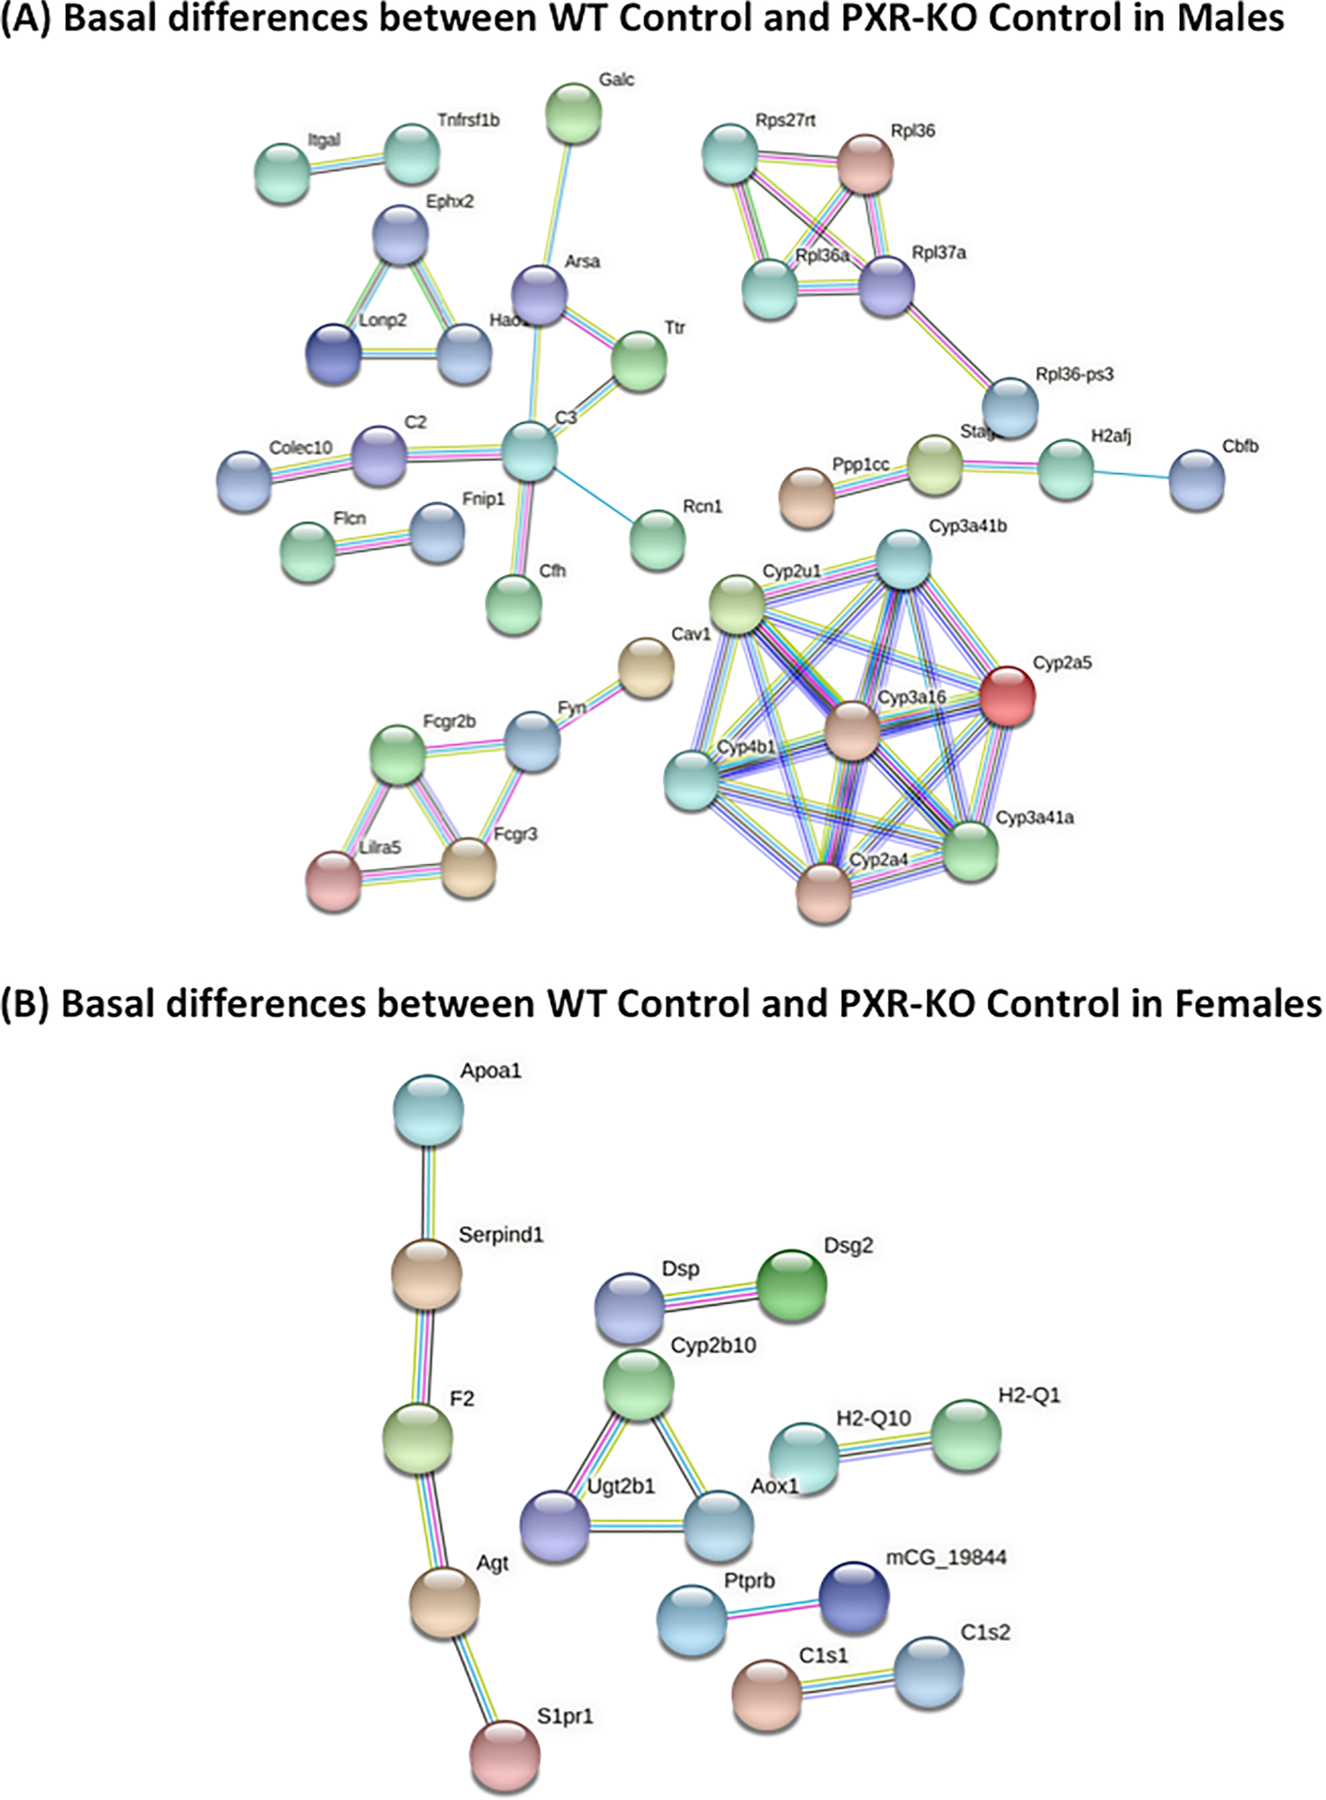
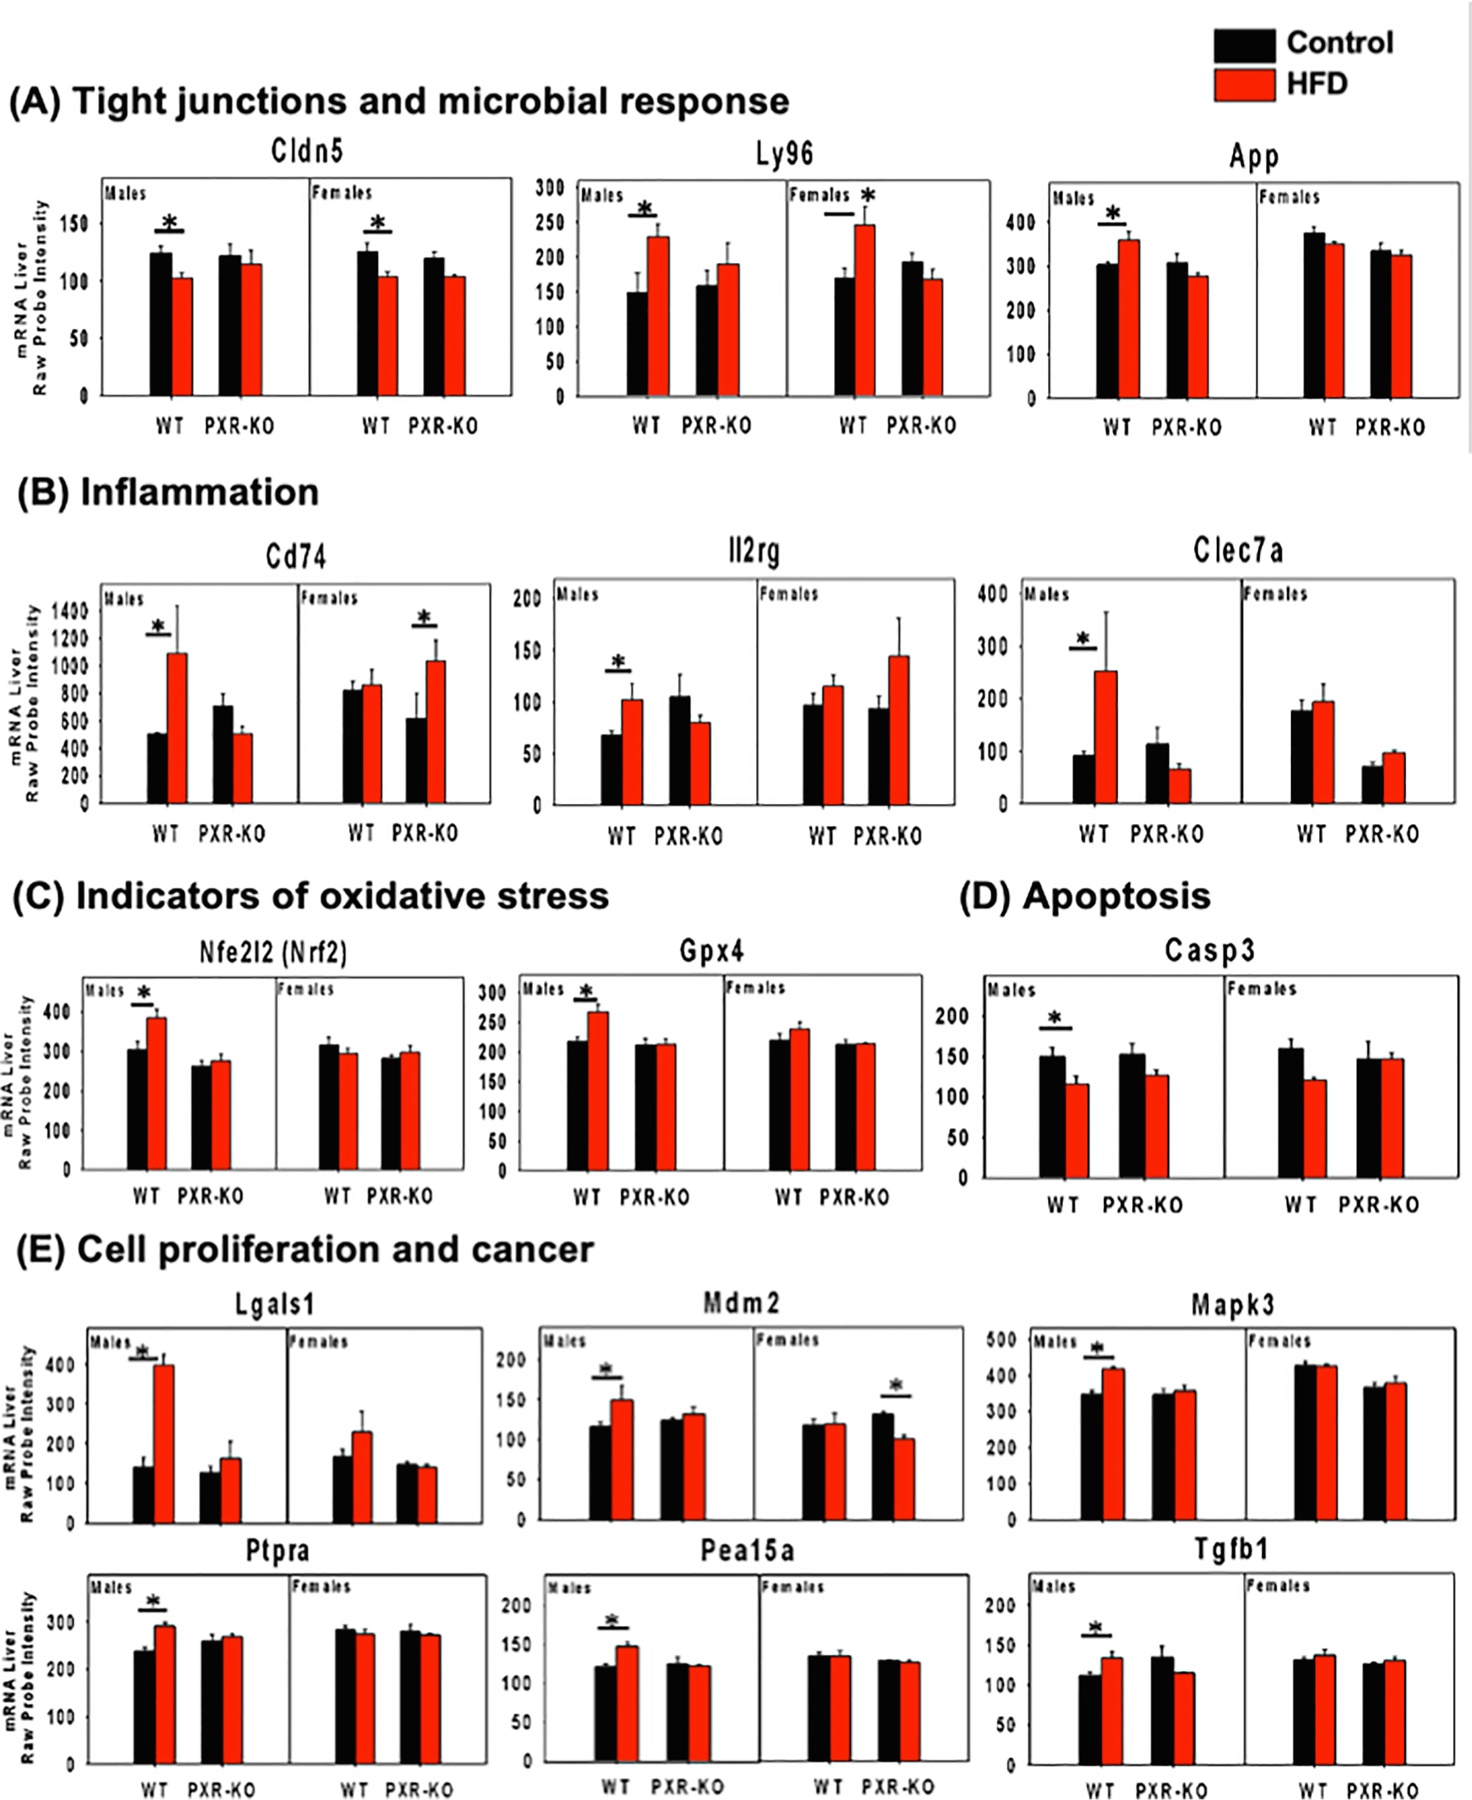
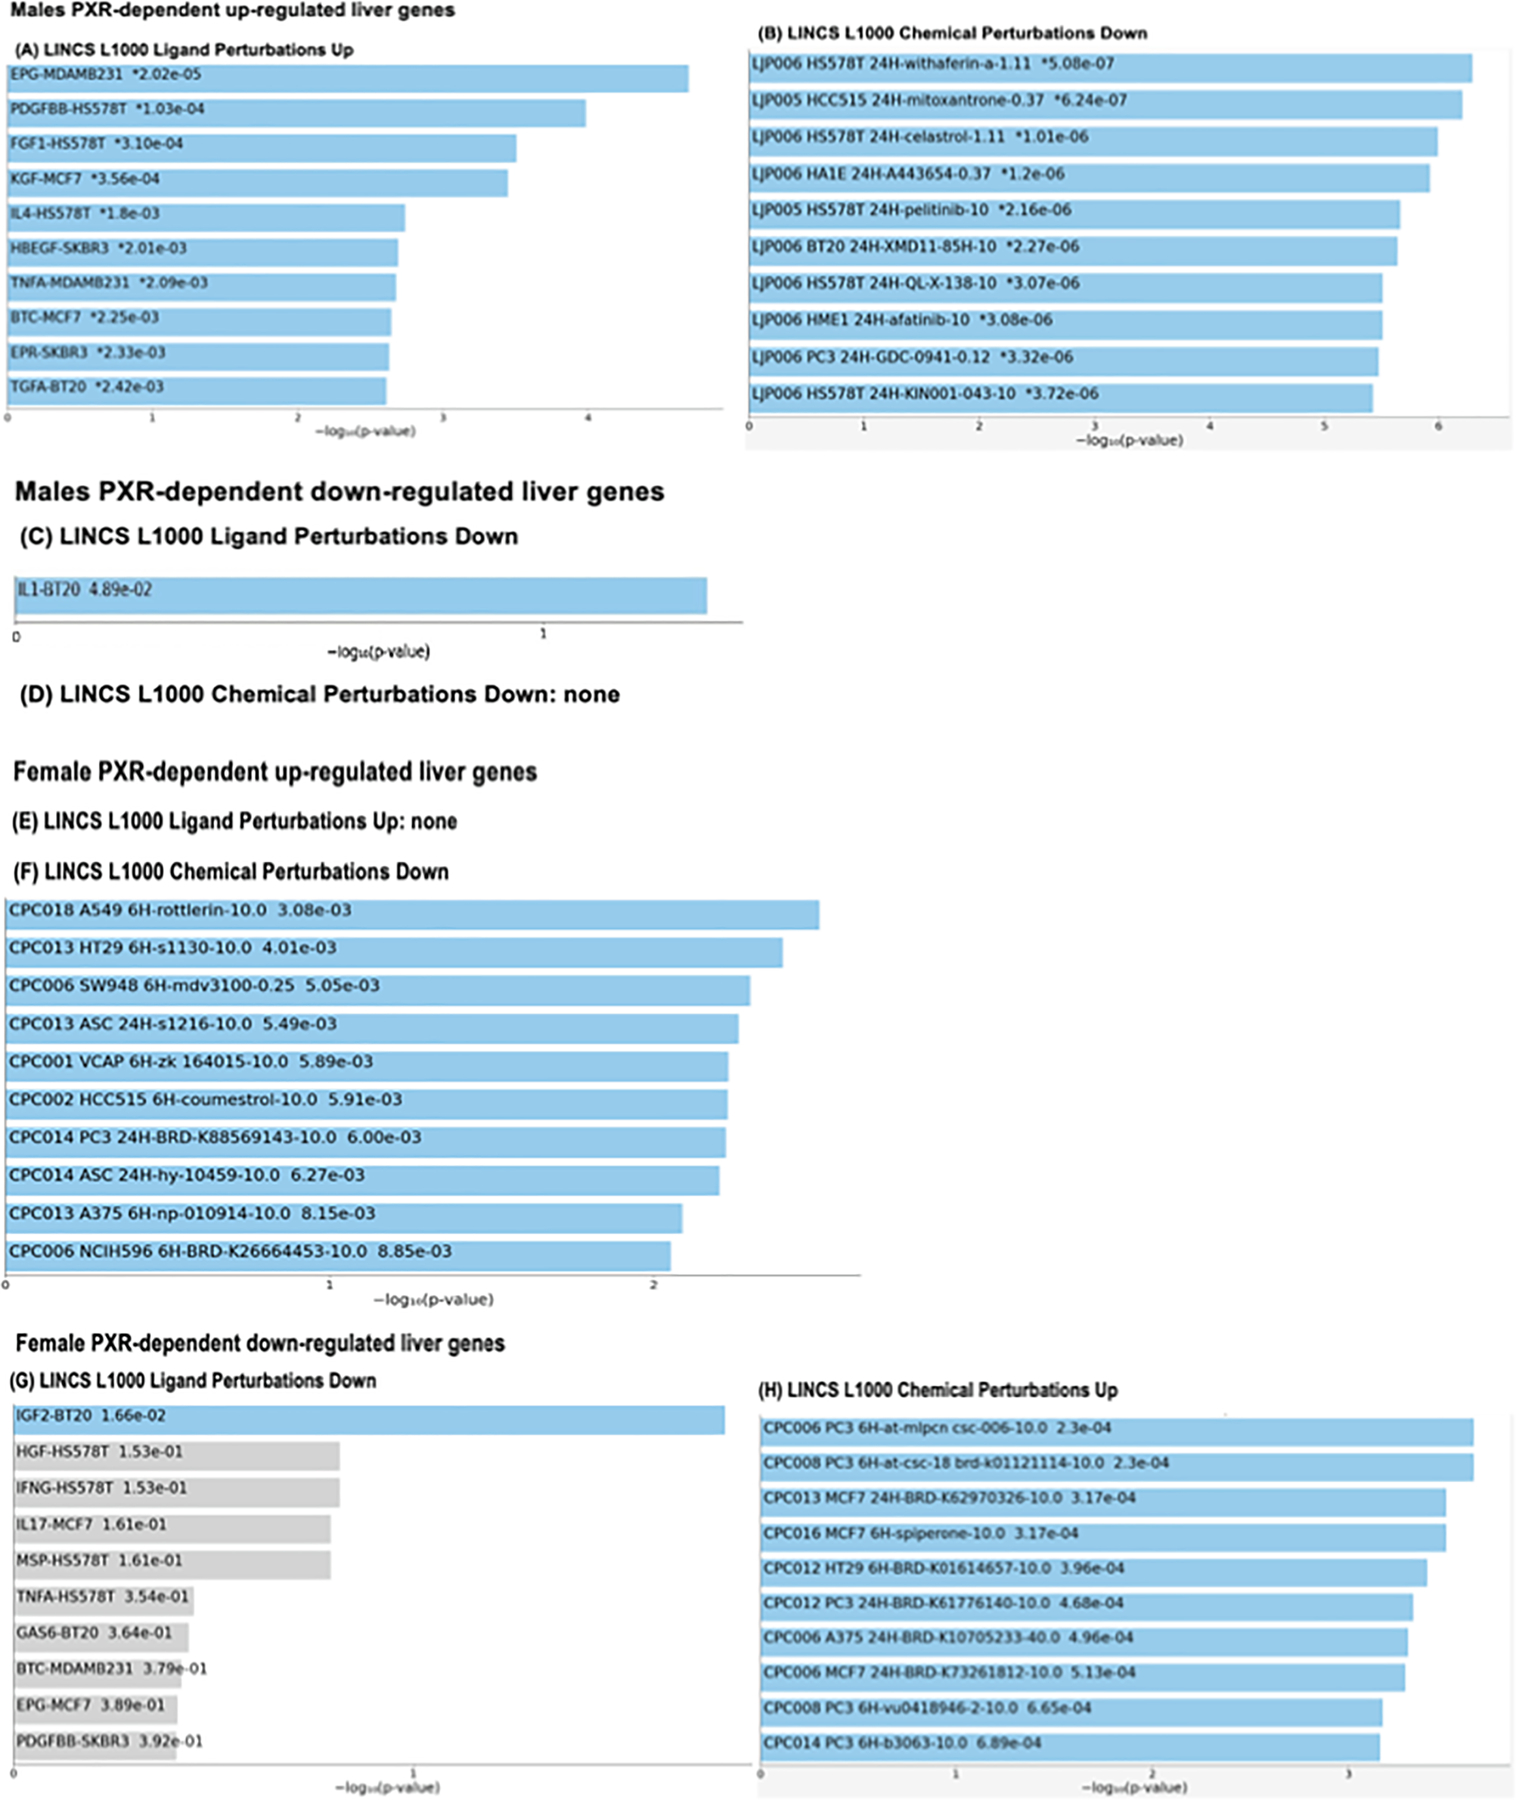
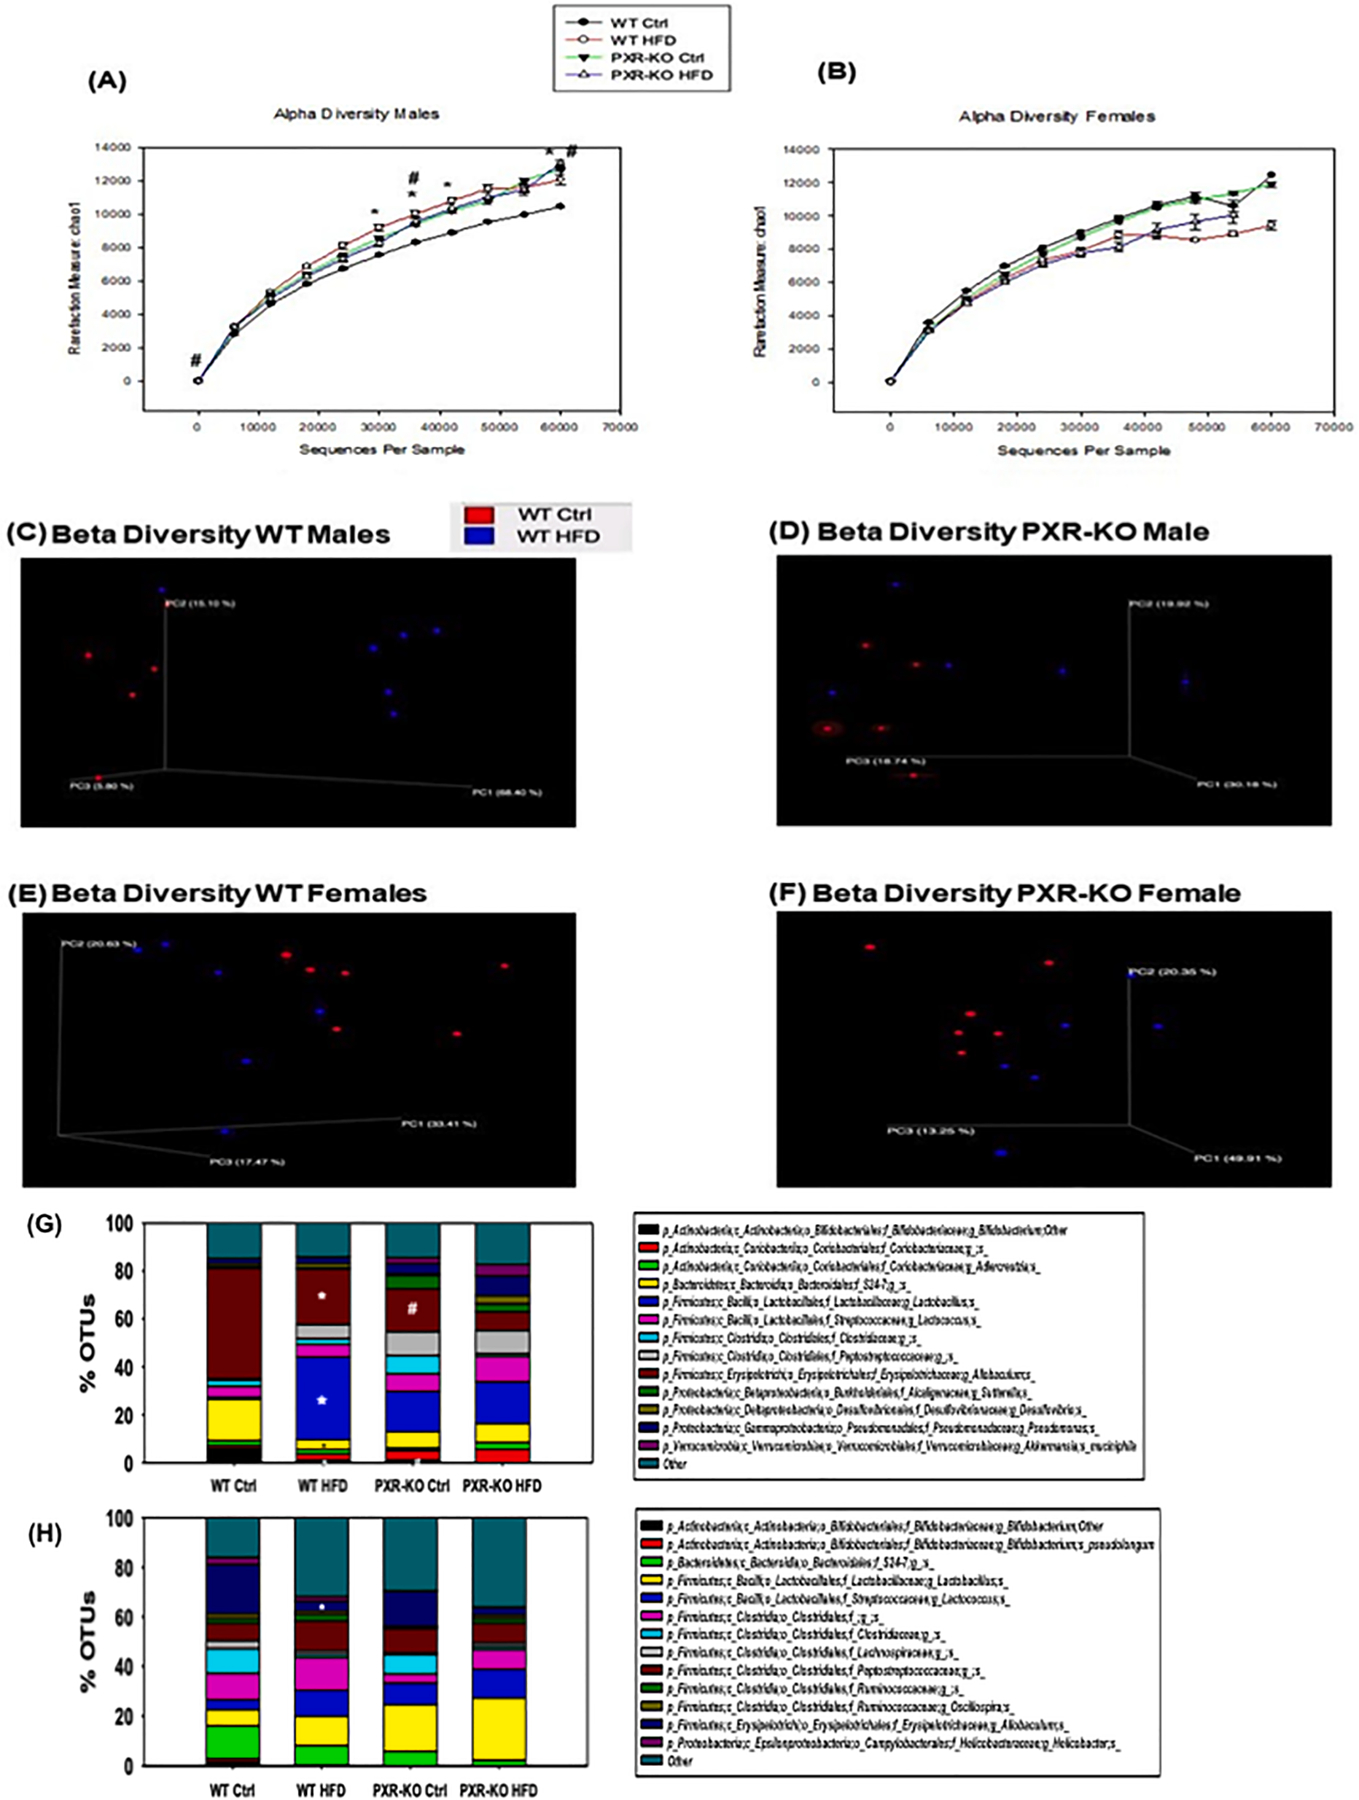
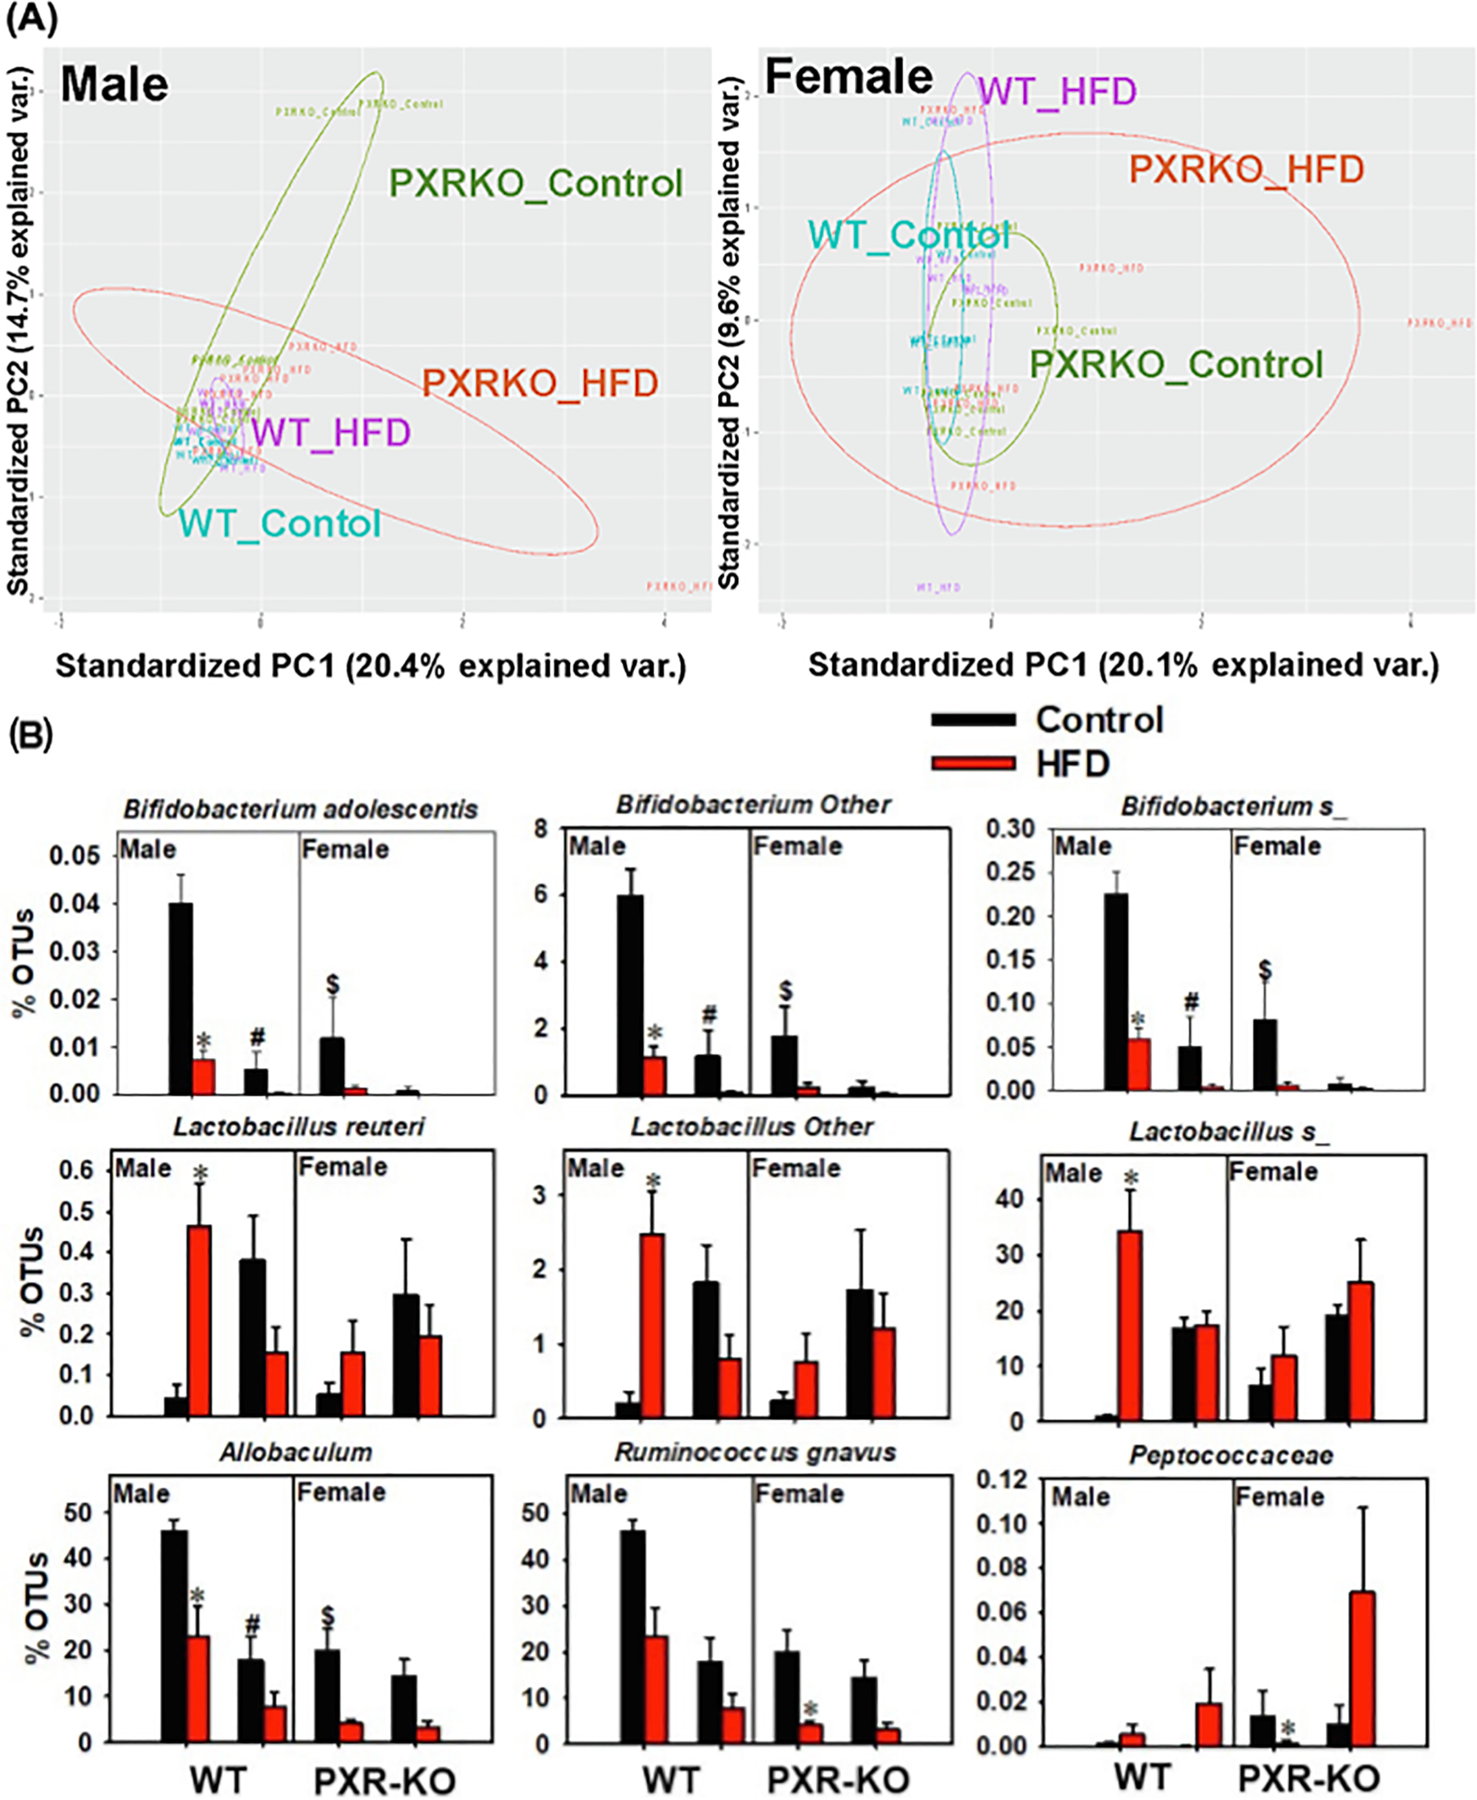
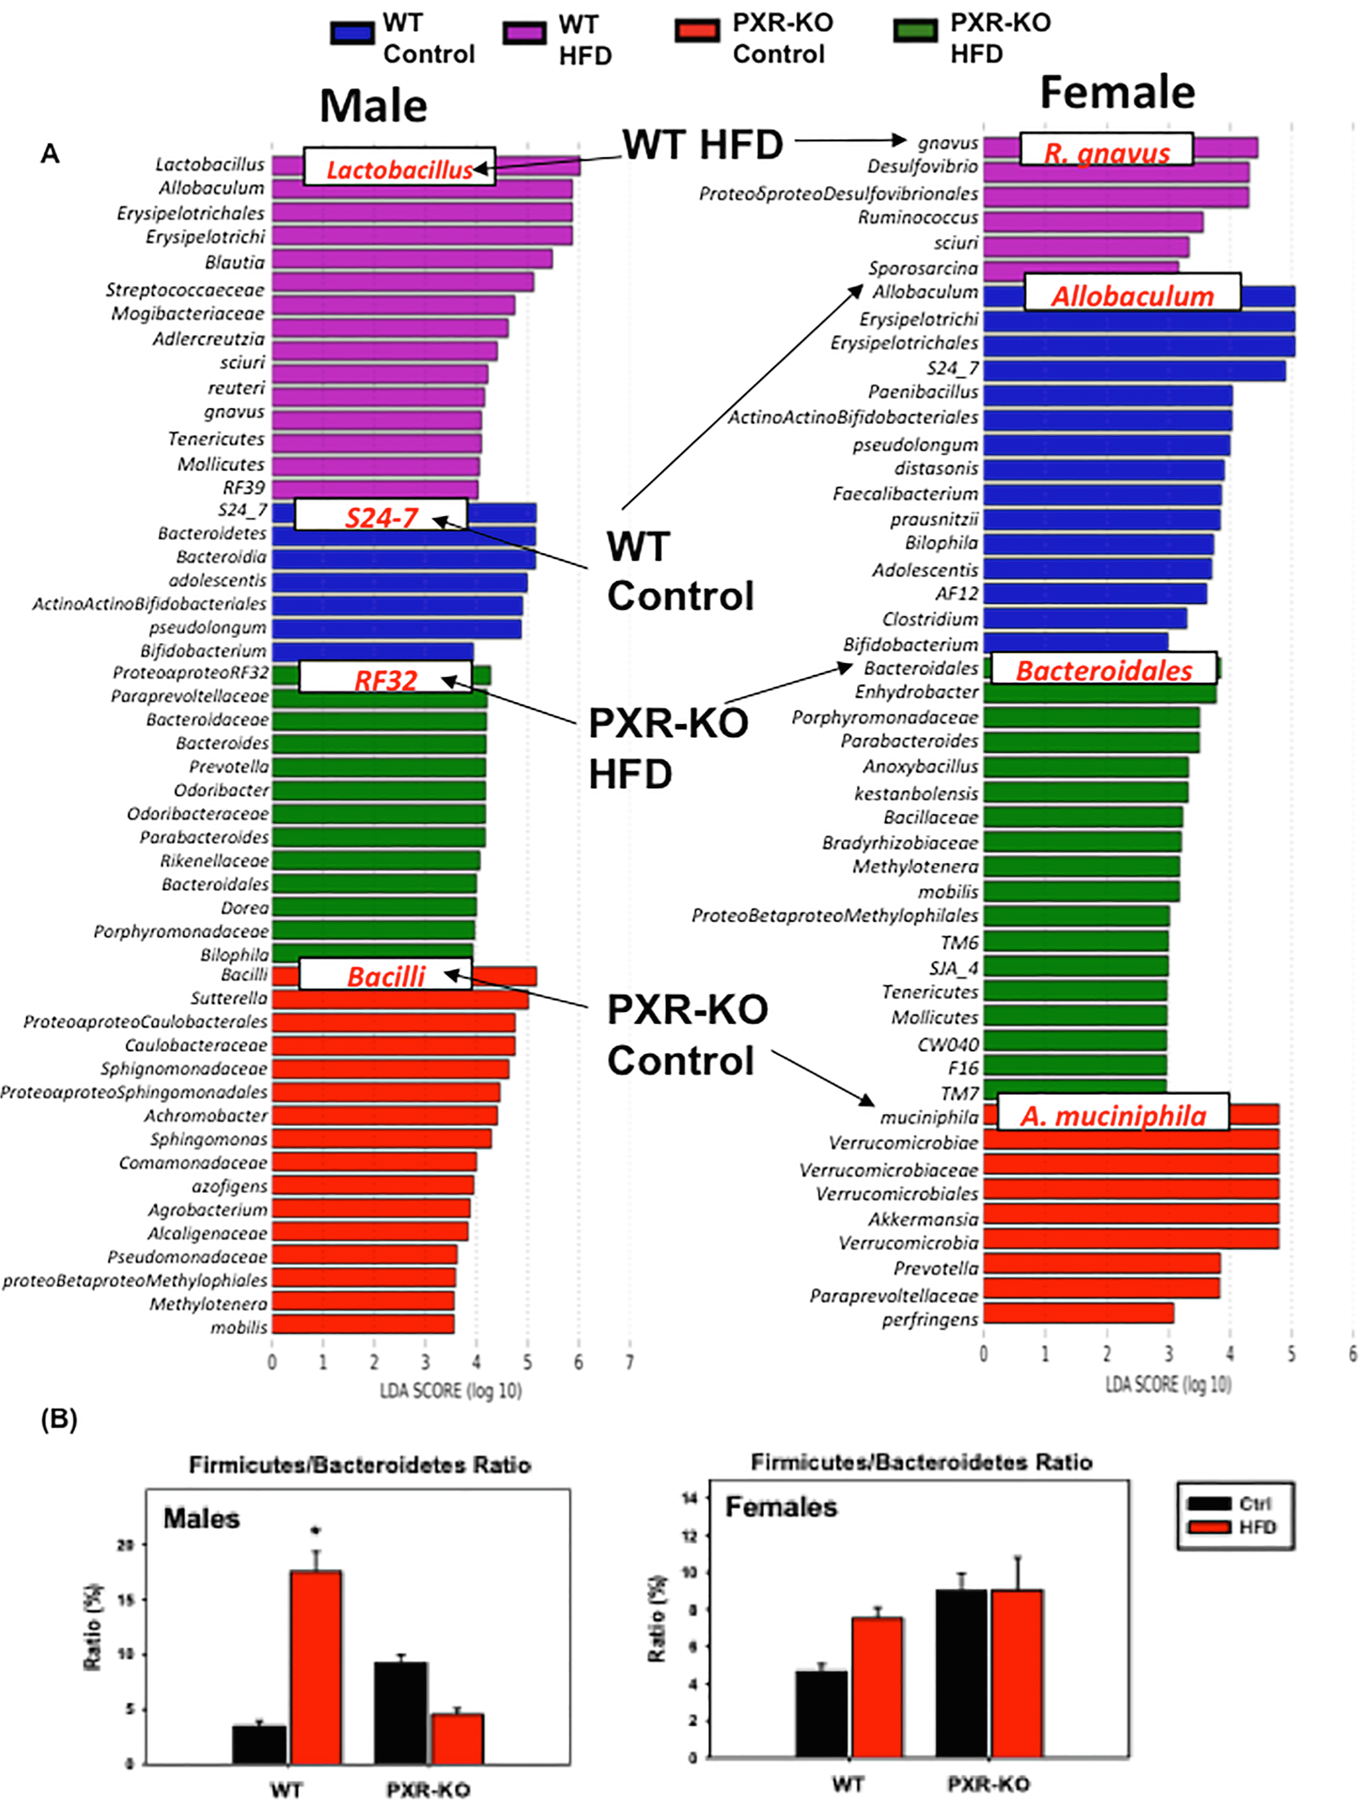
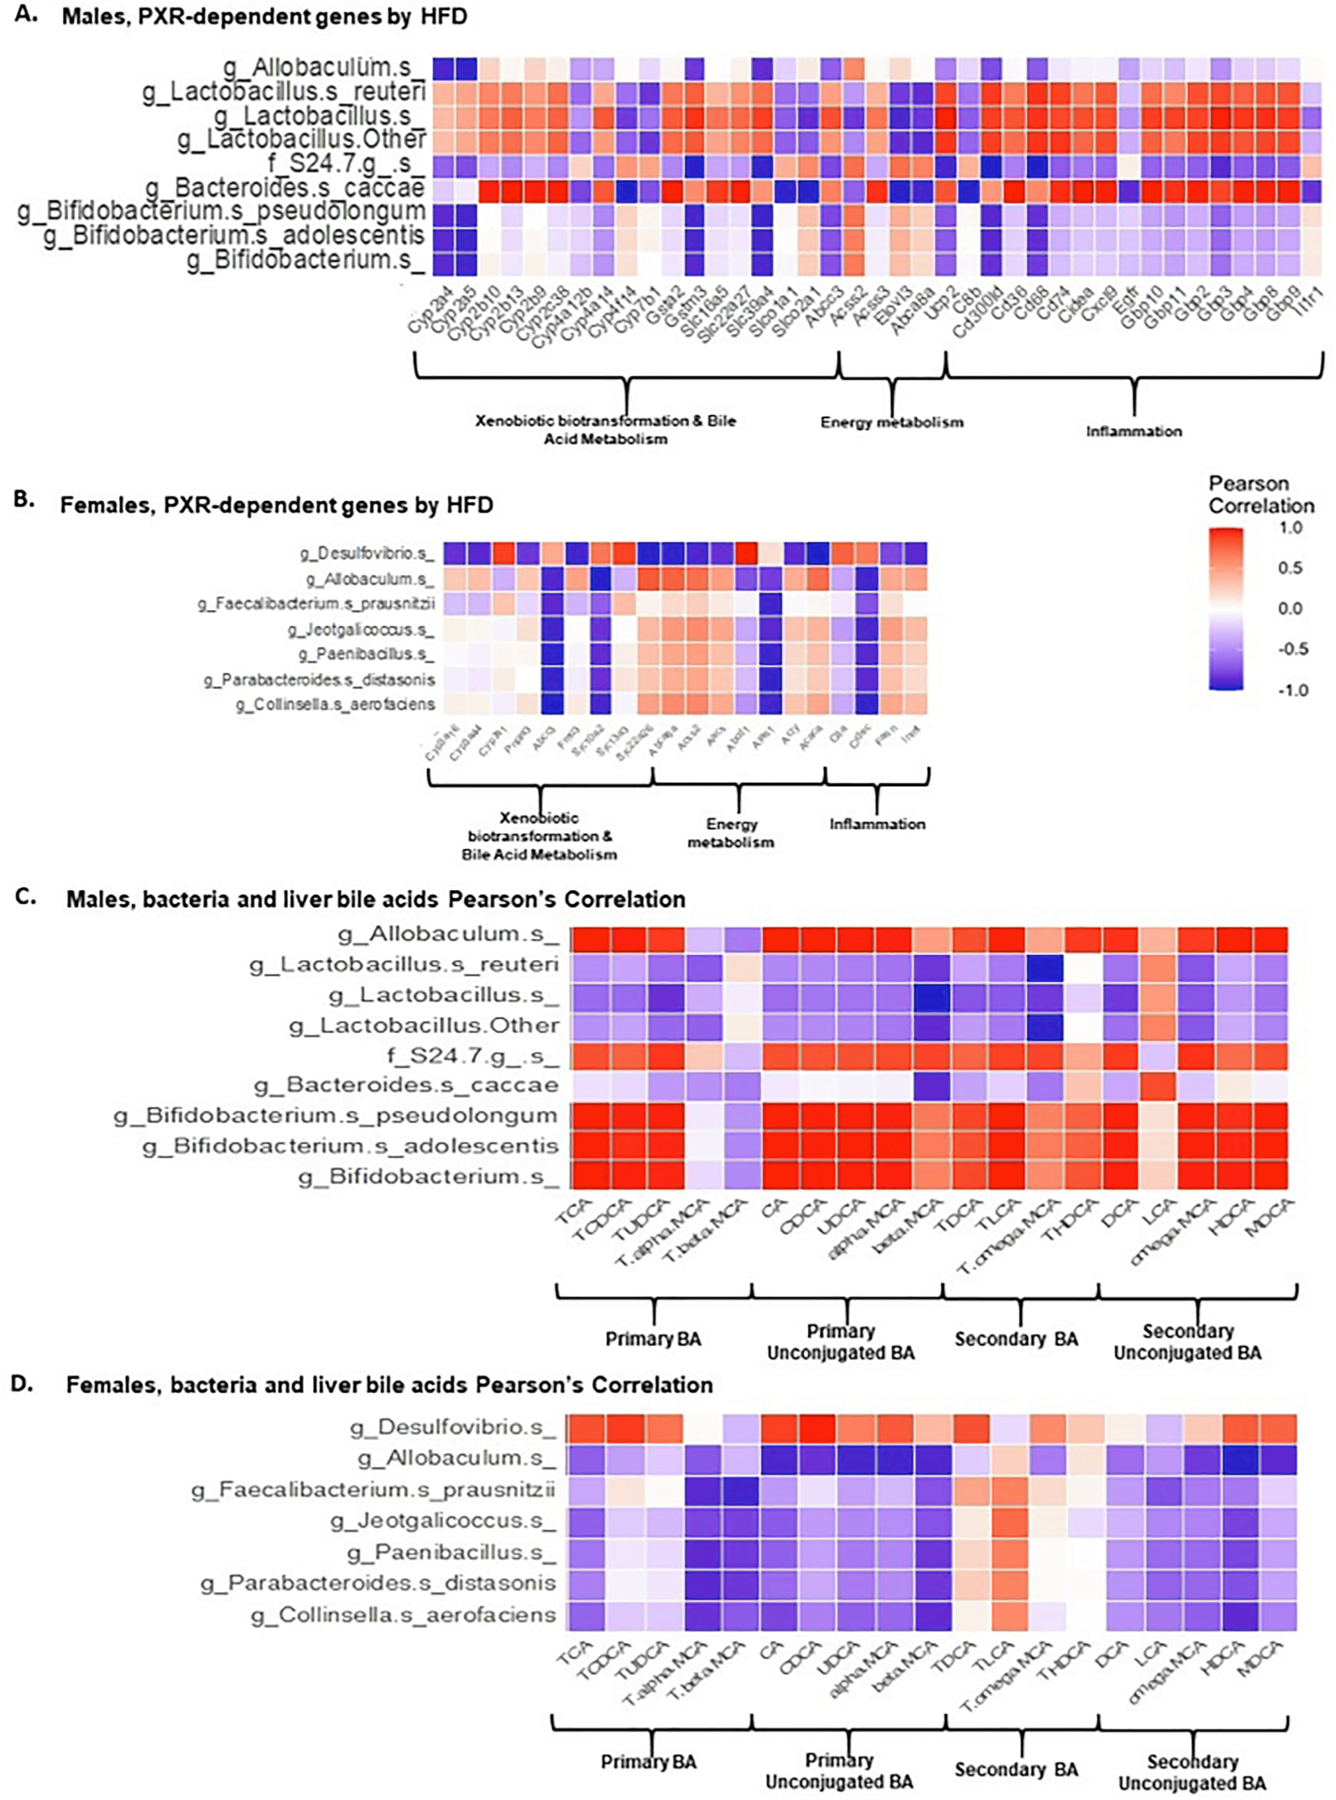
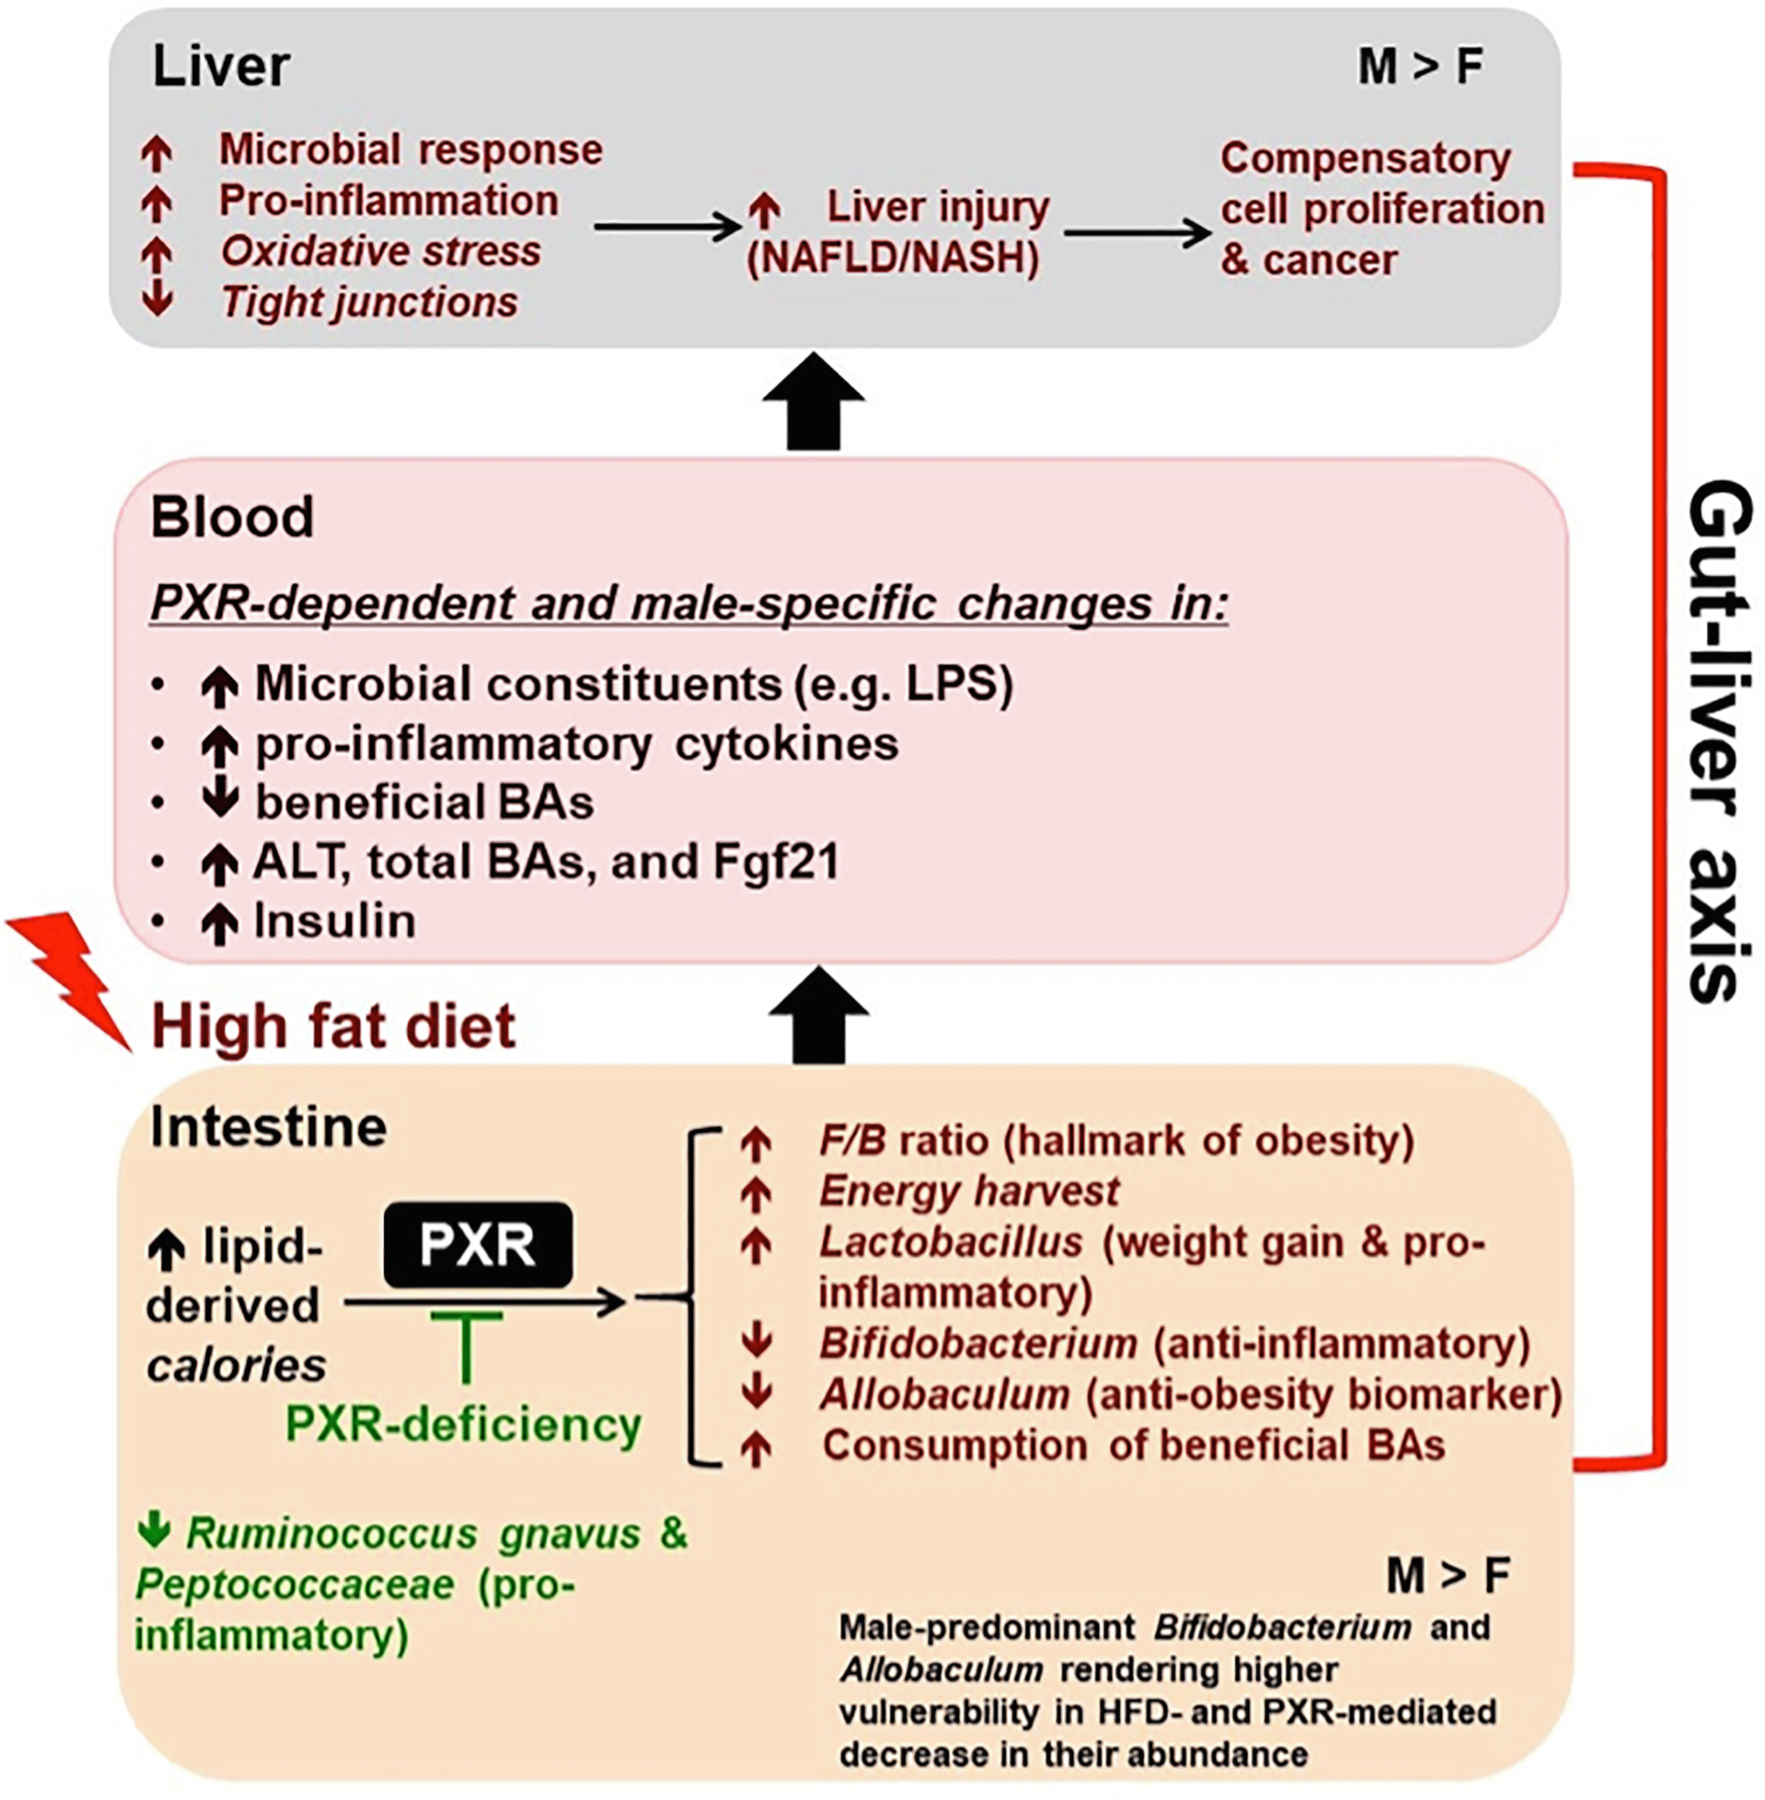
Nonalcoholic fatty liver disease (NAFLD) is the most prevalent chronic liver disease due to the current epidemics of obesity and diabetes. The pregnane X receptor (PXR) is a xenobiotic-sensing nuclear receptor known for trans-activating liver genes involved in drug metabolism and transport, and more recently implicated in energy metabolism. The gut microbiota can modulate the host xenobiotic biotransformation and contribute to the development of obesity. While the male sex confers a higher risk for NAFLD than women before menopause, the mechanism remains unknown. We hypothesized that the presence of PXR promotes obesity by modifying the gut-liver axis in a sex-specific manner. Male and female C57BL/6 (wild-type/WT) and PXR-knockout (PXR-KO) mice were fed control or high-fat diet (HFD) for 16-weeks. Serum parameters, liver histopathology, transcriptomic profiling, 16S-rDNA sequencing, and bile acid (BA) metabolomics were performed. PXR enhanced HFD-induced weight gain, hepatic steatosis and inflammation especially in males, accompanied by PXR-dependent up-regulation in hepatic genes involved in microbial response, inflammation, oxidative stress, and cancer; PXR-dependent increase in intestinal Firmicutes/Bacteroides ratio (hallmark of obesity) and the pro-inflammatory Lactobacillus, as well as a decrease in the anti-obese Allobaculum and the anti-inflammatory Bifidobacterum, with a PXR-dependent reduction of beneficial BAs in liver. The resistance to NAFLD in females may be explained by PXR-dependent decrease in pro-inflammatory bacteria (Ruminococcus gnavus and Peptococcaceae). In conclusion, PXR exacerbates hepatic steatosis and inflammation accompanied by obesity- and inflammation-prone gut microbiome signature, suggesting that gut microbiome may contribute to PXR-mediated exacerbation of NAFLD.

Keywords: Gut microbiome; High-fat diet; NAFLD; Obesity; PXR; Sex differences.


Conflict of interest statement

Declaration of Competing Interest

The authors declare that they have no known competing financial interests or personal relationships that could have appeared to influence the work reported in this paper.

Figures

Fig. 1.
Fig. 1.
The effect of HFD on obesity phenotypes in male and female WT and PXR-KO mice. (A). Body weights of male mice (B). Body weights of female mice (C). Weight gain. Data represent mean ± SEM (n = 7–11). Hepatic gene expression of (D). pregnane X receptor (Pxr) (E). Cyp2b19 (F). Cyp2b10, (G). Collage 1α, and Gapdh mRNAs were quantified as described in Materials and Methods. Data represent mean ± SEM (n = 5–6). #P < 0.05 between mice fed control and high-fat diet (HFD). †P < 0.05 between male mice fed HFD. βP < 0.05 between male and female mice fed HFD. §P < 0.05 between female mice fed HFD.
Fig. 2.
Fig. 2.
Characterization of hepatic histology, hepatic lipid levels and hepatic inflammatory cytokines gene expression in male and female WT and PXR-KO mice. (A). Hematoxylin and eosin (H&E) staining of liver sections. (B). Hepatic triglyceride levels (C). Lipid accumulation and inflammation pathology scores from histology of liver sections in control diet and HFD-fed WT and PXR-KO mice. A scale of 0 (no injury) to 5 (most severe injury) was used to assign the pathology scores in a double-blinded manner by a licensed pathologist. (D). Lipid accumulation (steatosis) and (E). Inflammation from histology of liver sections in control diet and HFD-fed WT and PXR-KO mice. Data represent mean ± SEM (n = 7–11). Hepatic gene expression of (F). Tnfα (G). Il-10 (H). Il-12β (I). Cx3cl1. Data represent mean ± SEM (n = 4–6). #P < 0.05 between mice fed control and high-fat diet (HFD). †P < 0.05 between male mice fed HFD. βP < 0.05 between male and female mice fed HFD.
Fig. 3.
Fig. 3.
Blood glucose levels during GTTs in male and female WT and PXR-KO mice fed control diet or a HFD. Intraperitoneal glucose tolerance test (IGTT) was performed after mice had been on the control diet or HFD for 15 weeks. IGTT was conducted on overnight fasting (12–15 h of starvation) animals and glucose levels were measured from blood collected from the tail vein using Contour TS blood glucose strips (Bayer HealthCare LLC, Mishawaka, IN).as described in Materials and Methods. IGTT assessed for (A). male WT mice (B). female WT mice (C). male PXR-KO mice (D). female PXR-KO mice. (E). Area under the curve (AUC) for the GTT calculated using Sigma Plot 12. 0 (Systat Software, Inc., San Jose, CA). Data represent mean ± SEM (n = 7–9). *P < 0.05 between male mice fed control diet. ‡P < 0.05 between male and female mice fed control diet. #P < 0.05 between mice fed control and high-fat diet (HFD). †P < 0.05 between male mice fed HFD. βP < 0.05 between male and female mice fed HFD
Fig. 4.
Fig. 4.
The effect of HFD on hepatic transcriptome in male and female WT and PXR-KO mice from the liver microarray experiments. (A). A Venn Diagram showing the common and uniquely regulated genes by HFD in each paired comparison (MWTHFD-MWTCT: effect of HFD over control in livers of male WT mice; FWTHFD-FWTCT: effect of HFD over control in livers of female WT mice; MPXRKOHFD-MPXRKOCT: effect of HFD over control in livers of male PXR-KO mice; FPXRKOHFD-FPXRKOCT: effect of HFD over control in livers of female PXR-KO mice). Data were analyzed using the limma R package and controlled for errors of multiple testing (adjusted p-value < 0.05). (B). Principal component analysis (PCA) in control and HFD-exposed groups in each sex and genotype using the prcomp function. (C). Two-way hierarchical clustering dendrograms of differentially regulated genes by HFD in MWT, FWT, MPXR-KO, and FPXR-KO conditions, as generated by the heatmap.2 function in the gplots R package. The numbers on the y-axis indicate the total number of differentially regulated genes by HFD (adjusted p-value < 0.05). Red represents relatively high expression, blue represents relatively low expression. (For interpretation of the references to colour in this figure legend, the reader is referred to the web version of this article.)
Fig. 5.
Fig. 5.
String analysis showing the uniquely regulated pathways by HFD in livers of male WT (MWT) mice from the liver microarray experiments. Genes that were differentially regulated by HFD only in MWT (adjusted p-value < 0.05), but not in FWT, MPXR-KO, or FPXR-KO, were used as input. The full network with the edges based on highest confidence indicating both functional and physical protein associations was examined. Disconnected nodes in the network are not shown. All the differentially regulated (FDR < 0.05) KEGG Pathways are shown in the bottom table.
Fig. 6.
Fig. 6.
String analysis showing the uniquely regulated pathways by HFD in livers of male PXR-KO (MPXR-KO) mice from the liver microarray experiments. Genes that were differentially regulated by HFD only in MPXR-KO MWT (adjusted p-value < 0.05), but not in MWT, FWT, or FPXR-KO, were used as input. The full network with the edges based on highest confidence indicating both functional and physical protein associations were examined. Disconnected nodes in the network are not shown. All the differentially regulated (FDR < 0.05) KEGG Pathways are shown in the bottom table.
Fig. 7.
Fig. 7.
String analysis showing the uniquely regulated pathways by HFD in livers of female WT (FWT) mice from the liver microarray experiments. Genes that were differentially regulated by HFD only in FWT (adjusted p-value < 0.05), but not in MWT, MPXR-KO, or FPXR-KO, were used as input. The full network with the edges based on highest confidence indicating both functional and physical protein associations was examined. Disconnected nodes in the network are not shown. All the differentially regulated (FDR < 0.05) KEGG Pathways are shown in the bottom table.
Fig. 8.
Fig. 8.
String analysis showing the uniquely regulated pathways by HFD in livers of female PXR-KO (FPXR-KO) mice from the liver microarray experiments. Genes that were differentially regulated by HFD only in FPXR-KO (adjusted p-value < 0.05), but not in MWT, FWT, or MPXR-KO, were used as input. The full network with the edges based on highest confidence indicating both functional and physical protein associations was examined. Disconnected nodes in the network are not shown. All the differentially regulated (FDR < 0.05) KEGG Pathways are shown in the bottom table.
Fig. 9.
Fig. 9.
String analysis showing the uniquely regulated pathways by control diet in livers of male and female WT and PXR-KO mice from the liver microarray experiments. (A). Basal gene expression differentially regulated by control diet in male WT and PXR-KO mice. (B). Basal gene expression differentially regulated by control diet in female WT and PXR-KO mice. The full network with the edges based on highest confidence indicating both functional and physical protein associations was examined. Disconnected nodes in the network are not shown.
Fig. 10.
Fig. 10.
mRNA expression of differentially regulated genes involved in tight junctions and microbial response from the liver microarray experiments. (A). tight junctions, (B). inflammation, (C). indicators of oxidative stress, (D). apoptosis, (E). cell proliferation and cancer are shown. Asterisks represent statistically significant differences between HFD and the control group of the same sex and genotype (limma, adjusted p-value < 0.05).
Fig. 11.
Fig. 11.
(A). Overlay between HFD-up-regulated bona fide PXR-target genes in livers of male mice from the liver microarray experiments and the up-regulated ligand molecules in the LINCS L1000 Ligand Perturbations Database (https://lincsproject.org/). The top 10 significantly enriched ligands with the significance score (−log10[p-value]) are shown. (B). Overlap between HFD-up-regulated bona fide PXR-target genes in livers of male mice and the drugs that were able to down-regulate these genes in the LINCS L1000 Ligand Perturbations Database. The top 10 significantly enriched drugs with the significance score (−log10[p-value]) are shown. (C). Overlay between HFD-down-regulated bona fide PXR-target genes in livers of male mice and the down-regulated ligand molecules in the LINCS L1000 Ligand Perturbations Database. The top 10 significantly enriched ligands with the significance score (−log10[p-value]) are shown. (D). There was no enrichment between the HFD-down-regulated bona fide PXR target genes in livers of male mice and the drugs that were able to up-regulate these genes in the LINCS L1000 Ligand Perturbations Database. (E). There was no overlay between HFD-up-regulated bona fide PXR-target genes in livers of female mice and the up-regulated ligand molecules in the LINCS L1000 Ligand Perturbations Database. (F). Overlay between HFD-up-regulated bona fide PXR-target genes in livers of female mice and the down-regulated ligand molecules in the LINCS L1000 Ligand Perturbations Database (there was no overlap between this groups of genes with the up-regulated ligand molecules). The top 10 significantly enriched ligands with the significance score (−log10[p-value]) are shown. (G-H). Top: overlay between HFD-down-regulated bona fide PXR-target genes in livers of female mice and the down-regulated ligand molecules in the LINCS L1000 Ligand Perturbations Database. The top 10 significantly enriched ligands with the significance score (– log10[p-value]) are shown. Bottom: overlay between HFD-down-regulated bona fide PXR-target genes in livers of female mice and the drugs that are able to up-regulate these genes in the LINCS L1000 Ligand Perturbations Database. The top 10 significantly enriched drugs with the significance score (−log10[p-value]) are shown.
Fig. 12.
Fig. 12.
The effect of HFD on the gut microbiome from the 16S rDNA sequencing experiments. (A-B). Alpha diversities (Chao1 index) of gut microbiota in WT and PXR-KO male and female mice exposed to control diet and high fat diet (n = 6 per group). The data were analyzed using QIIME as described in the Materials and Methods section. (C-D). Beta diversities of LIC microbiota in male WT and PXR-KO mice exposed to control and high fat diet. (E-F). Beta diversity of LIC microbiota in female WT and PXR-KO mice exposed to control and high fat diet. Differentially regulated intestinal bacteria at the species level (L7) from (G) male and (H) female mice (n = 5–6 per group) (16S rDNA sequencing). Asterisks (*) represent statistically significant differences as compared with control diet and high fat diet groups; pounds (#) represent statistically significant differences as compared with WT and PXR-KO genotype groups (two-way ANOVA; statistical significance was considered at p < 0.05).
Fig. 13.
Fig. 13.
The effect of HFD on the gut microbiome from the 16S rDNA sequencing experiments. (A) Beta diversity of male and female WT and PXR-KO mice as shown by PCA plots. (B) Differentially regulated bacteria at a species level. Asterisks (*) represent statistically significant differences as compared with control diet and high fat diet groups; pounds (#) represent statistically significant differences as compared with WT and PXR-KO genotype groups (two-way ANOVA; statistical significance was considered at p < 0.05).
Fig. 14.
Fig. 14.
The effect of HFD on bacteria species level from the 16S rDNA sequencing experiments. (A). LEfSe (Linear discriminant analysis Effect Size) of males and females WT and PXR-KO control and high fat diet fed. (B). Ratio of F/B of WT and PXR-KO control and HFD. Asterisks (*) represent statistically significant differences as compared with control diet and high fat diet groups.
Fig. 15.
Fig. 15.
Pearson correlations between PXR-dependent liver genes (liver microarray) or hepatic bile acids (UPLC-MS/MS) and gut microbiota/microbial metabolites (16S rDNA sequencing/LC-MS) following HFD ingestion. (A-B). Pearson correlation of differentially regulated intestinal bacteria and PXR-dependent HFD-regulated liver genes in the following category: xenobiotic biotransformation & bile acid metabolism, energy metabolism, as well as inflammation (C-D). Pearson correlations of liver bile acids and differentially regulated intestinal bacteria of male and female WT and PXR-KO mice as regulated by HFD.
Fig. 16.
Fig. 16.
Summary diagram of key findings of the study. PXR promotes hepatic steatosis and inflammation through gut microbiome in a male-specific manner. PXR worsens HFD-induced hepatic steatosis and inflammation accompanied by a PXR-dependent obesity- and inflammation-prone gut microbiome signature.

Similar articles

Cited by

References

    1. Younossi ZM, Koenig AB, Abdelatif D, Fazel Y, Henry L, Wymer M, Global epidemiology of nonalcoholic fatty liver disease-Meta-analytic assessment of prevalence, incidence, and outcomes, Hepatology 64 (2016) 73–84. - PubMed
    1. Clarke SF, Murphy EF, Nilaweera K, Ross PR, Shanahan F, O’Toole PW, Cotter PD, The gut microbiota and its relationship to diet and obesity: new insights, Gut Microbes 3 (3) (2012) 186–202. - PMC - PubMed
    1. Drissi F, Merhej V, Angelakis E, El Kaoutari A, Carrière F, Henrissat B, Raoult D, Comparative genomics analysis of Lactobacillus species associated with weight gain or weight protection, Nutr Diabetes 4 (2) (2014) e109 e109. - PMC - PubMed
    1. Sivamaruthi BS, Kesika P, Suganthy N, Chaiyasut C, A Review on Role of Microbiome in Obesity and Antiobesity Properties of Probiotic Supplements, Biomed Res Int 2019 (2019) 3291367. - PMC - PubMed
    1. Turnbaugh PJ, Ley RE, Mahowald MA, Magrini V, Mardis ER, Gordon JI, An obesity-associated gut microbiome with increased capacity for energy harvest, Nature 444 (2006) 1027–1031. - PubMed

Publication types

MeSH terms