Review
. 2021 Aug 24;15(8):12483-12496.
doi: 10.1021/acsnano.1c04708. Epub 2021 Jul 26.

Single Molecules Are Your Quanta: A Bottom-Up Approach toward Multidimensional Super-resolution Microscopy

Affiliations
Review

Single Molecules Are Your Quanta: A Bottom-Up Approach toward Multidimensional Super-resolution Microscopy

Limin Xiang et al. ACS Nano. .

Abstract

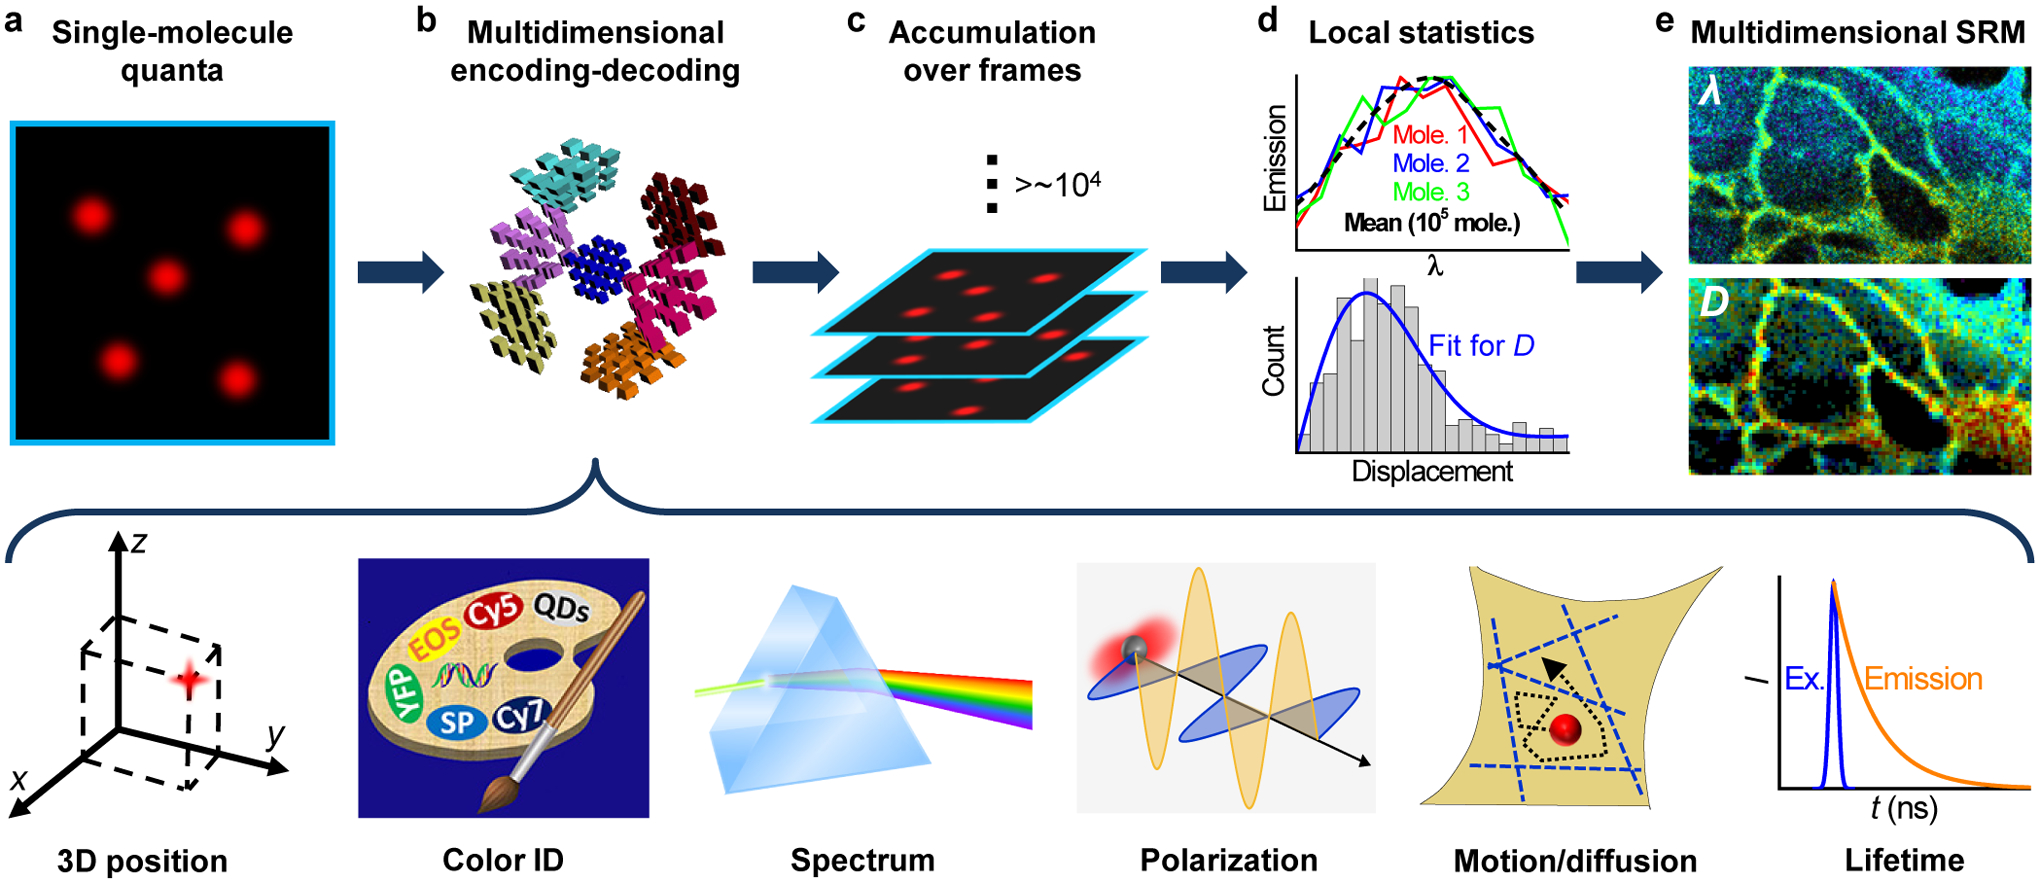
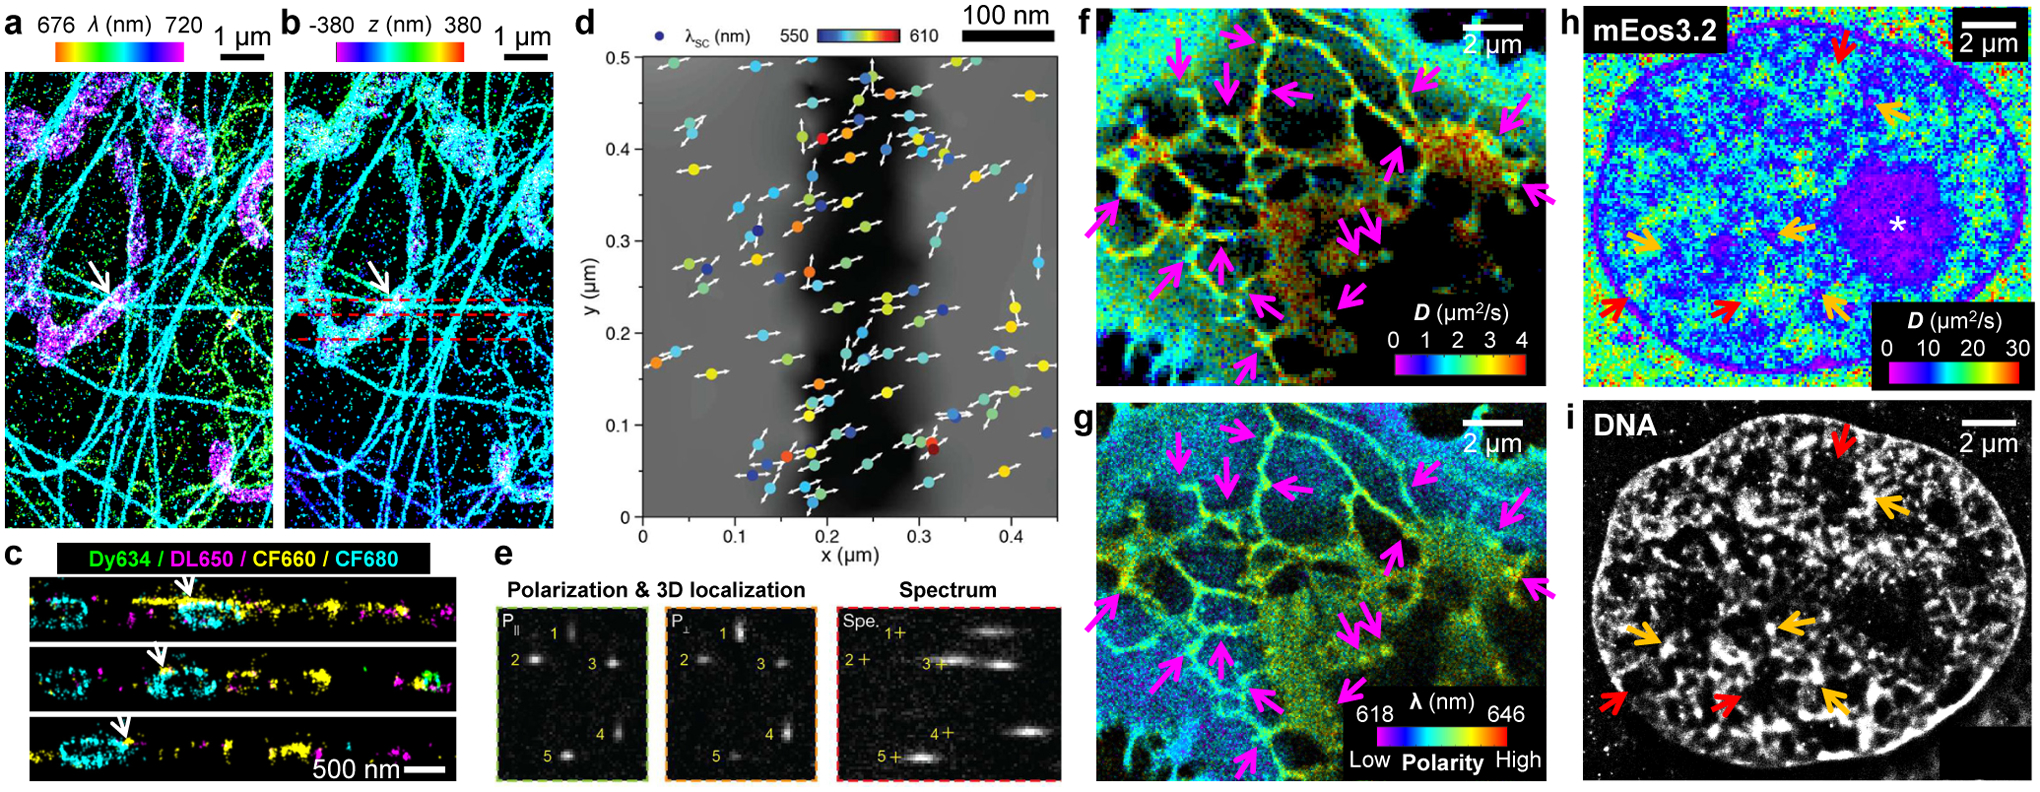
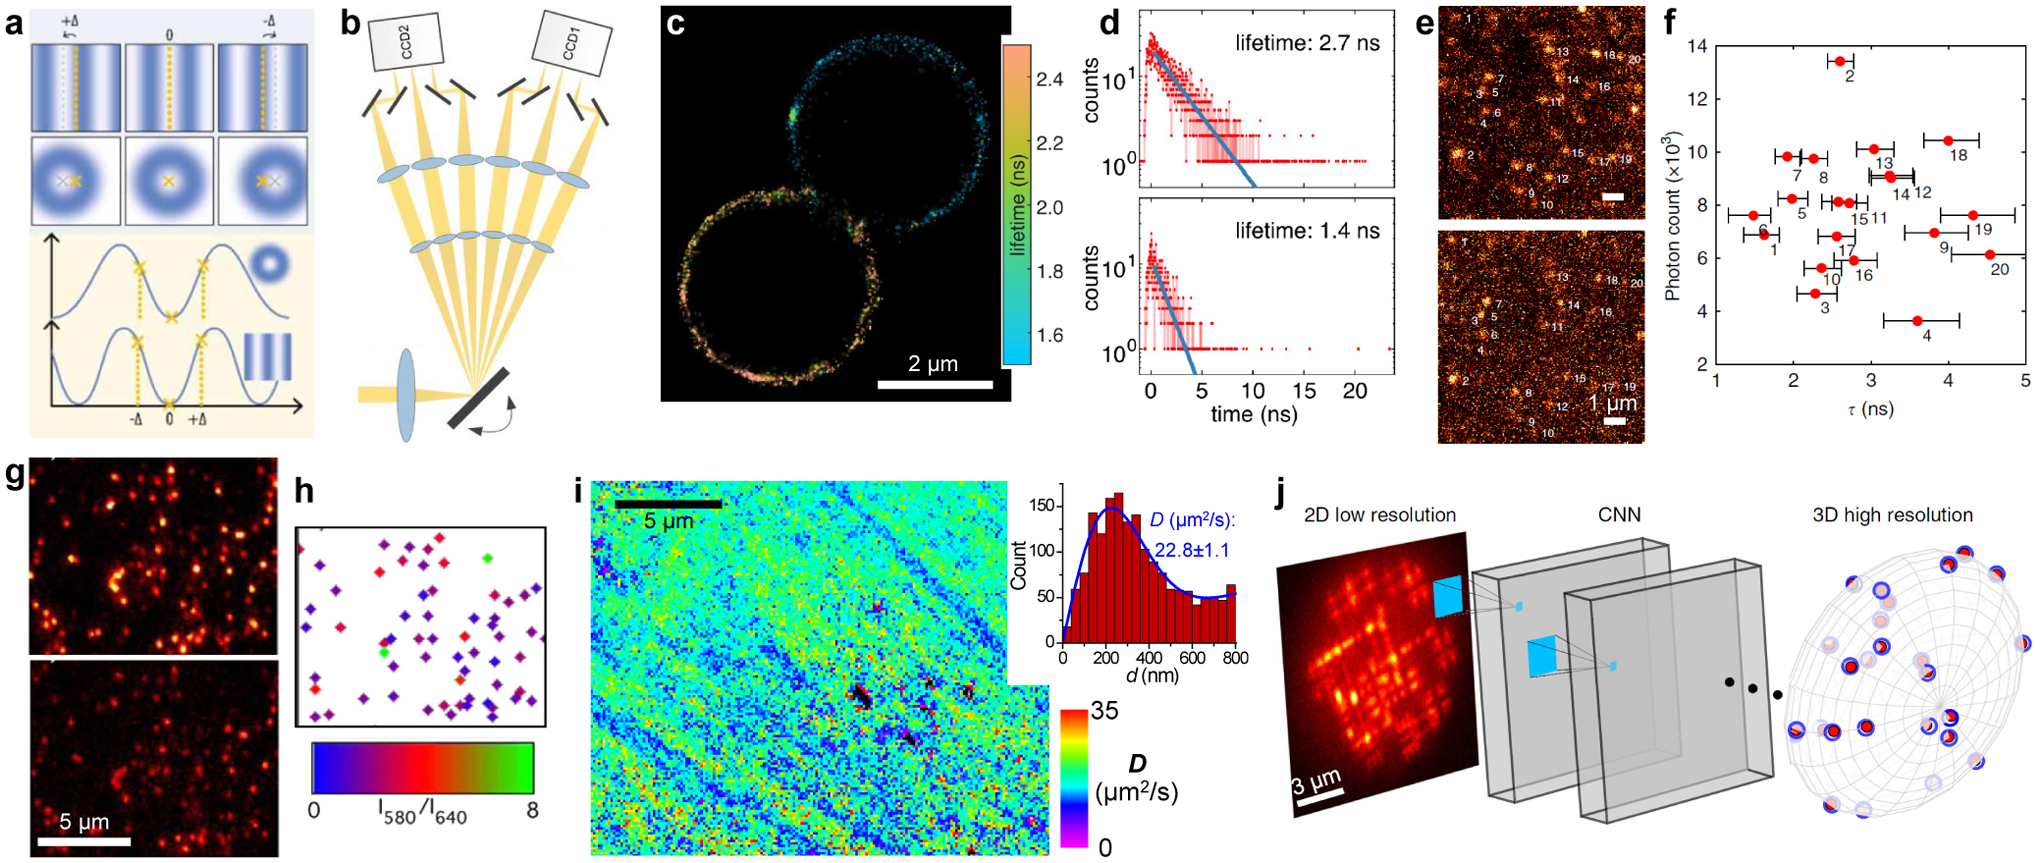
The rise of single-molecule localization microscopy (SMLM) and related super-resolution methods over the past 15 years has revolutionized how we study biological and materials systems. In this Perspective, we reflect on the underlying philosophy of how diffraction-unlimited pictures containing rich spatial and functional information may gradually emerge through the local accumulation of single-molecule measurements. Starting with the basic concepts, we analyze the uniqueness of and opportunities in building up the final picture one molecule at a time. After brief introductions to the more established multicolor and three-dimensional measurements, we highlight emerging efforts to extend SMLM to new dimensions and functionalities as fluorescence polarization, emission spectra, and molecular motions, and discuss rising opportunities and future directions. With single molecules as our quanta, the bottom-up accumulation approach provides a powerful conduit for multidimensional microscopy at the nanoscale.


Figures

Figure 1.
Figure 1.
A bottom-up approach toward multidimensional super-resolution microscopy. (a) Emitting single molecules are kept at a low density in the wide field, so that they could be each independently evaluated for their nanoscale positions and high-dimensional properties. (b) Examples of multidimensional single-molecule observables that may be encoded-decoded, including localization in 3D, color identity, spectrum, fluorescence polarization, motion and diffusion, and fluorescence lifetime. (c) Stochastic sampling of single molecules over many camera frames, e.g., through photoswitching or diffusional exchange, to enable accumulation of the single-molecule quanta. (d) The accumulated single-molecule measurements enable local statistics to extract meaningful parameters at the nanoscale. (e) Resultant multidimensional super-resolution images, with the possibility to integrate measurements of different dimensions. The palette scheme in (b) is adapted from ref.
Figure 2.
Figure 2.
Multi-view referencing for 3D, multicolor, and polarization SMLM. (a) Integration of biplane 3D imaging (green box: shifted focal planes between two views) and ratiometric color detection (blue box: fluorescence split into long- and short-wavelength components). LP-DM: long-pass dichroic mirror. Inset: single-molecule images obtained in the two views. (b) Simulated images of a point source at different axial positions for two views with a 500-nm focal shift. (c) Density heatmaps of photon counts recorded in the long- and short-wavelength channels, for individual molecules of four different dyes with their emission spectra (colored curves) and the transmission of the dichroic mirror (black curve) shown in the inset. (d) Four-color SMLM of a fixed cell by separating the four probes based on (c). (e) 3D-SMLM based on multiphase interference between fluorescence collected from two opposing objective lenses. (f) Expected brightness detected by the three cameras in (e) for single molecules at different axial positions. (g) Splitting the fluorescence into two orthogonal polarizations. (h) (top) Fluorescence images of single pcRhB molecules in PMMA, recorded in two channels of orthogonal polarizations. (bottom) Density heatmaps of photon counts recorded in the two channels for different single molecules. (i) Same as (h), but for pcRhB in mowiol. (j) An electro-optic modulator (EOM) rotates the linear polarization direction of the excitation laser in consecutive frames. (k) Resultant images of two rhodamine 101 molecules in PMMA, showing dissimilar changes in brightness in consecutive frames. (l) Classification of single β-actin-tdEosFP molecules in the SMLM image into immobile (green) and mobile (red) fractions based on the brightness in two channels of orthogonal polarizations (inset). (m) Single-molecule orientations measured for Alexa Fluor 488-phalloidin labeled to two actin fibers in fixed cells. Red arrows: averaged fiber direction. Red boxes: regions of structural heterogeneity. (n) Color-coded orientation-resolved SMLM image for SYTOX Orange labeled to a DNA strand in vitro. Arrows: abrupt bends. Inset: absorption dipole moment of the dye is perpendicular to the DNA axis. (o) Orientation-resolved SMLM image of Nile Red in a phase-separated supported lipid bilayer, shown as maps of solid angle (Ω), polar angle (θ), and combined phase index. (a) is from ref. (b) is from ref. (c,d) are from ref. (e,f) are from ref. (g,m) are from ref. (h,i,l) are from ref. (j,k,n) are from ref. (o) is from ref.
Figure 3.
Figure 3.
Spectrally resolved SMLM unveils nanoscale heterogeneities in biological and materials systems. (a) Schematic of a beamsplitter-based system. IP, intermediate image plane of the microscope; BS, beamsplitter. (b) A small region of single-molecule images (top) and spectra (bottom) concurrently acquired in a 6 ms snapshot from Paths 1 and 2 in (a), respectively, for Nile Red molecules in a supported lipid bilayer (SLB). Crosses in the spectral channel denote the spectral position of 590 nm for each molecule, as obtained by referring to the positions of the same molecules in the image channel. (c) Spectra of the three molecules in (b), compared to that averaged from 280,898 single molecules from the same sample. (d) Averaged spectra of single Nile Red molecules at the live-cell plasma membrane and at the nanoscale organelle membranes, versus that at SLBs of different compositions. (e) SR-SMLM image of a Nile Red-labeled live PtK2 cell. Color presents single-molecule spectral mean. (f) SR-SMLM image of Nile Red-labeled α-synuclein aggregates after 1 h (left) and 48 h (right) incubation. (g) SR-SMLM image of fluorescent defects in a flake of hexagonal boron nitride, colored by emission wavelength. (h) Distribution of center emission wavelengths for individual defects in (g). (a–e) are from ref. (f) is from ref. (g,h) is from ref.
Figure 4.
Figure 4.
From single-molecule motion to nanoscale diffusivity mapping. (a) High-density single-molecule tracking in a live COS-7 cell via photoactivation of the Eos FP tagged to the membrane protein VSVG. Each color indicates a different single-molecule trajectory. Inset: mean-squared displacement as a function of time lag for two trajectories of Gag and VSVG. (b) High-density single-molecule tracking of GPI-GFP in the plasma membrane of a live COS-7 cell through the in situ binding of anti-GFP-AT647Ns. (c) High-density single-molecule tracking of the lipophilic dye DiI in the plasma membrane of a live neuron. Color presents the fitted diffusion coefficients D for each molecule. (d) Detecting the transient displacements of single molecules by applying a pair of closely timed stroboscopic excitation pulses across two tandem camera frames. (e) Resultant images recorded in the two frames for two mEos3.2 FP molecules freely diffusing inside a living cell. Cyan and red crosses: positions of the two molecules in Frame 1 and Frame 2, respectively. (f) SMdM D map obtained from ~104 pairs of the above excitation pulses by binning the resultant single-molecule displacements onto 100×100 nm2 grids for local fitting to a diffusion model. (g) Zoom-in of the white box in (f). (h,i) Distribution of 1-ms single-molecule displacements for two adjacent 300 × 300-nm2 areas [orange and red boxes in (g)]. Blue curves: fits with resultant D values and uncertainties labeled. (a) is from ref. (b) is from ref. (c) is from ref. (d–i) are from ref.
Figure 5.
Figure 5.
Integration and combination of multidimensional single-molecule signals. (a,b) Integration of SR-SMLM (a; color for emission wavelength) and 3D-SMLM (b; color for axial depth z) for a fixed cell labeled by four spectrally overlapped dyes. (c) Vertical sections along the three dashed lines in (b). Here each molecule is categorized as one of the four dyes and accordingly recolored. (d) Concurrent detections of orientation (arrows) and emission wavelength (color) for single quantum rods in the wide field. (e) Three complementary views are obtained for single quantum rods: two for polarization directions plus 3D localizations (left two panels) and one for spectra in the wide field (right). (f,g) Concurrent SMdM (f; color for diffusivity D) and SR-SMLM (g; color for emission wavelength) for Nile Red in cellular membranes, showing reduced D but unchanged emission wavelength at endoplasmic reticulum-plasma membrane contact sites (arrows). (h,i) Correlated SMdM (colored for D) of the mEos3.2 FP in the nucleus of a mammalian cell (h) and SMLM of the same cell with a DNA stain (i). Asterisk: reduced D in the nucleolus. Red and orange arrows: highest and lowest D in the SMdM image, coinciding with regions devoid of DNA and of high local DNA density in the SMLM image, respectively. (a–c) are from ref. (d,e) are from ref. (f,g) are from ref. (h,i) are from ref.
Figure 6.
Figure 6.
Rising opportunities. (a) Improving single-molecule localization via modulating the illumination pattern. (b) In one implementation, the wide-field image is fast scanned between six recording positions, so that six images under different synchronized illumination patterns are concurrently recorded in every frame. (c) Lifetime-resolved SMLM image of two beads labeled by two different dyes, obtained using a confocal setup. (d) Histograms of photon arrival time for two single molecules in (c). Blue lines: exponential fits. (e) Wide-field fluorescence images of single Alexa Fluor 532 molecules, with (top) and without (bottom) gating at 1.6 ns with a Pockels cell. (f) Brightness vs. the estimated lifetime for the molecules numbered in (e), based on the relative intensities in the two views. (g) Wide-field fluorescence images of single C-SNARF-1 molecules in an aluminosilicate film in 580 (top) and 640 (bottom) nm emission channels. (h) Emission ratio image for identified single molecules. (i) SMdM diffusivity map obtained using the non-switchable FP mEmerald. Inset: Distribution of 1-ms single-molecule displacements for a typical region. (j) A convolutional neural network (CNN) receives a raw image of overlapping complex PSFs and outputs a 3D high-resolution volume. (a) is from ref. (b) is from ref. (c,d) are from ref. (e,f) are from ref. (g,h) are from ref. (i) is from ref. (j) is from ref.

Similar articles

Cited by

References

    1. Dempster AJ; Batho HF Light quanta and interference. Phys. Rev 1927, 30, 644–648.
    1. Aspden RS; Padgett MJ; Spalding GC Video recording true single-photon double-slit interference. Am. J. Phys 2016, 84, 671–677.
    1. Rust MJ; Bates M; Zhuang X Sub-diffraction-limit imaging by stochastic optical reconstruction microscopy (STORM). Nat. Methods 2006, 3, 793–795. - PMC - PubMed
    1. Betzig E; Patterson GH; Sougrat R; Lindwasser OW; Olenych S; Bonifacino JS; Davidson MW; Lippincott-Schwartz J; Hess HF Imaging intracellular fluorescent proteins at nanometer resolution. Science 2006, 313, 1642–1645. - PubMed
    1. Hess ST; Girirajan TPK; Mason MD Ultra-high resolution imaging by fluorescence photoactivation localization microscopy. Biophys. J 2006, 91, 4258–4272. - PMC - PubMed

Publication types

MeSH terms