

A Comparison of Ten Polygenic Score Methods for Psychiatric Disorders Applied Across Multiple Cohorts
- PMID: 34304866
- PMCID: PMC8500913
- DOI: 10.1016/j.biopsych.2021.04.018
A Comparison of Ten Polygenic Score Methods for Psychiatric Disorders Applied Across Multiple Cohorts
Abstract
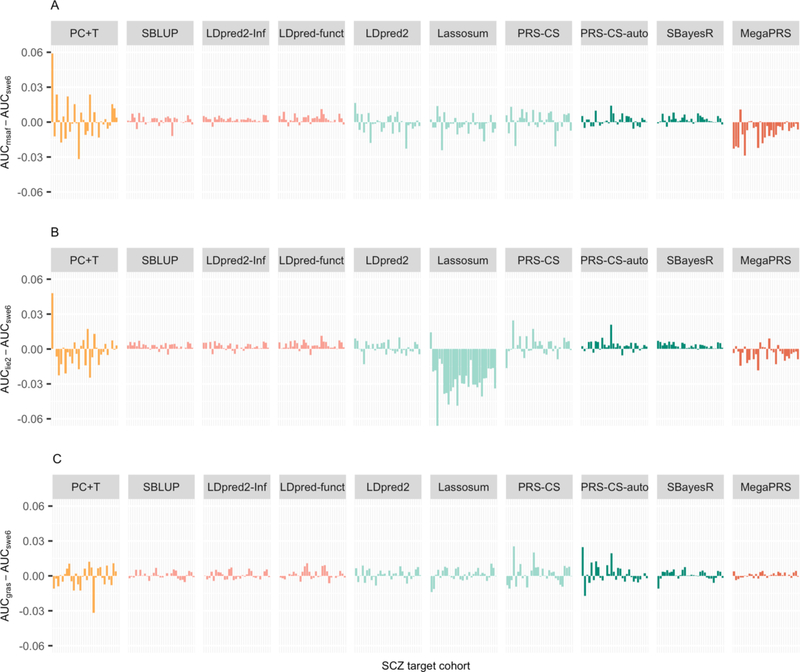
Background: Polygenic scores (PGSs), which assess the genetic risk of individuals for a disease, are calculated as a weighted count of risk alleles identified in genome-wide association studies. PGS methods differ in which DNA variants are included and the weights assigned to them; some require an independent tuning sample to help inform these choices. PGSs are evaluated in independent target cohorts with known disease status. Variability between target cohorts is observed in applications to real data sets, which could reflect a number of factors, e.g., phenotype definition or technical factors.
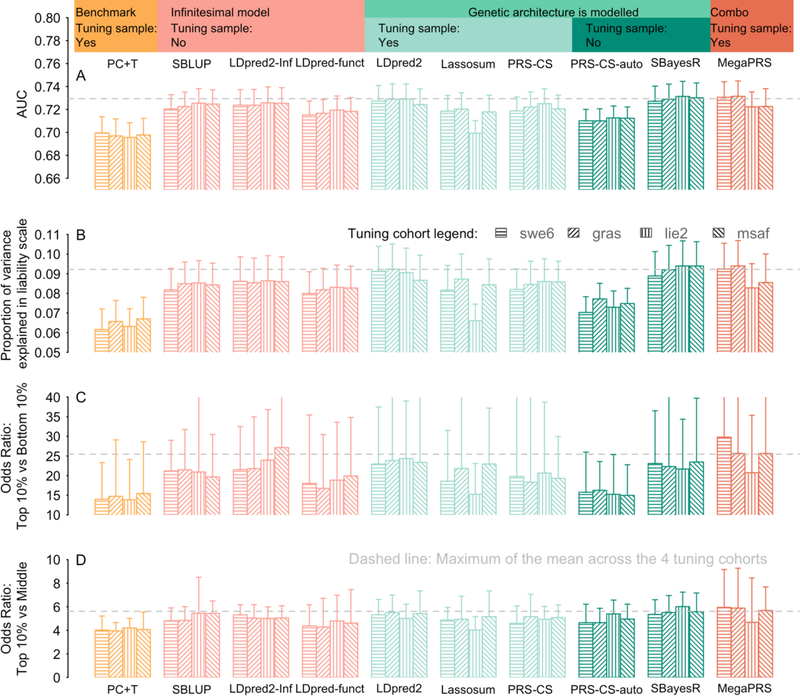
Methods: The Psychiatric Genomics Consortium Working Groups for schizophrenia and major depressive disorder bring together many independently collected case-control cohorts. We used these resources (31,328 schizophrenia cases, 41,191 controls; 248,750 major depressive disorder cases, 563,184 controls) in repeated application of leave-one-cohort-out meta-analyses, each used to calculate and evaluate PGS in the left-out (target) cohort. Ten PGS methods (the baseline PC+T method and 9 methods that model genetic architecture more formally: SBLUP, LDpred2-Inf, LDpred-funct, LDpred2, Lassosum, PRS-CS, PRS-CS-auto, SBayesR, MegaPRS) were compared.
Results: Compared with PC+T, the other 9 methods gave higher prediction statistics, MegaPRS, LDPred2, and SBayesR significantly so, explaining up to 9.2% variance in liability for schizophrenia across 30 target cohorts, an increase of 44%. For major depressive disorder across 26 target cohorts, these statistics were 3.5% and 59%, respectively.
Conclusions: Although the methods that more formally model genetic architecture have similar performance, MegaPRS, LDpred2, and SBayesR rank highest in most comparisons and are recommended in applications to psychiatric disorders.
Keywords: LDpred2; Lassosum; Major depressive disorder; MegaPRS; PRS-CS; Polygenic scores; Psychiatric disorders; Risk prediction; SBayesR; Schizophrenia.
Copyright © 2021 Society of Biological Psychiatry. Published by Elsevier Inc. All rights reserved.
Conflict of interest statement
The authors declare no competing interests.
Figures
Comment in
-
Polygenic Scores for Psychiatric Disorders: One Important Piece of the Risk Prediction Puzzle.Biol Psychiatry. 2021 Nov 1;90(9):e41-e42. doi: 10.1016/j.biopsych.2021.08.016. Biol Psychiatry. 2021. PMID: 34620379 No abstract available.
References
-
- Wray NR, Lin T, Austin J, McGrath JJ, Hickie IB, Murray GK, et al. (2021): From basic science to clinical application of polygenic risk scores: A primer. JAMA psychiatry. 78:101–109. - PubMed
Publication types
MeSH terms
Grants and funding
- R01 MH061675/MH/NIMH NIH HHS/United States
- R00 AG054573/AG/NIA NIH HHS/United States
- R01 CA133996/CA/NCI NIH HHS/United States
- U01 MH046276/MH/NIMH NIH HHS/United States
- K99 AG054573/AG/NIA NIH HHS/United States
- R01 MH067257/MH/NIMH NIH HHS/United States
- U01 MH079470/MH/NIMH NIH HHS/United States
- R01 MH059587/MH/NIMH NIH HHS/United States
- R01 MH085548/MH/NIMH NIH HHS/United States
- R01 MH059586/MH/NIMH NIH HHS/United States
- P50 CA093459/CA/NCI NIH HHS/United States
- U01 MH109528/MH/NIMH NIH HHS/United States
- R01 MH060879/MH/NIMH NIH HHS/United States
- P50 CA097007/CA/NCI NIH HHS/United States
- R01 MH104964/MH/NIMH NIH HHS/United States
- R01 ES011740/ES/NIEHS NIH HHS/United States
- U01 MH079469/MH/NIMH NIH HHS/United States
- R01 MH060870/MH/NIMH NIH HHS/United States
- R01 MH081800/MH/NIMH NIH HHS/United States
- R01 MH059571/MH/NIMH NIH HHS/United States
- G0200243/MRC_/Medical Research Council/United Kingdom
- R01 MH059565/MH/NIMH NIH HHS/United States
- R01 MH123451/MH/NIMH NIH HHS/United States
- U01 MH046289/MH/NIMH NIH HHS/United States
- R01 MH124871/MH/NIMH NIH HHS/United States
- G0901310/MRC_/Medical Research Council/United Kingdom
- U01 MH109532/MH/NIMH NIH HHS/United States
- R01 MH059566/MH/NIMH NIH HHS/United States
- WT_/Wellcome Trust/United Kingdom
- R01 MH059588/MH/NIMH NIH HHS/United States
- U01 MH046318/MH/NIMH NIH HHS/United States
LinkOut - more resources
Full Text Sources
Medical
