

Anosmia, ageusia, and other COVID-19-like symptoms in association with a positive SARS-CoV-2 test, across six national digital surveillance platforms: an observational study
- PMID: 34305035
- PMCID: PMC8297994
- DOI: 10.1016/S2589-7500(21)00115-1
Anosmia, ageusia, and other COVID-19-like symptoms in association with a positive SARS-CoV-2 test, across six national digital surveillance platforms: an observational study
Erratum in
-
Correction to Lancet Digit Health 2021; 3: e577-86.Lancet Digit Health. 2021 Sep;3(9):e542. doi: 10.1016/S2589-7500(21)00181-3. Lancet Digit Health. 2021. PMID: 34446264 Free PMC article. No abstract available.
Abstract
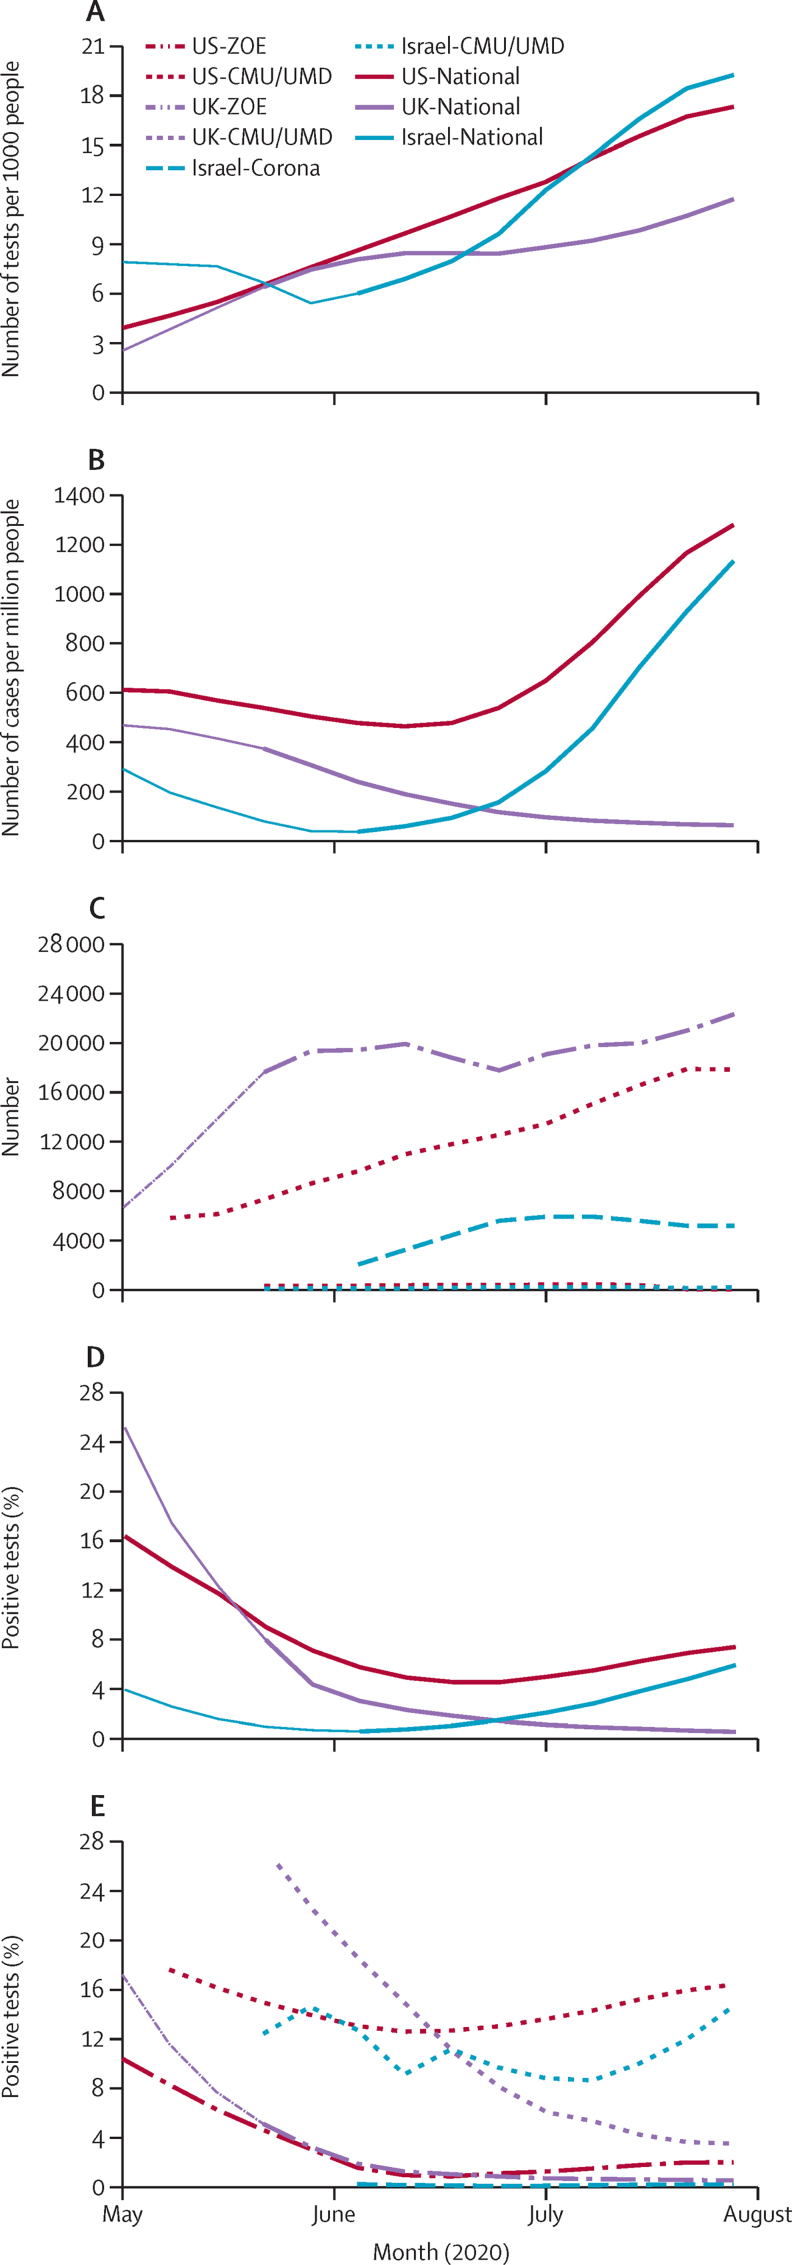
Background: Multiple voluntary surveillance platforms were developed across the world in response to the COVID-19 pandemic, providing a real-time understanding of population-based COVID-19 epidemiology. During this time, testing criteria broadened and health-care policies matured. We aimed to test whether there were consistent associations of symptoms with SARS-CoV-2 test status across three surveillance platforms in three countries (two platforms per country), during periods of testing and policy changes.
Methods: For this observational study, we used data of observations from three volunteer COVID-19 digital surveillance platforms (Carnegie Mellon University and University of Maryland Facebook COVID-19 Symptom Survey, ZOE COVID Symptom Study app, and the Corona Israel study) targeting communities in three countries (Israel, the UK, and the USA; two platforms per country). The study population included adult respondents (age 18-100 years at baseline) who were not health-care workers. We did logistic regression of self-reported symptoms on self-reported SARS-CoV-2 test status (positive or negative), adjusted for age and sex, in each of the study cohorts. We compared odds ratios (ORs) across platforms and countries, and we did meta-analyses assuming a random effects model. We also evaluated testing policy changes, COVID-19 incidence, and time scales of duration of symptoms and symptom-to-test time.
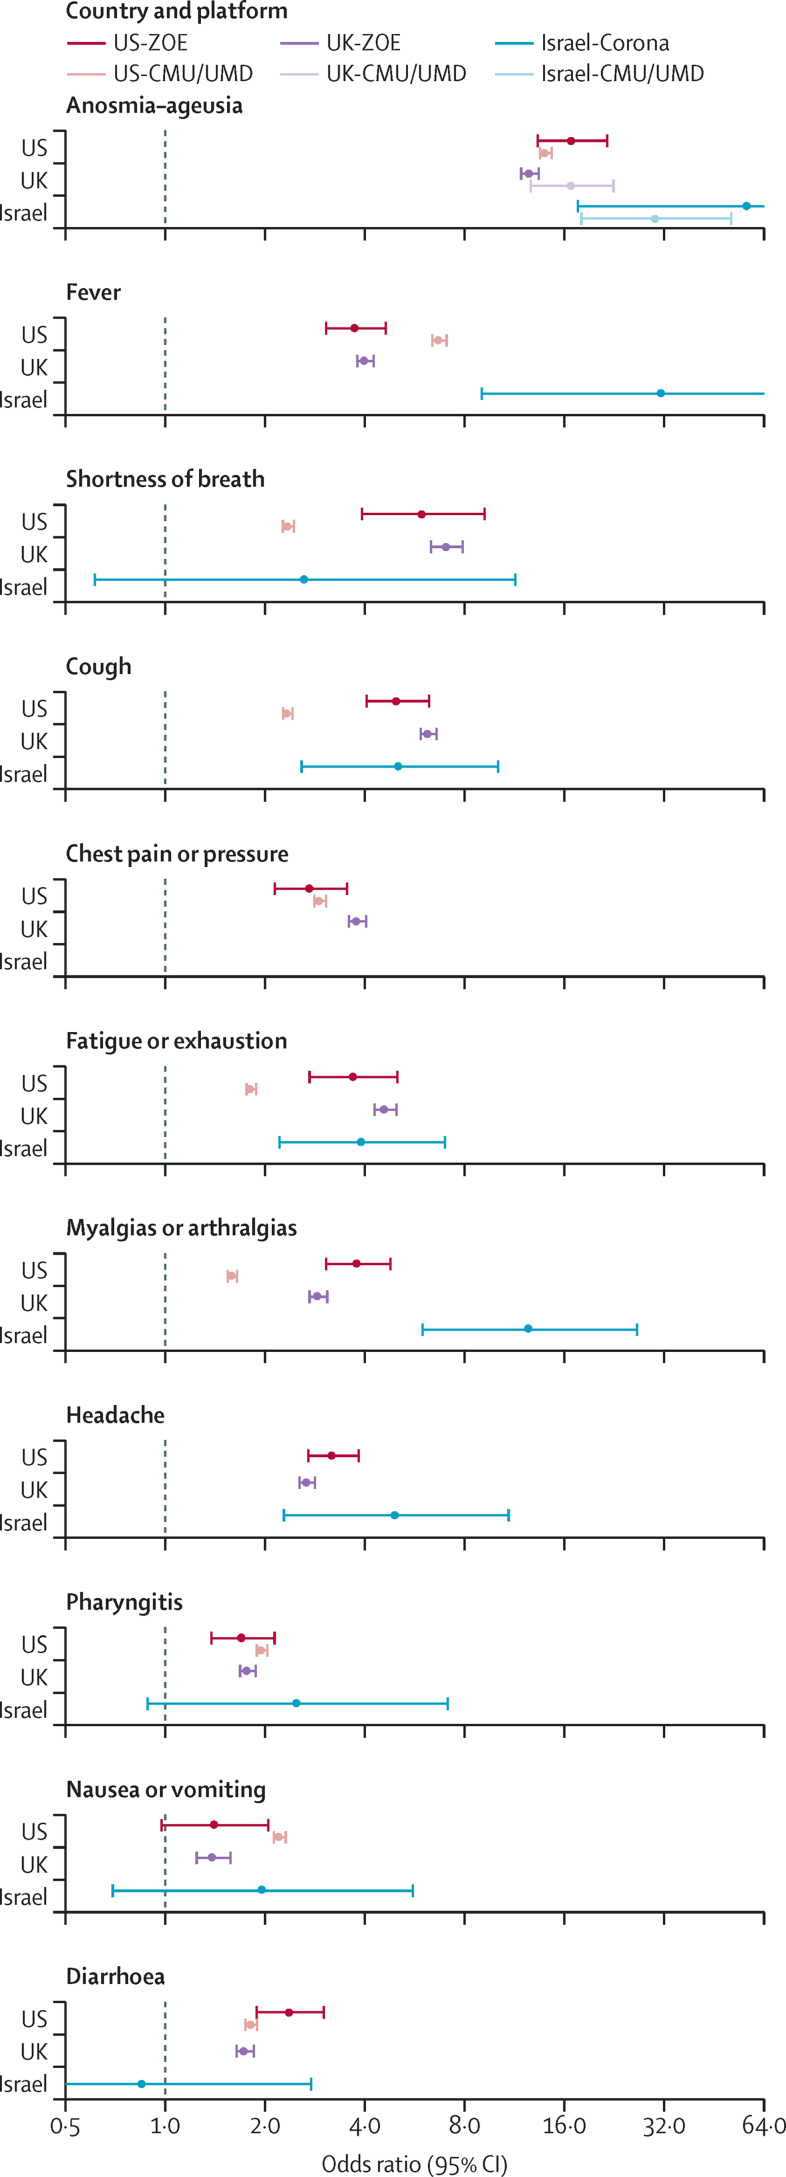
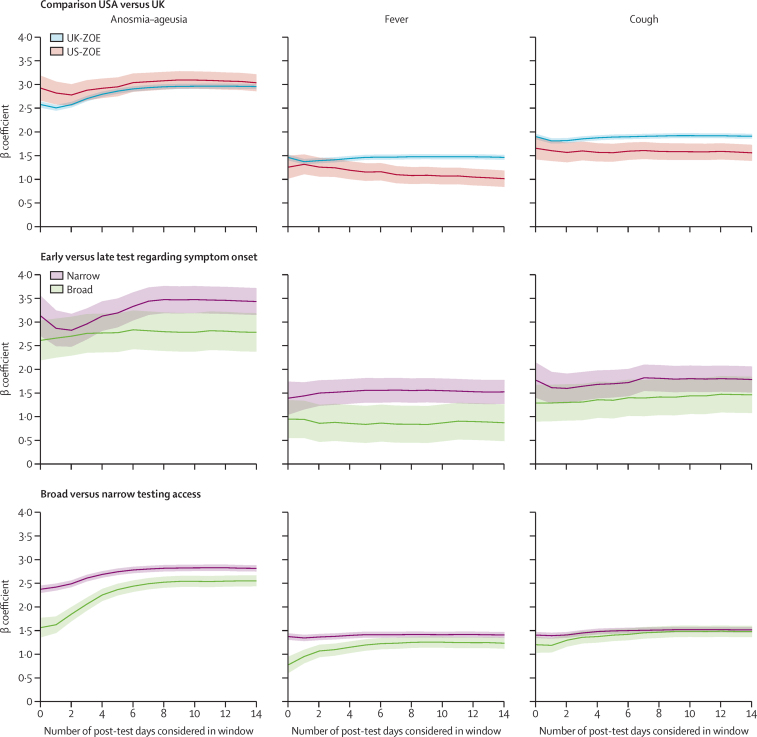
Findings: Between April 1 and July 31, 2020, 514 459 tests from over 10 million respondents were recorded in the six surveillance platform datasets. Anosmia-ageusia was the strongest, most consistent symptom associated with a positive COVID-19 test (robust aggregated rank one, meta-analysed random effects OR 16·96, 95% CI 13·13-21·92). Fever (rank two, 6·45, 4·25-9·81), shortness of breath (rank three, 4·69, 3·14-7·01), and cough (rank four, 4·29, 3·13-5·88) were also highly associated with test positivity. The association of symptoms with test status varied by duration of illness, timing of the test, and broader test criteria, as well as over time, by country, and by platform.
Interpretation: The strong association of anosmia-ageusia with self-reported positive SARS-CoV-2 test was consistently observed, supporting its validity as a reliable COVID-19 signal, regardless of the participatory surveillance platform, country, phase of illness, or testing policy. These findings show that associations between COVID-19 symptoms and test positivity ranked similarly in a wide range of scenarios. Anosmia, fever, and respiratory symptoms consistently had the strongest effect estimates and were the most appropriate empirical signals for symptom-based public health surveillance in areas with insufficient testing or benchmarking capacity. Collaborative syndromic surveillance could enhance real-time epidemiological investigations and public health utility globally.
Funding: National Institutes of Health, National Institute for Health Research, Alzheimer's Society, Wellcome Trust, and Massachusetts Consortium on Pathogen Readiness.
Copyright © 2021 The Author(s). Published by Elsevier Ltd. This is an Open Access article under the CC BY 4.0 license. Published by Elsevier Ltd.. All rights reserved.
Conflict of interest statement
Declaration of interests ZOE Global codeveloped the app pro bono for non-commercial purposes. JW, JCP, and SG work for ZOE Global, and TDS is a consultant for ZOE Global. LHN, DAD, and ATC previously participated as investigators on a diet study unrelated to this work, which was supported by ZOE Global. ATC reports personal fees from Pfizer, Bayer Pharma, and Boehringer Ingelheim, outside the submitted work. All other authors declare no competing interests.
Figures
References
-
- Barkay N, Cobb C, Eilat R. Weights and methodology brief for the COVID-19 Symptom Survey by University of Maryland and Carnegie Mellon University, in partnership with Facebook. arXiv. 2020 http://arxiv.org/abs/2009.14675 published online Sept 25 [version 1]. (preprint).
Publication types
MeSH terms
Grants and funding
LinkOut - more resources
Full Text Sources
Medical
Miscellaneous
