. 2021 Jul 8:14:699562.
doi: 10.3389/fnmol.2021.699562. eCollection 2021.

Spatial RNA Sequencing Identifies Robust Markers of Vulnerable and Resistant Human Midbrain Dopamine Neurons and Their Expression in Parkinson's Disease

Affiliations

Spatial RNA Sequencing Identifies Robust Markers of Vulnerable and Resistant Human Midbrain Dopamine Neurons and Their Expression in Parkinson's Disease

Julio Aguila et al. Front Mol Neurosci. .

Abstract

Defining transcriptional profiles of substantia nigra pars compacta (SNc) and ventral tegmental area (VTA) dopamine neurons is critical to understanding their differential vulnerability in Parkinson's Disease (PD). Here, we determine transcriptomes of human SNc and VTA dopamine neurons using LCM-seq on a large sample cohort. We apply a bootstrapping strategy as sample input to DESeq2 and identify 33 stably differentially expressed genes (DEGs) between these two subpopulations. We also compute a minimal sample size for identification of stable DEGs, which highlights why previous reported profiles from small sample sizes display extensive variability. Network analysis reveal gene interactions unique to each subpopulation and highlight differences in regulation of mitochondrial stability, apoptosis, neuronal survival, cytoskeleton regulation, extracellular matrix modulation as well as synapse integrity, which could explain the relative resilience of VTA dopamine neurons. Analysis of PD tissues showed that while identified stable DEGs can distinguish the subpopulations also in disease, the SNc markers SLIT1 and ATP2A3 were down-regulated and thus appears to be biomarkers of disease. In summary, our study identifies human SNc and VTA marker profiles, which will be instrumental for studies aiming to modulate dopamine neuron resilience and to validate cell identity of stem cell-derived dopamine neurons.

Keywords: Parkinson’s disease; RNA sequencing; human midbrain dopamine neurons; laser microdissection; spatial transcriptomics; substantia nigra compacta; ventral tegmental area.


Conflict of interest statement

The authors declare that the research was conducted in the absence of any commercial or financial relationships that could be construed as a potential conflict of interest.

Figures

FIGURE 1
FIGURE 1
Gene signature of human adult midbrain dopamine neurons using the spatial sequencing method LCM-seq. (A) The high sample quality for the 18 male subjects profiled in this study was confirmed by strong expression of the midbrain dopamine neuron markers EN1/2, FOXA2, LMX1B, PITX3, NR4A2, TH, and SLC6A3 (DAT), the pan-neuronal marker neurofilament (NEFH), and the lack of astrocyte, microglia or oligodendrocyte precursor marker (Yu et al., 2007) contamination. (B) Hierarchical clustering analysis of samples from the current study using the 74 DEGs identified by DESeq2. (C) The 74 DEGs also separated SNc and VTA samples from Nichterwitz et al. (2018) (3 female subjects). (D) Venn-diagram showing the relatively low degree of overlap between DEGs in the cohorts of different sizes (see also Supplementary Figure 2).
FIGURE 2
FIGURE 2
Bootstrapping analysis coupled with DESeq2 identifies SNc or VTA stable genes from a cohort of 12 human subjects. (A) Histogram of DEG frequency through iterative bootstrapping. X-axis denotes increasing size of patient pool (i3–i11 individuals) at each iteration. Y-axis bar height denotes the number of DE genes, while bar color denotes the frequency those genes being DE in that iteration. Blue line denotes the decreasing number of novel genes detected across successive iterations. (B,C) DE frequency increases at each iterative sample size increase, for SNc (B) or VTA (C) stable genes. (D,E) Frequency histograms (ranked by p-value), output of the bootstrapping approach, extend the analysis of identified SNc and VTA stable genes. Genes with the highest frequency (at the top, in red) represent SNc (D) and VTA (E) stable genes. (F) Hierarchical clustering analysis using the 33 stable genes, faithfully segregates both SNc and VTA samples. (G,H) RNAscope staining and quantification for the stable genes SEZ6 (G, p = 0.025) and CDH13 (H, p = 0.005) enriched in the SNc and VTA, respectively (n = 5 subjects, data represented as mean ± SEM, Paired t-test). Scale bars 30 μm (15 μm for insets). p < 0.025 and ∗∗p < 0.005.
FIGURE 3
FIGURE 3
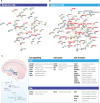
STRING analysis of DEGs between SNc and VTA identifies novel networks for the two midbrain dopamine neuron subpopulations. The two STRING networks are based on 23 DE genes highly expressed in SNc (A) and 51 DE genes highly expressed in VTA (B). Different color edges represent the interactions by curated databases, experiment or prediction. The nodes of the two networks are grouped using dash line by using MCL clustering, in which the nodes with solid edges are from sub-networks. (C) The activity of the DEGs present in the SNc and VTA networks highlight both possible beneficial functions as well as functions that could render neurons susceptible, which were predominant in the resilient versus vulnerable dopamine neuron subpopulations. Proposed enriched functions include e.g., neuronal survival, regulation of mitochondrial stability, catabolism of dopamine, regulation of resting membrane potential, extracellular matrix modulation and regulation of cytoskeleton and synapse integrity, G protein signaling and calcium uptake.
FIGURE 4
FIGURE 4
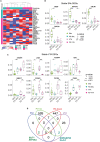
The stable DEGs identified in control tissue separates SNc and VTA from Parkinson’s disease patients. (A) The stable DE genes hierarchically separate SNc and VTA from both normal and Parkinson’s disease (PD) patients. (B,C) The differential expressions of stable DE genes between normal and PD patients in SNc and VTA are shown. (D) Venn diagram finds two common genes, SLIT1 and ATP2A3, between SNc stable and down-regulated genes in PD SNc. p < 0.05, ∗∗p < 0.05, ∗∗∗p < 0.05.

References

    1. Alavian K. N., Sgado P., Alberi L., Subramaniam S., Simon H. H. (2009). Elevated P75NTR expression causes death of engrailed-deficient midbrain dopaminergic neurons by Erk1/2 suppression. Neural Dev. 4:11. 10.1186/1749-8104-4-11 - DOI - PMC - PubMed
    1. Alvarez-Fischer D., Fuchs J., Castagner F., Stettler O., Massiani-Beaudoin O., Moya K. L., et al. (2011). Engrailed protects mouse midbrain dopaminergic neurons against mitochondrial complex I insults. Nat. Neurosci. 14 1260–1266. 10.1038/nn.2916 - DOI - PubMed
    1. Ambalavanan A., Girard S. L., Ahn K., Zhou S., Dionne-Laporte A., Spiegelmann D., et al. (2016). De novo variants in sporadic cases of childhood onset schizophrenia. Eur. J. Hum. Genet. 24 944–948. 10.1038/ejhg.2015.218 - DOI - PMC - PubMed
    1. Barker R. A., Parmar M., Studer L., Takahashi J. (2017). Human trials of stem cell-derived dopamine neurons for Parkinson’s disease: dawn of a new era. Cell Stem Cell 21 569–573. 10.1016/j.stem.2017.09.014 - DOI - PubMed
    1. Bezprozvanny I. (2009). Calcium signalling and neurodegenerative diseases. Trends Mol. Med. 15 89–100. - PMC - PubMed