. 2021 Jul 9:12:656885.
doi: 10.3389/fimmu.2021.656885. eCollection 2021.

Global Transcriptomics Uncovers Distinct Contributions From Splicing Regulatory Proteins to the Macrophage Innate Immune Response

Affiliations

Global Transcriptomics Uncovers Distinct Contributions From Splicing Regulatory Proteins to the Macrophage Innate Immune Response

Allison R Wagner et al. Front Immunol. .

Abstract

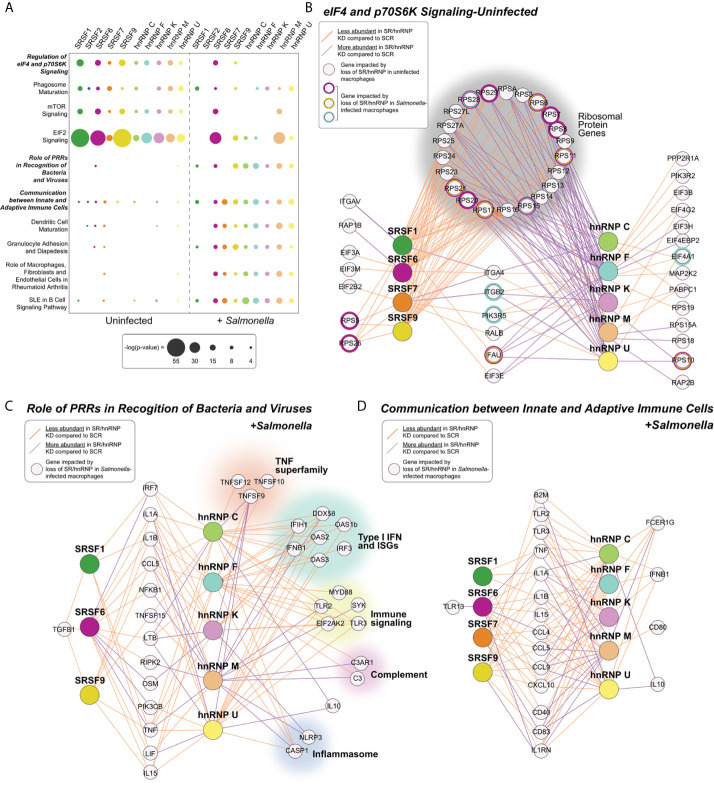
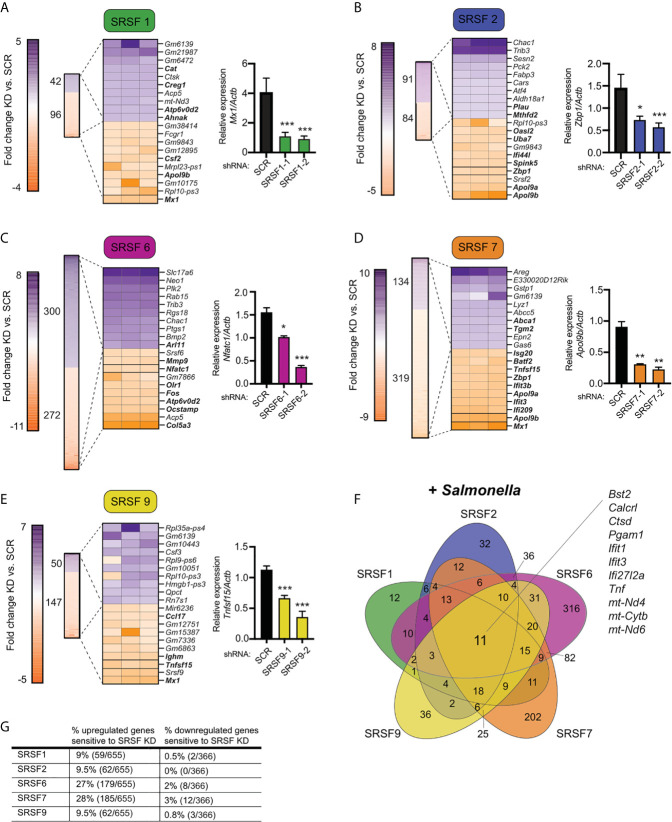
Pathogen sensing via pattern recognition receptors triggers massive reprogramming of macrophage gene expression. While the signaling cascades and transcription factors that activate these responses are well-known, the role of post-transcriptional RNA processing in modulating innate immune gene expression remains understudied. Given their crucial role in regulating pre-mRNA splicing and other RNA processing steps, we hypothesized that members of the SR/hnRNP protein families regulate innate immune gene expression in distinct ways. We analyzed steady state gene expression and alternatively spliced isoform production in ten SR/hnRNP knockdown RAW 264.7 macrophage-like cell lines following infection with the bacterial pathogen Salmonella enterica serovar Typhimurium (Salmonella). We identified thousands of transcripts whose abundance is increased or decreased by SR/hnRNP knockdown in macrophages. Notably, we observed that SR and hnRNP proteins influence expression of different genes in uninfected versus Salmonella-infected macrophages, suggesting functionalization of these proteins upon pathogen sensing. Likewise, we found that knockdown of SR/hnRNPs promoted differential isoform usage (DIU) for thousands of macrophage transcripts and that these alternative splicing changes were distinct in uninfected and Salmonella-infected macrophages. Finally, having observed a surprising degree of similarity between the differentially expressed genes (DEGs) and DIUs in hnRNP K and U knockdown macrophages, we found that hnRNP K and U knockdown macrophages are both more restrictive to Vesicular Stomatitis Virus (VSV), while hnRNP K knockdown macrophages are more permissive to Salmonella Typhimurium. Based on these findings, we conclude that many innate immune genes evolved to rely on one or more SR/hnRNPs to ensure the proper magnitude of their induction, supporting a model wherein pre-mRNA splicing is critical for regulating innate immune gene expression and controlling infection outcomes in macrophages ex vivo.

Keywords: RNA binding protein; SR protein; Salmonella Typhimurium; hnRNP; inflammation; pre-mRNA splicing.


Conflict of interest statement

The authors declare that the research was conducted in the absence of any commercial or financial relationships that could be construed as a potential conflict of interest.

Figures

Figure 1
Figure 1
RNA-Seq reveals distinct hnRNP- and SRSF-dependent regulons in uninfected and Salmonella-infected RAW 264.7 macrophages. (A) Knockdown efficiency for each SR and hnRNP factor as measured by RT-qPCR. Data is shown as hnRNP/SRSF expression, relative to Actb, compared to SCR control cells. Ratios are the mean of 3 biological replicates and error bars show standard deviation. (B) Schematic representation of transcription factor activation downstream of Salmonella Typhimurium sensing by TLR4. (C) (Top) Overlap of differentially expressed genes (DEGs) between uninfected and Salmonella-infected RAW 264.7 macrophages (4h post-infection; MOI = 10) via Venn Diagram. (Bottom) Heatmaps of up and down-regulated DEGs from uninfected macrophages (UN). The values of the same genes in Salmonella-infected macrophages are shown below, with “blank spots” indicating DEGs that are not significantly changed in Salmonella-infected SR/hnRNP knockdown cell lines (+SAL). Orange represents genes downregulated in knockdown vs. SCR; purple represents genes upregulated in knockdown vs. SCR (colorbar shown below). DEGs were defined as having a statistically significant fold-change relative to SCR; p<0.05. (D) Relative gene expression of Id2 over Actb in uninfected (UN) and Salmonella-infected (+SAL) SRSF1 and SRSF2 knockdown macrophage cell lines. (E) As in (D) but for Bnip3 expression in SRSF9 knockdown macrophages. (F) As in (D) but for Hpgd in hnRNP C and hnRNP U knockdown macrophages. For D-F RT-qPCRs, values are the mean of 3 biological replicates and error bars indicate standard deviation. *p < 0.05; **p < 0.01; ***p < 0.001; n.s, not statistically significant (p > 0.05). (B) was created using Biorender.
Figure 2
Figure 2
Pathways enriched for SR/hnRNP-dependent DEGs differ between uninfected and Salmonella-infected macrophages. (A) Canonical Ingenuity pathway analysis (IPA) of functional cellular pathways enriched for differentially expressed genes (DEGs) in uninfected (UN) and Salmonella-infected (+SAL) SR and hnRNP knockdown RAW 264.7 macrophages. Pathways enriched in eight or more knockdown cell lines in at least one condition are shown. Statistical enrichment is expressed as [-log (p-value)]. (B) Network diagrams showing DEGs from the IPA category “eIF4 and p70S6K Signaling” from each SR/hnRNP knockdown cell line in uninfected and Salmonella infected RAW 264.7 macrophages. Only SR/hnRNPs that showed DEG enrichment for the eIF4 pathway are shown. (C) As in (B) but for DEGs in Salmonella-infected SR/hnRNP knockdown cell lines in the IPA category “Role of Pattern Recognition Receptors in Recognition of Bacteria and Viruses.” (D) As in (B) but for the IPA category “Communication between Innate and Adaptive Immune Cells.” Purple lines connect SR or hnRNPs with target genes whose expression is upregulated in knockdown vs. SCR control macrophages. Orange lines connect SR or hnRNPs with target genes whose expression is downregulated in knockdown vs. SCR control macrophages. Cut-off for inclusion in the IPA was p < 0.05 for differential expression between knockdown and SCR cells.
Figure 3
Figure 3
Knockdown of SR family members causes both up- and down-regulation of gene expression in Salmonella-infected macrophages. (A) On left, heatmap represents all up- and down-regulated genes in SRSF1 knockdown RAW 264.7 macrophages relative to SCR control at 4h post-Salmonella infection (p<0.05). Numbers next to heatmap indicate the total number of up- (purple) or down- (orange) regulated genes in SRSF1 knockdown cell lines vs. SCR. Zoom in represents the top 10 up- and down-regulated genes. Genes whose expression is up- or down-regulated by virtue of Salmonella-infection itself (i.e. innate immune regulated genes) according to analysis of Salmonella-infected SCR vs. uninfected SCR cells are bolded. Box indicates gene chosen for RT-qPCR validation. On right, RT-qPCR validation of a representative DEG (Mx1) in two SRSF1 knockdown cell lines vs. SCR control cells (data shown relative to Actb). (B) As in (A) but for SRSF2; RT-qPCR of Zbp1. (C) As in (A) but for SRSF6; RT-qPCR of Nfatc1; (D) As in (A) but for SRSF7; RT-qPCR of Apol9b; (E) As in (A) but for SRSF9; RT-qPCR of Tnfsf15. (F) Venn diagram of DEGs common to one or more SR knockdown cell line (p<0.05). The 11 genes whose expression is impacted by loss of all five SRSF proteins are highlighted. (G) Percentage of all genes induced at 4h post-Salmonella infection (>2.0-fold) that are differentially expressed in each SRSF knockdown macrophage cell line (p<0.05). For all RT-qPCRs, values are the mean of 2 or 3 biological replicates and error bars indicate standard deviation. *p < 0.05; **p < 0.01; ***p < 0.001.
Figure 4
Figure 4
Knockdown of hnRNP family members causes up- and down-regulation of gene expression in Salmonella-infected macrophages. (A) On left, heatmap represents all up- and down-regulated genes in hnRNP C knockdown macrophages relative to SCR control at 4h post-Salmonella infection (p<0.05). Numbers next to heatmap indicate the total number of up- (purple) or down- (orange) regulated genes in hnRNP C knockdown cell lines vs. SCR. Zoom in represents the top 10 up- and down-regulated genes. Genes whose expression is up- or down-regulated by virtue of Salmonella-infection itself (i.e. innate immune regulated genes) according to analysis of Salmonella-infected SCR vs. uninfected SCR cells are bolded. Box indicates gene chosen for RT-qPCR validation. On right, RT-qPCR validation of a representative DEG (Nos2) in two knockdown cell lines vs. a SCR control (data shown relative to Actb). (B) As in (A) but for hnRNP F; RT-qPCR of Mx1. (C) As in (A) but for hnRNP K; RT-qPCR of Mx1. (D) As in (A) but for hnRNP M; RT-qPCR of Sema7; (E) As in (A) but for hnRNP U; RT-qPCR of Gbp2; (F) Venn diagram of DEGs common to one or more hnRNP knockdown cell line (p<0.05). A subset of the 104 genes whose expression was impacted by loss of all five hnRNP proteins are highlighted. (G) Percentage of all genes induced at 4h post-Salmonella infection (>2.0-fold) that are differentially expressed in each hnRNP knockdown macrophage cell line (p<0.05). For all RT-qPCRs values are the mean of 2 or 3 biological replicates and error bars indicate standard deviation. *p < 0.05; **p < 0.01; ***p < 0.001; ****p < 0.0001.
Figure 5
Figure 5
Local splicing variations are abundant in SR/hnRNP knockdown macrophages, but they do not preferentially occur in SR/hnRNP-dependent differentially expressed genes. (A) Quantitation of intron retention, exon skipping, alternative 3’ and 5’ splice site events in uninfected and Salmonella-infected SR and hnRNP knockdown macrophages (probability [∣delta PSI∣, ≥10%], >95%). PSI is defined as “Percent Spliced In” and indicates the abundance of a particular alternatively spliced isoform. ΔPSI indicates the abundance of an isoform in knockdown vs. SCR macrophage cell lines. (B) (left) VOILA output, based on RNA-seq reads, of affected exons in a representative gene (Senp7) in SRSF1 knockdown or SCR RAW 264.7 cells infected with Salmonella. (right) Violin plots depicting the ΔPSI of the SRSF1-dependent local splicing variations of Senp7. Violin plot colors correspond to the events depicted in the gene schematic on the left. (C) As in (B) but for SRSF2 and Nrb1. (D) As in (B) but for SRSF6 and CD37. (E) As in (B) but for SRSF7 and Wnk1. (F) As in (B) but for SRSF9 and E2f1. (G) As in (B) but for hnRNP C and Emsy. (H) As in (B) but for hnRNP F and Il2rg. (I) As in (B) but for hnRNP K and E2f1. (J) As in (B) but for hnRNP M and Unqln1. (K) As in (B) but for hnRNP U and Trim3.
Figure 6
Figure 6
Level of induction upon Salmonella infection, gene length, and number of introns/exons do not positively correlate with a gene’s reliance on SR/hnRNPs to maintain proper expression levels. (A) Heatmap of the top 100 genes induced at 4h post-Salmonella infection in SCR control RAW 264.7 macrophages. Data shown as fold change in SCR cells + Salmonella vs. SCR cells uninfected. (B) Heatmap of up- or down-regulation (fold change) of each induced gene conferred by hnRNP or SRSF knockdown. Purple genes are upregulated in SR/hnRNP knockdowns relative to SCR; Orange genes are downregulated in SR/hnRNP knockdowns. (C) RT-qPCR of Il1a abundance relative to Actb in Salmonella-infected SRSF and hnRNP knockdown macrophages (shown as fold change relative to uninfected for each cell line). (D) As in (C) but for Nos2. (E) As in (C) but for Mx1. (F) Scatter plot depicting correlation of the fold change of each DEG vs. coding sequence (CDS) length in Salmonella-infected hnRNP (top) and SRSF (bottom) knockdown macrophages. (G) as in (F) but comparison of DEG fold change vs. exon length. (H) As in (F) but comparison of DEG fold change vs. intron length. (I) As in (F) but comparison of DEG fold change vs. number of exons in a DEG. Genes included in analysis were differentially expressed (p < 0.05) in each knockdown compared to SCR controls. Y-axes were made all the same to facilitate comparison between multiple knockdown cell lines. For all RT-qPCRs values are the mean of 2 or 3 biological replicates and error bars indicate standard deviation. *p < 0.05; **p < 0.01; ***p < 0.001.
Figure 7
Figure 7
Many primary response and early induced innate immune genes are repressed by SR/hnRNPs. (A) Fold change of SR/hnRNP DEGs in Salmonella-infected RAW 264.7 macrophages compared to SCR controls for genes categorized as primary (top) and secondary (bottom) response genes according to . 35/53 primary response genes are upregulated by loss of one or more SR/hnRNPs at 4h post-Salmonella infection. (B) Fold change of SR/hnRNP DEGs in Salmonella-infected RAW 264.7 macrophages compared to SCR controls with Lipid A-induced genes categorized on basis of induction kinetics as defined by . Percentages on right indicate the number of genes in each category that are differentially expressed (up- or down-regulated) by loss of one or more SR/hnRNP. (left) Blue curves are schematic representations of the induction kinetics of each Group (A1, A2, B, C, D, E, and F) over a 120-minute time course following Lipid A treatment. Adapted from .
Figure 8
Figure 8
Loss of hnRNP K and hnRNP U affects similar DEGs and DIU and impacts the ability of RAW 264.7 macrophages to control viral replication. (A) Hierarchical clustering of up- and down-regulated DEGs in uninfected macrophages (SR/hnRNP knockdown vs. SCR). Zoom-ins of clusters of interest (1 and 2) are shown to the right. Correlation of Cluster 1 is 0.84; Cluster 2 is 0.76. To allow for better visualization of DEGs, the scale is set at -3 to +3. (B) IGV tracks showing RNA-seq reads for Irf7, Isg15, Ifi44l, and Apol9a in hnRNP K and hnRNP U compared to SCR control reads. Actb is included as a representative unaffected control gene. (C) RT-qPCR validation of Irf7 basal expression in hnRNP U and K knockdown cell lines vs. SCR controls. Data is displayed as Irf7/Actb. (D) As in (C) but for Isg15. (E) as in (C) but for Ifi44l. (F) as in (C) but for Trex1. (G) As in (A) but for Salmonella-infected macrophages. Correlation of Cluster 3 is 0.75; Cluster 4 is 0.78; Cluster 5 is 0.72. (H) Overlap of DIUs and DEGs in uninfected and Salmonella-infected hnRNP K and U knockdown macrophages. (I) Vesicular Stomatitis Virus (VSV) replication (as measured by RT-qPCR of the VSVM gene relative to Actb) in hnRNP K and hnRNP U knockdown macrophages compared to SCR controls (VSV MOI = 1) at 4, 8, and 12h post-infection. (J) as in (I) but for VSVG. For all RT-qPCRs, values are the mean of 3 biological replicates and error bars indicate standard deviation. *p < 0.05; **p < 0.01.
Figure 9
Figure 9
hnRNP K regulates Salmonella replication and controls alternative splicing of genes involved in RhoA/Rac1-mediated reorganization of the actin cytoskeleton. (A) Colony forming units represented as fold replication (20h time point relative to 2h time point) in hnRNP K and hnRNP U knockdown RAW 264.7 macrophages infected with Salmonella Typhimurium (MOI = 10) (B) Ingenuity Pathway Analysis of hnRNP K (top) and hnRNP U (bottom) knockdown macrophages at 4h post-Salmonella infection. Pathways shown are unique to hnRNP K or hnRNP U cells and enrichment is shown as -log(p-value). (C) Local splicing variations identified in three genes related to Cdc42-mediated reorganization of the actin cytoskeleton: Arhgap30, Arhgap1, and Baiap2. Color of splicing events in the gene schematic corresponds to the colors in the violin plots (showing EΔPSI). (D) Model of the potential mechanisms through which SR and hnRNP family members could impact innate immune gene expression in macrophages. For all RT-qPCRs values are the mean of 2 or 3 biological replicates and error bars indicate standard deviation.*p < 0.05; n.s. is not statistically significant.

Similar articles

Cited by

References

    1. Nathan C. Points of Control in Inflammation. Nature (2002) 420(6917):846–52. 10.1038/nature01320 - DOI - PubMed
    1. Foster SL, Medzhitov R. Gene-Specific Control of the TLR-induced Inflammatory Response. Clin Immunol (2009) 130(1):7–15. 10.1016/j.clim.2008.08.015 - DOI - PMC - PubMed
    1. Medzhitov R. Recognition of Microorganisms and Activation of the Immune Response. Nature (2007) 449(7164):819–26. 10.1038/nature06246 - DOI - PubMed
    1. Fowler T, Sen R, Roy AL. Regulation of Primary Response Genes. Mol Cell (2011) 44(3):348–60. 10.1016/j.molcel.2011.09.014 - DOI - PMC - PubMed
    1. Ahmed AU, Williams BR, Hannigan GE. Transcriptional Activation of Inflammatory Genes: Mechanistic Insight Into Selectivity and Diversity. Biomolecules (2015) 5(4):3087–111. 10.3390/biom5043087 - DOI - PMC - PubMed

Publication types

MeSH terms

Substances