. 2021 Jul 7:12:668623.
doi: 10.3389/fpls.2021.668623. eCollection 2021.

The Wild Sugarcane and Sorghum Kinomes: Insights Into Expansion, Diversification, and Expression Patterns

Affiliations

The Wild Sugarcane and Sorghum Kinomes: Insights Into Expansion, Diversification, and Expression Patterns

Alexandre Hild Aono et al. Front Plant Sci. .

Abstract

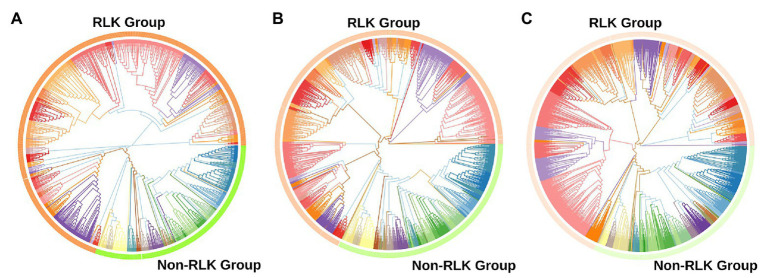
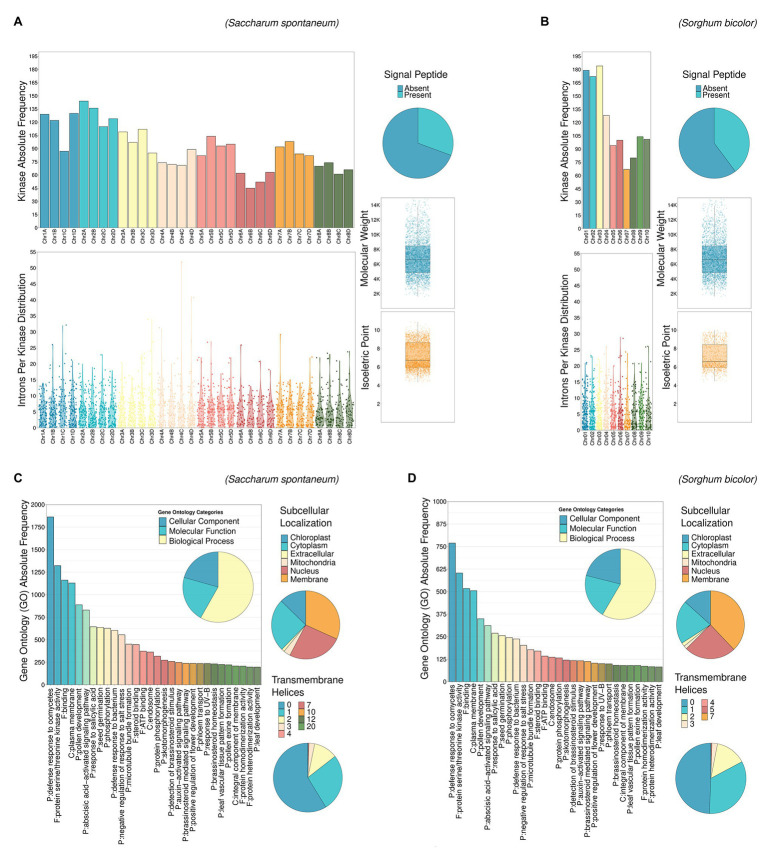
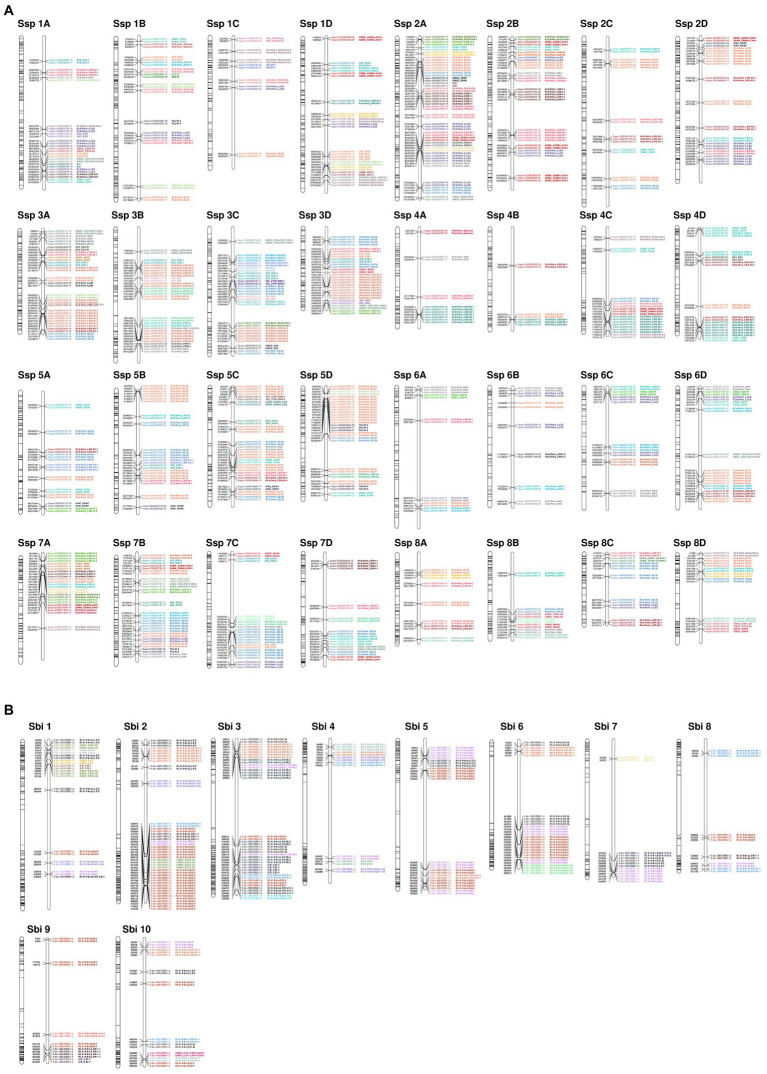
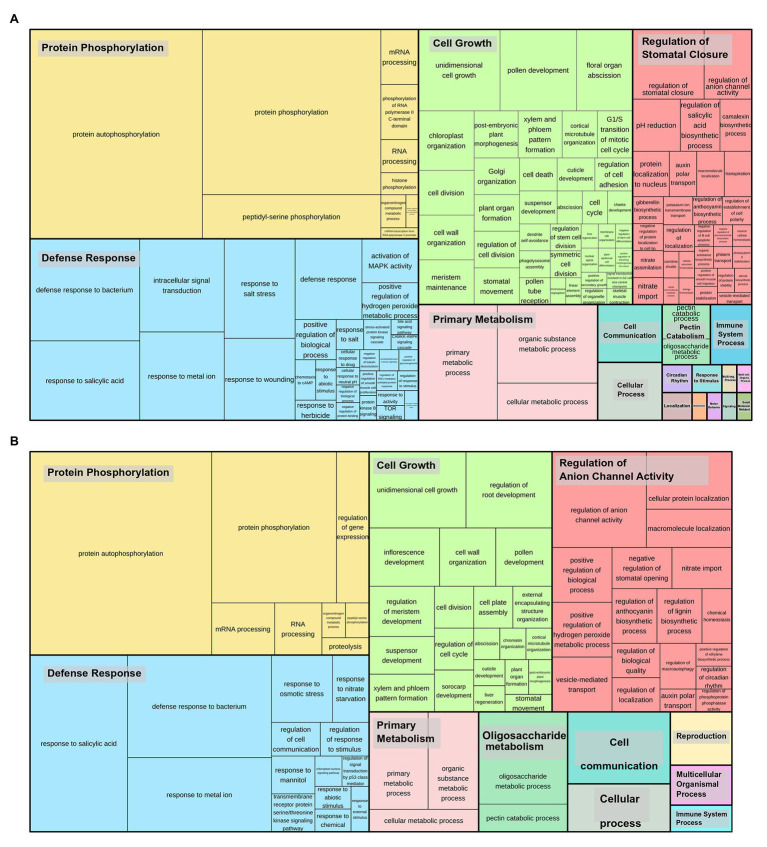
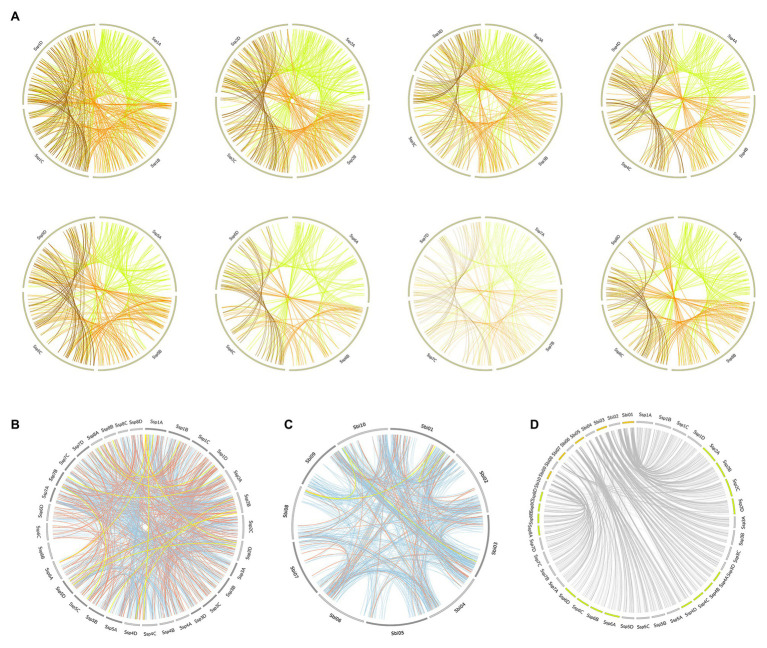
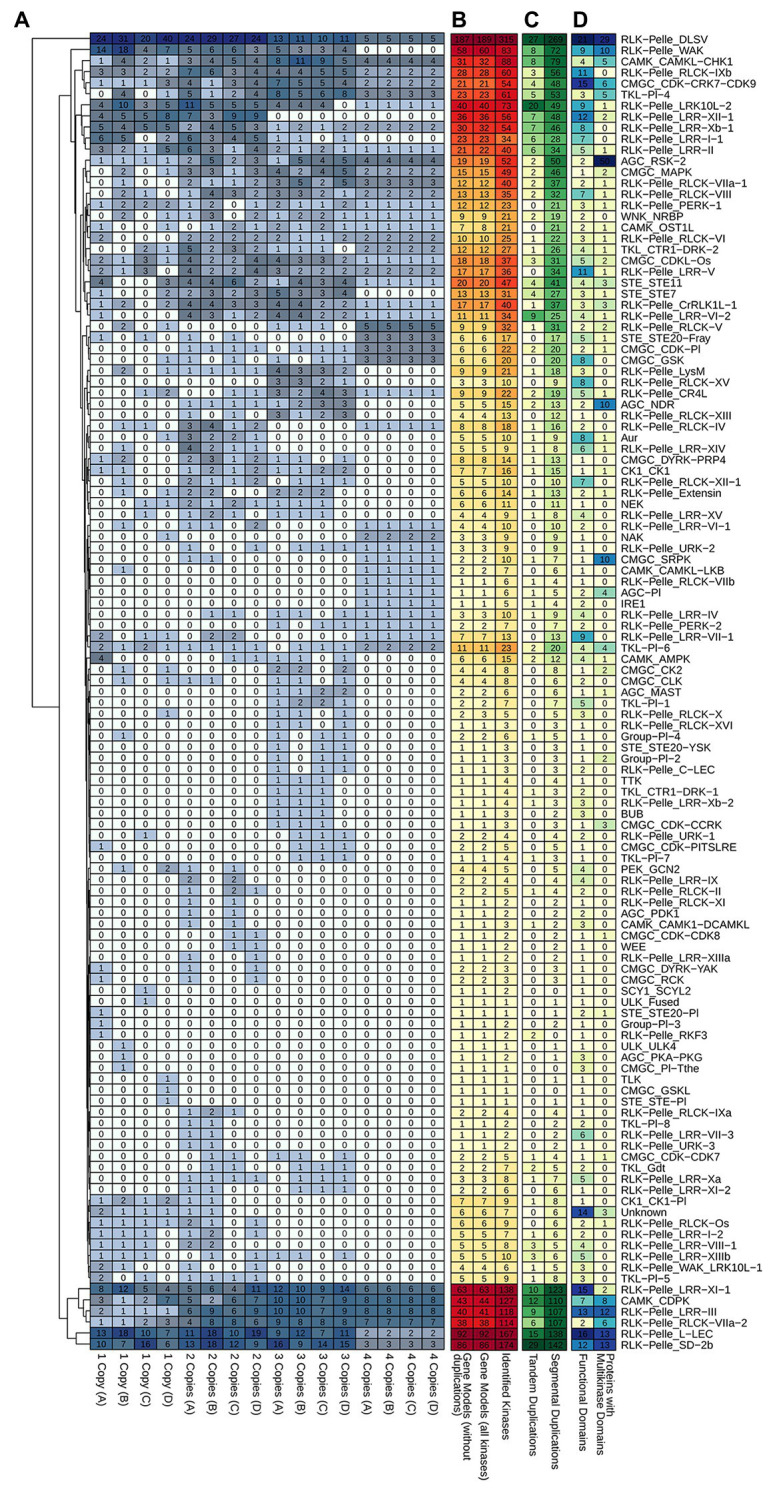
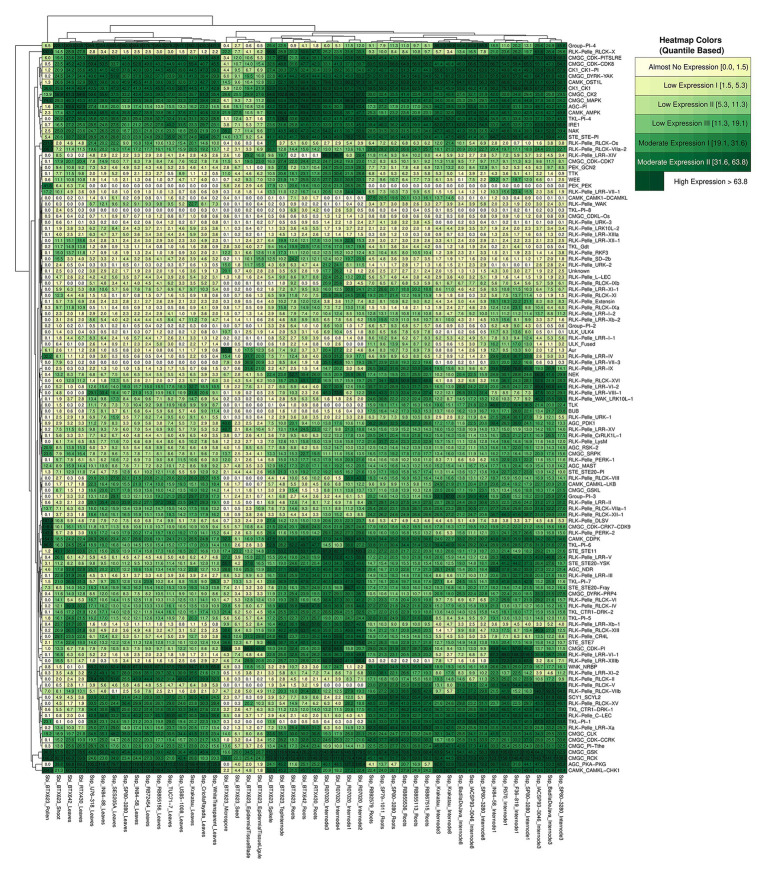
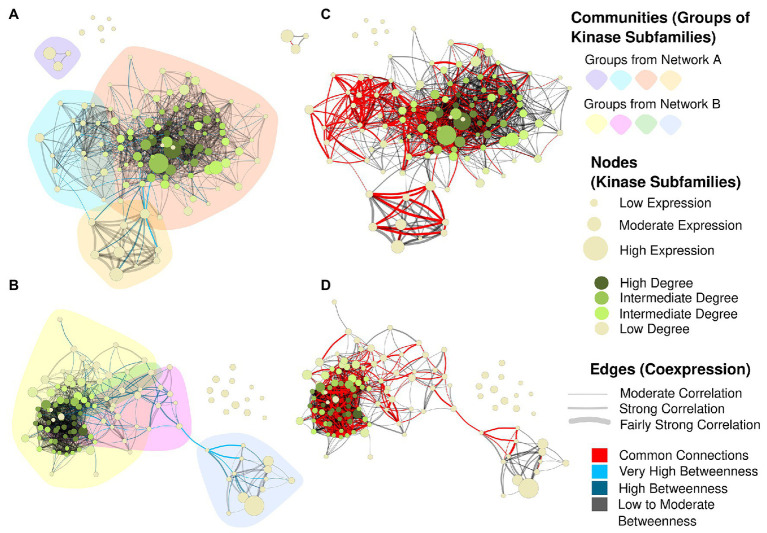
The protein kinase (PK) superfamily is one of the largest superfamilies in plants and the core regulator of cellular signaling. Despite this substantial importance, the kinomes of sugarcane and sorghum have not been profiled. Here, we identified and profiled the complete kinomes of the polyploid Saccharum spontaneum (Ssp) and Sorghum bicolor (Sbi), a close diploid relative. The Sbi kinome was composed of 1,210 PKs; for Ssp, we identified 2,919 PKs when disregarding duplications and allelic copies, and these were related to 1,345 representative gene models. The Ssp and Sbi PKs were grouped into 20 groups and 120 subfamilies and exhibited high compositional similarities and evolutionary divergences. By utilizing the collinearity between the species, this study offers insights into Sbi and Ssp speciation, PK differentiation and selection. We assessed the PK subfamily expression profiles via RNA-Seq and identified significant similarities between Sbi and Ssp. Moreover, coexpression networks allowed inference of a core structure of kinase interactions with specific key elements. This study provides the first categorization of the allelic specificity of a kinome and offers a wide reservoir of molecular and genetic information, thereby enhancing the understanding of Sbi and Ssp PK evolutionary history.

Keywords: RNA-Seq; Saccharum spontaneum; Sorghum bicolor; coexpression networks; kinase gene family; phylogenetic analyses.


Conflict of interest statement

The authors declare that the research was conducted in the absence of any commercial or financial relationships that could be construed as a potential conflict of interest.

Figures

Figure 1
Figure 1
Phylogenetic analyses of putative protein kinases (PKs) identified in the Saccharum spontaneum (Ssp) and Sorghum bicolor (Sbi) genomes. (A) Phylogenetic tree of the 1,210 Sbi PKs organized in 120 subfamilies represented by different colors. (B) Phylogenetic tree of the 2,919 Ssp PKs organized in 119 subfamilies. (C) Phylogenetic tree of PKs in both Sbi and Ssp.
Figure 2
Figure 2
Descriptive analysis of kinase characteristics in Ssp (A,C) and Sbi (B,D): chromosomal distribution, intron length and chromosomal occurrence, presence of signal peptides, molecular weights (MWs), isoelectric points (pIs), Gene Ontology (GO) terms, subcellular localization, and presence of transmembrane helices.
Figure 3
Figure 3
Kinase distribution along (A) S. spontaneum and (B) S. bicolor chromosomes. For each chromosome, all genes with kinase domains are indicated on the left, and only the tandemly organized kinases are indicated on the right, colored and labeled according to the subfamily classification.
Figure 4
Figure 4
Gene Ontology (GO) categories (biological processes) related to tandemly duplicated kinases in (A) S. spontaneum and (B) Sbi. The size of the subdivisions within the blocks represents the abundance of that category in this set of kinases. The colors are related to the similarity to a representative GO annotation for the group.
Figure 5
Figure 5
Segmental duplication events in the Ssp and Sbi genomes, divided into (A) Ssp duplications between alleles on the same chromosome, with the colors representing the origin of the duplication (green for allele A, orange for allele B, and brown for allele C). (B) Ssp duplications between chromosomes, excluding events between alleles on the same chromosome; and (C) Sbi duplications. The colors in (B,C) indicate the selection type of the gene pair duplication (orange indicates negative selection; light blue, positive selection; and yellow, neutral selection). (D) Representation of kinase correspondences between Sbi and Ssp., indicating the synteny relationships among these species.
Figure 6
Figure 6
Heatmap representations of kinase subfamily profiles in S. spontaneum related to (A) kinase copies among alleles. (B) Subfamily quantification considering the entire set of kinases and the respective quantity of gene models. (C) Tandem and segmental duplication events; and (D) the presence of different functional domains and multikinase domain-containing proteins within subfamilies.
Figure 7
Figure 7
RNA expression profiles of S. spontaneum and S. bicolor, shown on a heatmap indicating the average sample values of different combinations of genotypes and tissues (columns) and considering the organization of kinase subfamilies (rows).
Figure 8
Figure 8
Coexpression networks for Sbi and Ssp kinase subfamilies. Each node corresponds to a different subfamily, its size corresponds to the average expression value for all kinases within the subfamily in different samples, and its color corresponds to the hub score and ranges from beige to dark green. Each edge corresponds to a correlation with a Pearson correlation coefficient of at least 0.6. The correlation strength is represented by the edge’s width and the edge betweenness score is represented by the color (ranging from black to light blue, with light blue representing the highest values). (A) Sbi network with the background colored according to the community detection analysis. (B) Sbi network indicating the similarities with the Ssp network in red. (C) Ssp network with community structure information. (D) Ssp network indicating the similarities with the Sbi network in red.

References

    1. Ahuja I., de Vos R. C. H., Bones A. M., Hall R. D. (2010). Plant molecular stress responses face climate change. Trends Plant Sci. 15, 664–674. 10.1016/j.tplants.2010.08.002, PMID: - DOI - PubMed
    1. Andrews S. (2010). FastQC: a quality control tool for high throughput sequence data. Available at: http://www.bioinformatics.babraham.ac.uk/projects/fastqc (Accessed March 26, 2021).
    1. Ashburner M., Ball C. A., Blake J. A., Botstein D., Butler H., Cherry J. M., et al. . (2000). Gene ontology: tool for the unification of biology. Nat. Genet. 25, 25–29. 10.1038/75556, PMID: - DOI - PMC - PubMed
    1. Azuaje F. J. (2014). Selecting biologically informative genes in co-expression networks with a centrality score. Biol. Direct 9:12. 10.1186/1745-6150-9-12, PMID: - DOI - PMC - PubMed
    1. Bairoch A., Apweiler R. (2000). The SWISS-PROT protein sequence database and its supplement TrEMBL in 2000. Nucleic Acids Res. 28, 45–48. 10.1093/nar/28.1.45, PMID: - DOI - PMC - PubMed