. 2021 Jul 7:12:668929.
doi: 10.3389/fpls.2021.668929. eCollection 2021.

Microbial Identification, High-Resolution Microscopy and Spectrometry of the Rhizosphere in Its Native Spatial Context

Affiliations

Microbial Identification, High-Resolution Microscopy and Spectrometry of the Rhizosphere in Its Native Spatial Context

Chaturanga D Bandara et al. Front Plant Sci. .

Erratum in

Abstract

During the past decades, several stand-alone and combinatorial methods have been developed to investigate the chemistry (i.e., mapping of elemental, isotopic, and molecular composition) and the role of microbes in soil and rhizosphere. However, none of these approaches are currently applicable to characterize soil-root-microbe interactions simultaneously in their spatial arrangement. Here we present a novel approach that allows for simultaneous microbial identification and chemical analysis of the rhizosphere at micro- to nano-meter spatial resolution. Our approach includes (i) a resin embedding and sectioning method suitable for simultaneous correlative characterization of Zea mays rhizosphere, (ii) an analytical work flow that allows up to six instruments/techniques to be used correlatively, and (iii) data and image correlation. Hydrophilic, immunohistochemistry compatible, low viscosity LR white resin was used to embed the rhizosphere sample. We employed waterjet cutting and avoided polishing the surface to prevent smearing of the sample surface at nanoscale. The quality of embedding was analyzed by Helium Ion Microscopy (HIM). Bacteria in the embedded soil were identified by Catalyzed Reporter Deposition-Fluorescence in situ Hybridization (CARD-FISH) to avoid interferences from high levels of autofluorescence emitted by soil particles and organic matter. Chemical mapping of the rhizosphere was done by Scanning Electron Microscopy (SEM) with Energy-dispersive X-ray analysis (SEM-EDX), Time-of-Flight Secondary Ion Mass Spectrometry (ToF-SIMS), nano-focused Secondary Ion mass Spectrometry (nanoSIMS), and confocal Raman spectroscopy (μ-Raman). High-resolution correlative characterization by six different techniques followed by image registration shows that this method can meet the demanding requirements of multiple characterization techniques to identify spatial organization of bacteria and chemically map the rhizosphere. Finally, we presented individual and correlative workflows for imaging and image registration to analyze data. We hope this method will be a platform to combine various 2D analytics for an improved understanding of the rhizosphere processes and their ecological significance.

Keywords: CARD-FISH; Helium Ion Microscopy; London Resin White embedding; Rhizosphere; Secondary Ion Mass Spectrometry; Soil bacteria; Water-jet cutting; correlative chemical microscopy.


Conflict of interest statement

The authors declare that the research was conducted in the absence of any commercial or financial relationships that could be construed as a potential conflict of interest.

Figures
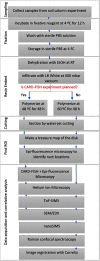
FIGURE 1
FIGURE 1
Schematic representation of the sample preparation, image registration and correlative analysis.
FIGURE 2
FIGURE 2
Surface roughness of embedded soil sample. (a) Three helium ion micrographs are stitched showing the quality of embedding and surface roughness of a root after water jet cutting. Root cell is located in the middle image and outlined in yellow for easy recognition. Root cells and soil-mineral interface are well infiltrated by the embedding procedure. Scale bar 50 μm (b) Surface profile of a root area measured by profilometer before microscopy. Rz = 49.8 μm (c) Resulted surface roughness of embedded soil once cut with different parameters by water-jet.
FIGURE 3
FIGURE 3
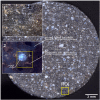
Resulted disk of soil column after water-jet cutting. Disk is a stitched image from 2704 individual images at darkfield microscopy mode. Insets 1-2 shows the magnified RoI marked in the soil disk. Crosses are surface features used to identify the RoI under different microscopes. (2) Epi-fluorescence micrograph of RoI showing the root, soil and minerals. Square marked in yellow is the RoI for high-resolution microscopy under HIM, ToF-SIMS, SEM-EDX, nanoSIMS and μ-Raman.
FIGURE 4
FIGURE 4
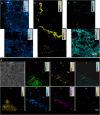
ToF-SIMS analysis of a Rhizosphere embedded sample. (a) Spectrum of LR white (b) Molecular fragment distribution related to SiCH4O2, CNO and POx (c) spectrum of POx rich areas.
FIGURE 5
FIGURE 5
SEM-BSE (gray figure) and SEM-EDX maps of mineral-forming elements. SEM-BSE contrast allows for separation of resin (a), light (b) and heavy (c) minerals as well as the identification of root-cells. The positions marked as “ + ” are identical with those in Figure 3. The SEM-EDX false-color maps show exactly the same field-of-view such that SEM-BSE contrast can be linked to elemental composition. Please note that the Calcium distribution is almost identical to that of phosphorous which hints to calcium phosphates precipitated around the root surface.
FIGURE 6
FIGURE 6
NanoSIMS images of resin embedded Rhizosphere. (a–c) Spectra from negative extraction mode showing elemental distribution (a) 12C14N (b) 31P16Ox and (c) 32S at root-soil interface of rhizosphere. Two FoV’s stitched by MosaicJ in Fiji. (d) Maps from positive extraction mode showing elemental distributions of 27Al+, 24Mg+, 11B+, 31P+, 55Mn+, 40Ca+ and 64Zn+. (d) Helium ion micrograph (HIM) of the analyzed area.
FIGURE 7
FIGURE 7
μ-Raman measurement of LR white resin-embedded soil. (a) Quartz-distribution map and (b) spectrum. (c) Mixture of zircon and aluminum-containing minerals and their (d) spectrum.
FIGURE 8
FIGURE 8
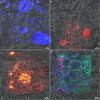
Catalyzed Reporter Deposition-Fluorescence in situ Hybridization (CARD-FISH) stained bacteria colonizing on Rhizosphere mineral. (a) Epifluorescence micrograph of combined DAPI and DsRed channel. Outlined square shows the area investigated by EDX analysis (b) DAPI channel (c) DsRed channel (d) Same area imaged by EDX. Two larger minerals indicate Si rich minerals where bacterial aggregates are identified.
FIGURE 9
FIGURE 9
Chemical maps registered to helium ion micrographs (a) EDX spectra of Si registered onto HIM (b) Raman spectra resisted on to HIM (c) CNO spectra of ToF-SIMS registered onto HIM. (d) 12C14N, 31P and 32S distribution maps from nanoSIMS registered onto HIM.
FIGURE 10
FIGURE 10
Correlation of light microscopy with SIP-nanoSIMS showing C and N uptake by roots and bacteria. (a) CARD-FISH image of soil microbes overlaid with brightfield micrograph showing the location of microbial cluster in the resin-embedded rhizosphere sample. The inset in frame a depicts an enlarged CARD-FISH image of bacterial cluster. NanoSIMS imaging of soil bacteria (b–d) and root (f–h). NanoSIMS analysis shows the relative assimilation of carbon (b) and nitrogen (c) within microbial cluster. (d) Log-scaled RGB-overlay of nitrogen assimilation (Red channel), CN ion yield map as biomass intrinsic marker (Green channel) and carbon assimilation (Blue channel). (e) Epifluorescence image showing the root (blue) and adjacent minerals. The area analyzed by nanoSIMS is highlighted in yellow. Relative assimilation of carbon (f) and nitrogen (g) in the root. (h) Log-scaled RGB-overlay of assimilation activity (nitrogen in Red, carbon in Blue) with the intrinsic biomass marker (CN ion yield map in Green).

References

    1. Abel S. (2017). Phosphate scouting by root tips. Curr. Opin. Plant Biol. 39 168–177. 10.1016/j.pbi.2017.04.016 - DOI - PubMed
    1. Amann R. I., Binder B. J., Olson R. J., Chisholm S. W., Devereux R., Stahl D. A. (1990). Combination of 16S rRNA-targeted oligonucleotide probes with flow cytometry for analyzing mixed microbial populations. Appl. Environ. Microbiol. 56:1919. 10.1128/aem.56.6.1919-1925.1990 - DOI - PMC - PubMed
    1. Bandara C. D., Schmidt M., Davoudpour Y., Stryhanyuk H., Richnow H. H., Musat N. (2021). High-resolution chemical mapping and microbial identification of rhizosphere using correlative microscopy. bioRxiv 2021:429689. - PubMed
    1. Baveye P. C., Otten W., Kravchenko A., Balseiro-Romero M., Beckers E., Chalhoub M., et al. (2018). Emergent properties of microbial activity in heterogeneous soil microenvironments: different research approaches are slowly converging, yet major challenges remain. Front. Microbiol. 9:1929. 10.3389/fmicb.2018.01929 - DOI - PMC - PubMed
    1. Benettoni P., Stryhanyuk H., Wagner S., Kollmer F., Moreno Osorio J. H., Schmidt M., et al. (2019). Identification of nanoparticles and their localization in algal biofilm by 3D-imaging secondary ion mass spectrometry. J. Analyt. Atomic Spectrometry 34 1098–1108. 10.1039/c8ja00439k - DOI