. 2021 Jul 9:12:642608.
doi: 10.3389/fgene.2021.642608. eCollection 2021.

Significance of Tumor Mutation Burden Combined With Immune Infiltrates in the Progression and Prognosis of Advanced Gastric Cancer

Affiliations

Significance of Tumor Mutation Burden Combined With Immune Infiltrates in the Progression and Prognosis of Advanced Gastric Cancer

Xiong Guo et al. Front Genet. .

Abstract

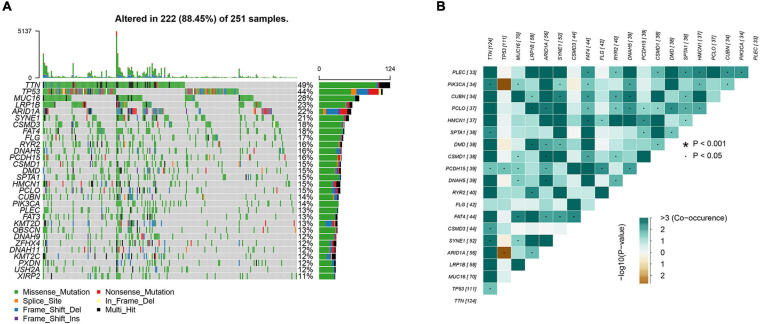
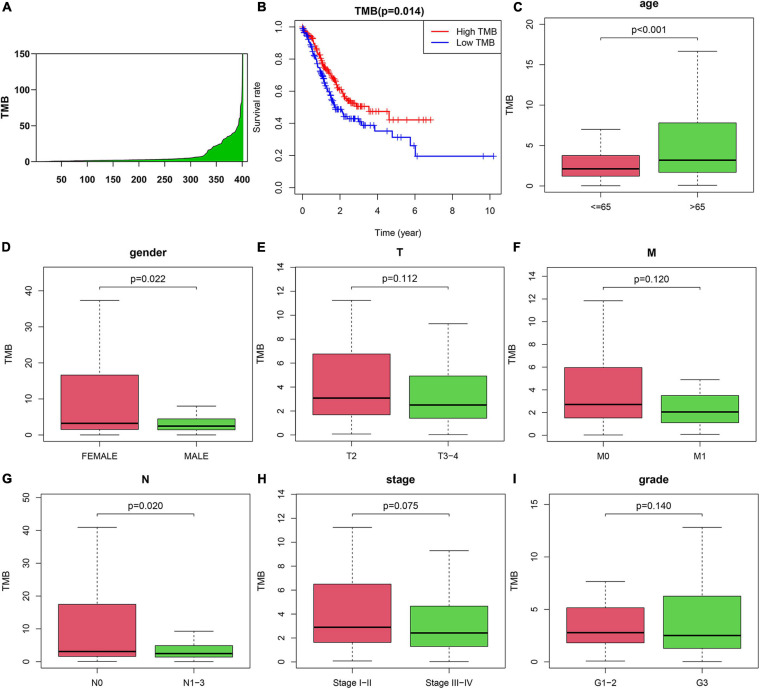
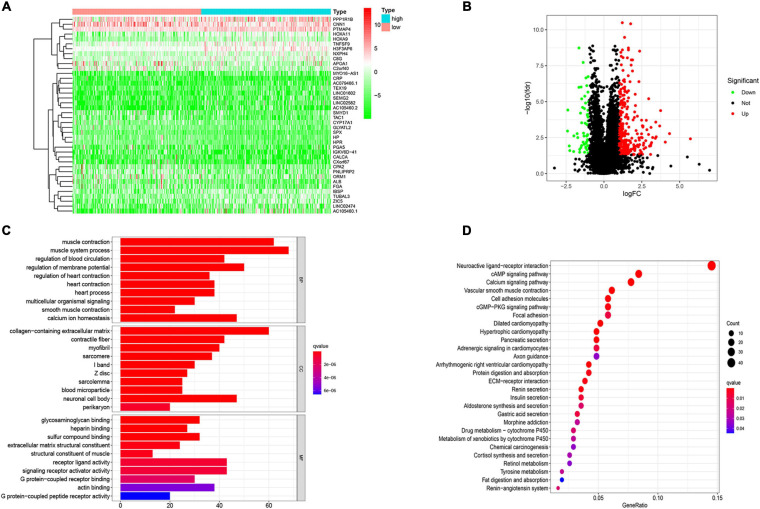
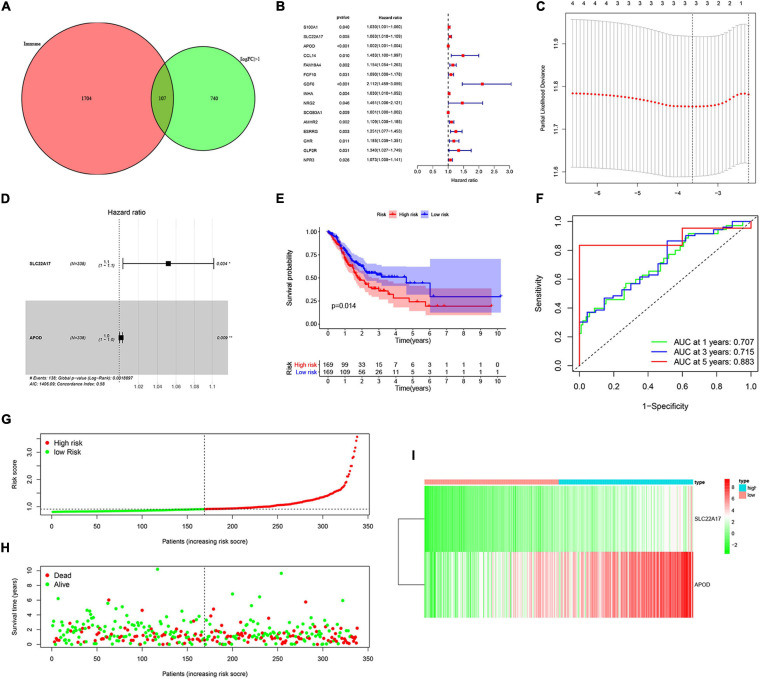
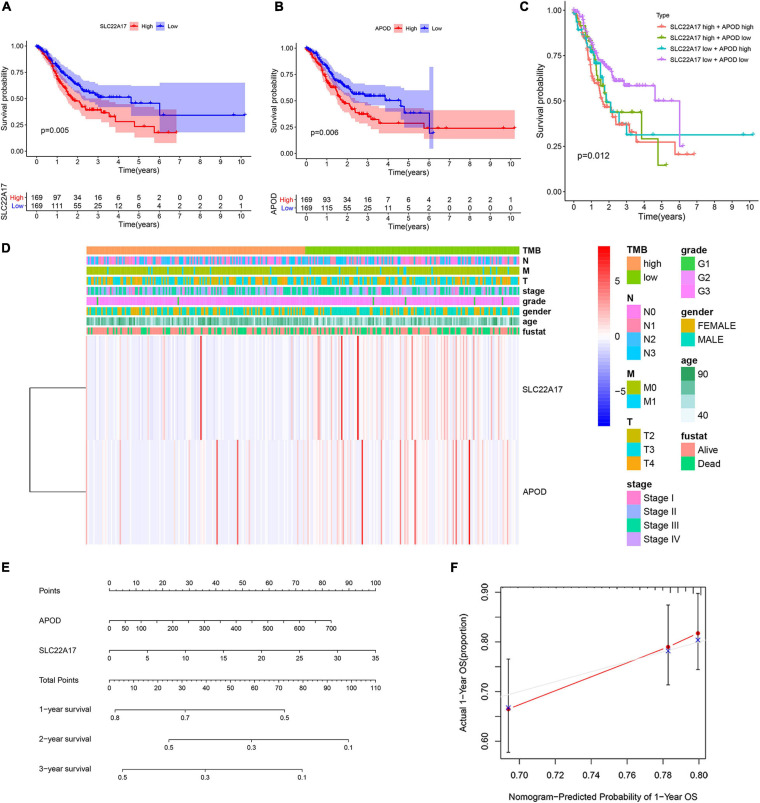
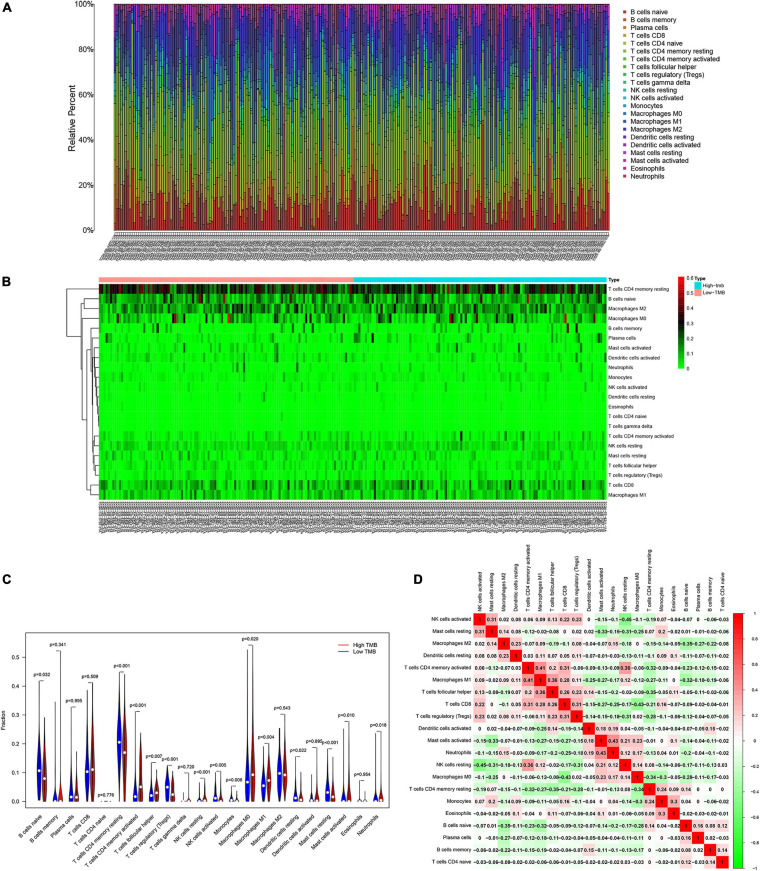
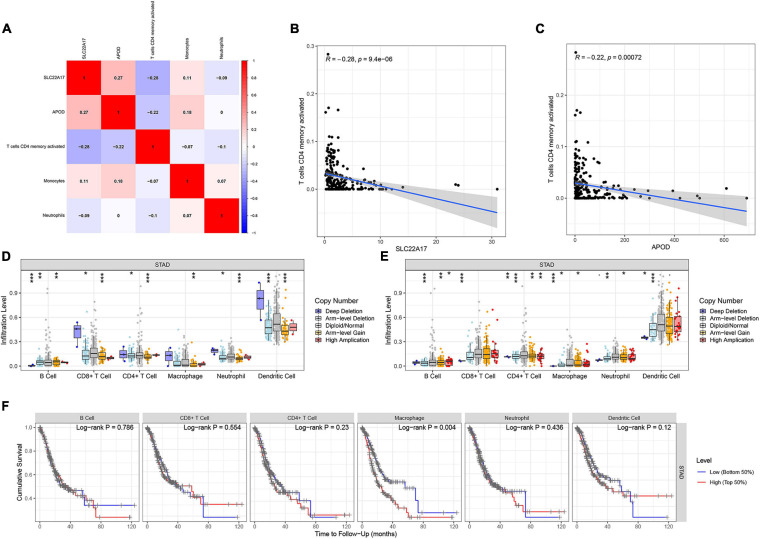
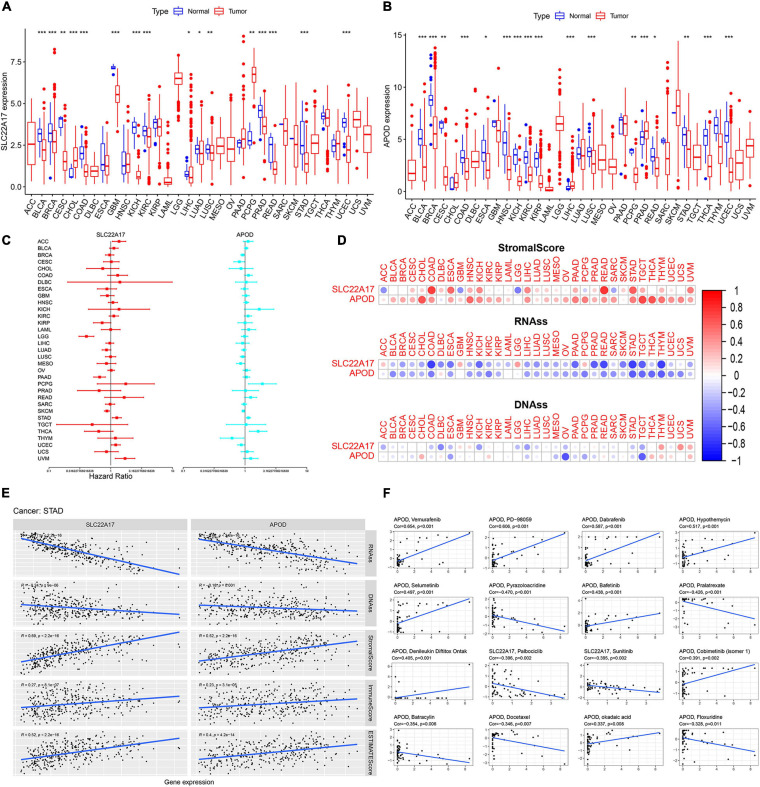
Gastric cancer (GC) is a serious malignant tumor with high mortality and poor prognosis. The prognosis and survival are much worse for advanced gastric cancer (AGC). Recently, immunotherapy has been widely promoted for AGC patients, and studies have shown that tumor mutation burden (TMB) is closely related to immunotherapy response. Here, RNA-seq data, matched clinical information, and MAF files were downloaded from the cancer genome atlas (TCGA)-STAD project in the TCGA database. The collation and visual analysis of mutation data were implemented by the "maftools" package in R. We calculated the TMB values for AGC patients and divided the patients into high- and low-TMB groups according to the median value of TMB. Then, the correlation between high or low TMB and clinicopathological parameters was calculated. Next, we examined the differences in gene expression patterns between the two groups by using the "limma" R package and identified the immune-related genes among the DEGs. Through univariate Cox regression analysis, 15 genes related to prognosis were obtained. Furthermore, the two hub genes (APOD and SLC22A17) were used to construct a risk model to evaluate the prognosis of AGC patients. ROC and survival curves and GEO data were used as a validation set to verify the reliability of this risk model. In addition, the correlation between TMB and tumor-infiltrating immune cells was examined. In conclusion, our results suggest that AGC patients with high TMB have a better prognosis. By testing the patient's TMB, we could better guide immunotherapy and understand patient response to immunotherapy.

Keywords: advanced gastric cancer; bioinformatics analysis; immune infiltration; prognosis; tumor mutation burden.


Conflict of interest statement

The authors declare that the research was conducted in the absence of any commercial or financial relationships that could be construed as a potential conflict of interest.

Figures

FIGURE 1
FIGURE 1
Analyses of somatic mutation profiles in advanced gastric cancer. (A) Waterfall plot of detailed mutation information of top 30 genes in each sample, with various color annotations to distinguish different mutation types. (B) Correlation between the top 20 mutated genes.
FIGURE 2
FIGURE 2
Correlation between tumor mutation burden (TMB) and clinicopathological characteristics of AGC patients. (A) TMB value in advanced gastric cancer samples. (B) Survival analysis between high-TMB and low-TMB patients. (C–I) Correlation between TMB and (C) age, (D) gender, (E) T, (F) M, (G) N, (H) Stage, and (I) grade of patients.
FIGURE 3
FIGURE 3
Variation in the genes related to TMB and functional analysis. (A) The differentially expressed genes (DEGs) related to TMB. (B) Volcano ma2p of DEGs. (C) Go and (D) KEGG analysis of DEGs related to TMB. The abscissa represents the number and proportion of genes, respectively.
FIGURE 4
FIGURE 4
Construction and validation of prognostic model. (A) Venn analysis of immune-related differentially expressed genes. (B) 15 candidate prognosis-related genes were obtained using univariate analysis. (C,D) Two prognosis-related genes were obtained by using LASSO regression and used for the construction of prognostic model. (E,F) High-risk group correlated with poor survival outcome, with p = 0.014. (E) Survival analysis of high-risk and low-risk groups. (F) ROC curves of 1, 2-, and 5-year survival prediction, with AUC = 0.707, 0.715, and 0.883, respectively. (G,H) The distribution of risk score and gene expression levels among patients in the cancer genome atlas (TCGA) data. (I) The expression of two prognostic genes between high-risk and low-risk patients in TCGA training set.
FIGURE 5
FIGURE 5
Two genes in prognostic model were associated with patients’ survival and clinical characteristics. (A,B) Survival analysis of (A) SLC22A17 and (B) APOD genes in patients with AGC. (C) Survival analysis of AGC patients with different expressions group of SLC22A17 and APOD. (D) The expression of SLC22A17 and APOD are associated with patients’ TMB and clinical characteristics. (E) The patients’ 1-, 2-, and 3-year survival were predicted by using a nomogram. (F) Calibration curves for the survival probability at 1 year.
FIGURE 6
FIGURE 6
Patients with various degree of TMB have different features of immune cell infiltration. (A) Proportion of immune infiltrating cells in gastric cancer samples. (B) Heat map and (C) bar graph of immune infiltrating cells between high-TMB and low-TMB patients. (D) Correlation analysis of 22 kinds of immune cells.
FIGURE 7
FIGURE 7
Relation of TMB and prognostic model genes with immune cell infiltration. (A) Correlation between prognostic related immune infiltrating cells and prognostic model constructed by SLC22A17 and APOD. (B,C) T cells CD4 memory activated was negative associated with the expression of (B) SLC22A17 and (C) APOD. (D,E) Immune infiltration level among gastric cancer patients with diverse degree of copy number variation. (F) Survival probability of patients with low and high immune infiltration level of six immune cells. *p < 0.05, **p < 0.01, and ***p < 0.001.
FIGURE 8
FIGURE 8
SLC22A17 and APOD are dysregulated in multi-types cancer cells and related to cancer stemness and drug resistance. (A,B) Expression of (A) SLC22A17 and (B) APOD in multi-types cancer cells. (C) The prognostic value of SLC22A17 and APOD in the 33 cancers was identified by using univariate cox regression analysis. (D,E) SLC22A17 and APOD are associated with cancer stemness in various cancer types, including gastric cancer. (F) The correlation between SLC22A17, APOD, and tumor drug resistance. The abscissa and ordinate represent drug sensitivity score and gene expression, respectively. *p < 0.05, **p < 0.01, and ***p < 0.001.

Similar articles

Cited by

References

    1. Ahn I., Tian X., Wiestner A. (2020). TP53Ibrutinib for chronic lymphocytic leukemia with alterations. N. Engl. J. Med. 383 498–500. 10.1056/NEJMc2005943 - DOI - PMC - PubMed
    1. Ajani J., Lee J., Sano T., Janjigian Y., Fan D., Song S. (2017). Gastric adenocarcinoma. Nat. Rev. Dis. Prim. 3:17036. 10.1038/nrdp.2017.36 - DOI - PubMed
    1. Alexandrov L., Nik-Zainal S., Wedge D., Aparicio S., Behjati S., Biankin A., et al. (2013). Signatures of mutational processes in human cancer. Nature 500 415–421. 10.1038/nature12477 - DOI - PMC - PubMed
    1. Al-Mahrouqi H., Parkin L., Sharples K. (2011). Incidence of stomach cancer in oman and the other gulf cooperation council countries. Oman Med. J. 26 258–262. 10.5001/omj.2011.62 - DOI - PMC - PubMed
    1. Barbosa K., Li S., Adams P., Deshpande A. (2019). The role of TP53 in acute myeloid leukemia: challenges and opportunities. Genes Chromos. Cancer 58 875–888. 10.1002/gcc.22796 - DOI - PubMed