. 2021 Jul 1:19:3908-3921.
doi: 10.1016/j.csbj.2021.06.046. eCollection 2021.

Drug repositioning based on network-specific core genes identifies potential drugs for the treatment of autism spectrum disorder in children

Affiliations

Drug repositioning based on network-specific core genes identifies potential drugs for the treatment of autism spectrum disorder in children

Huan Gao et al. Comput Struct Biotechnol J. .

Abstract

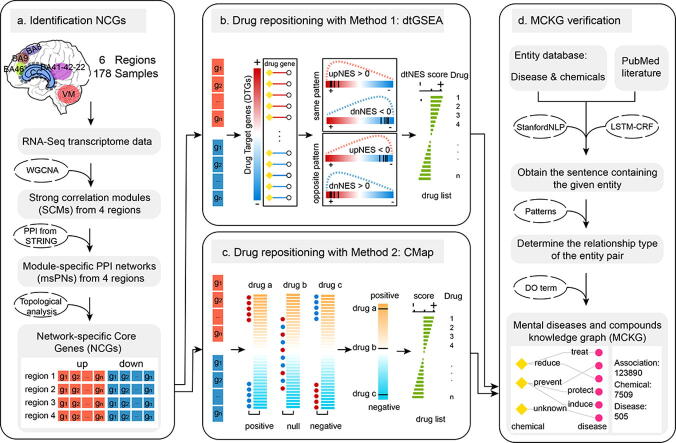
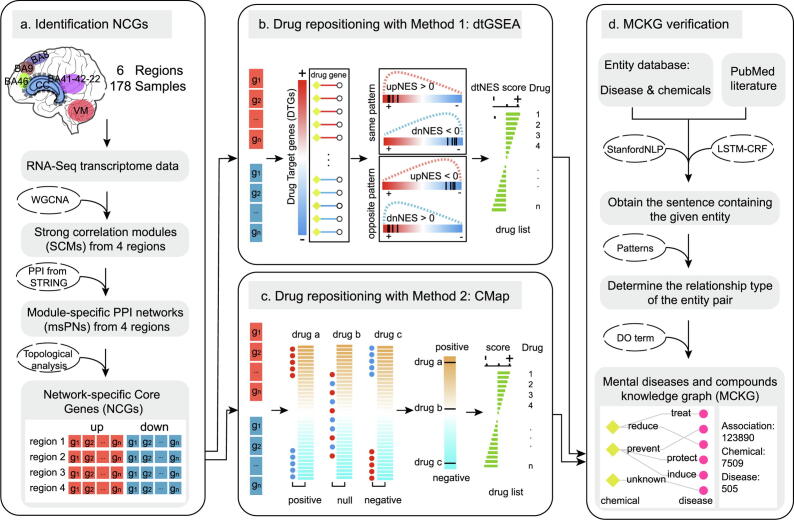
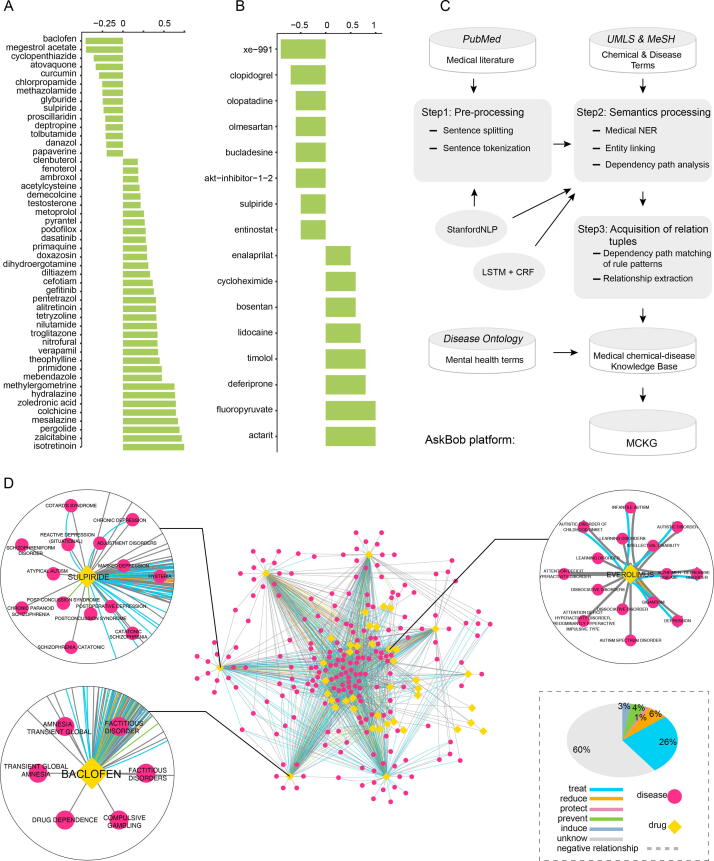
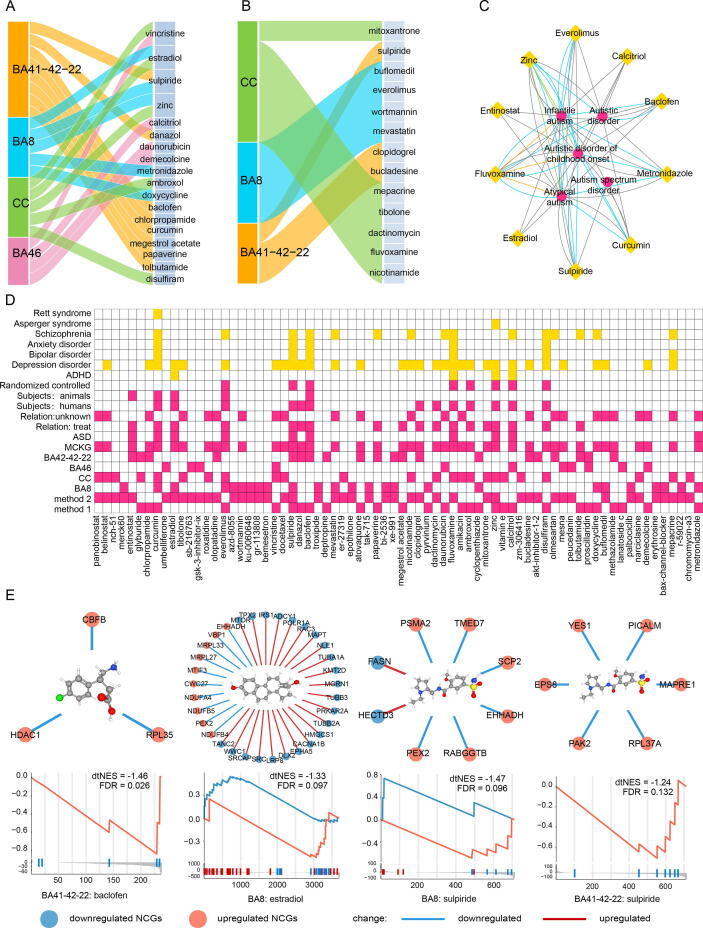
Identification of exact causative genes is important for in silico drug repositioning based on drug-gene-disease relationships. However, the complex polygenic etiology of the autism spectrum disorder (ASD) is a challenge in the identification of etiological genes. The network-based core gene identification method can effectively use the interactions between genes and accurately identify the pathogenic genes of ASD. We developed a novel network-based drug repositioning framework that contains three steps: network-specific core gene (NCG) identification, potential therapeutic drug repositioning, and candidate drug validation. First, through the analysis of transcriptome data for 178 brain tissues, gene network analysis identified 365 NCGs in 18 coexpression modules that were significantly correlated with ASD. Second, we evaluated two proposed drug repositioning methods. In one novel approach (dtGSEA), we used the NCGs to probe drug-gene interaction data and identified 35 candidate drugs. In another approach, we compared NCG expression patterns with drug-induced transcriptome data from the Connectivity Map database and found 46 candidate drugs. Third, we validated the candidate drugs using an in-house mental diseases and compounds knowledge graph (MCKG) that contained 7509 compounds, 505 mental diseases, and 123,890 edges. We found a total of 42 candidate drugs that were associated with mental illness, among which 10 drugs (baclofen, sulpiride, estradiol, entinostat, everolimus, fluvoxamine, curcumin, calcitriol, metronidazole, and zinc) were postulated to be associated with ASD. This study proposes a powerful network-based drug repositioning framework and also provides candidate drugs as well as potential drug targets for the subsequent development of ASD therapeutic drugs.

Keywords: Autism spectrum disorder; Coexpression network; Drug repositioning; Knowledge graph; Natural language processing.


Conflict of interest statement

The authors declare that they have no known competing financial interests or personal relationships that could have appeared to influence the work reported in this paper.

Figures

None
Graphical abstract
Fig. 1
Fig. 1
Workflow for potential therapeutic drug repurposing for ASD. The workflow contains 4 main steps: a identification of NCGs based on network analysis methods; b drug repositioning with method 1: drug-target gene set enrichment analysis (dtGSEA); c drug repositioning with method 2: the Connectivity Map webtool; and d knowledge graph construction.
Fig. 2
Fig. 2
Coexpression network analysis and functional enrichment network for the identified genes. a PCA plot before batch effect removal based on gene expression and after ComBat batch effect removal. Dots with different colors correspond to different brain regions. b Relationships of MEs (module eigengenes) and ASD in the 4 brain region. Each row in the table corresponds to a module. The numbers in the table report the correlations of the corresponding MEs and traits (P < 0.05, modified Bonferroni test). The table is color-coded by correlation according to the color legend. c Bar plot representation of differential gene expression in different brain regions. d Venn diagrams of differentially expressed genes. e The percentages of all differentially expressed genes distributed in the brain regions are shown in the pie chart. f GO term enrichment analysis of genes in the light yellow SCM of BA8. g GO term enrichment analysis of genes in the dark orange SCM of BA8. h GO term enrichment analysis of genes in the royal blue SCM of BA41-42-22. i GO term enrichment analysis of genes in the salmon SCM of BA41-42-22. The x-axis shows the -log (q-value), and the y-axis shows the GO terms. (For interpretation of the references to color in this figure legend, the reader is referred to the web version of this article.)
Fig. 3
Fig. 3
Module-specific PPI network and functional analysis. a Venn diagram. In the Venn diagram, the largest ellipse represents the number of genes in the SCM, the medium ellipse represents the number of genes in the module-specific PPI network (msPN), and the smallest ellipse represents the number of NCGs. b msPNs and NCGs. The named nodes represent NCGs from the msPN, the orange nodes represent NCGs from BA41-42–22, the deep sky blue nodes represent NCGs from BA8, the light green nodes represent NCGs from CC, the pink nodes represent NCGs from BA46, and the dark cyan nodes represent the intersections of NCGs from different brain regions. The gray nodes are proteins in the msPN, and the gray edges represent protein interactions in the msPN. c Functional enrichment revealed that the genes in the msPNs are related to the nervous system. d Functional enrichment revealed that the genes in the msPNs are related to other functions. (For interpretation of the references to color in this figure legend, the reader is referred to the web version of this article.)
Fig. 4
Fig. 4
Drug repositioning results and MCKG. a Significant drug-target normalized enrichment score (dtNES) for ASD from BA41-42–22. The x-axis shows the positive dtNES −1 and the negative dtNES + 1, and the y-axis shows the drug name. b Significant CMap connectivity score for ASD from BA41-42–22. The x-axis is the score ((positive score − 95)/10 and (negative score + 95)/10) and the y-axis is the name of the drug. The horizontal bars indicate the computationally predicted therapeutic scores for the drugs based on comparison of the gene expression signatures of the drugs with the NCGs. A negative score indicates that a drug exhibits an expression pattern that is oppositional to the disease; such, drugs are potential therapeutic drugs. c Overview of the knowledge graph and processing pipeline. d Forty-two drug candidates and the mental illness association network from MCKG. Yellow nodes represent drugs, magenta nodes represent mental illnesses, and differently colored edges indicate different relationship types. The pie charts show the percentages of relationship types. (For interpretation of the references to color in this figure legend, the reader is referred to the web version of this article.)
Fig. 5
Fig. 5
Evaluation of drug candidates. a Sankey diagram of potential drugs identified by the dtGSEA method in the MCKG. b Sankey diagram of potential drugs identified by the CMap method in the MCKG. The first column (left) shows the brain regions. The second column (right) shows the potential drugs. c Ten drug candidates related to ASD in the MCKG. The yellow nodes represent drugs, and the magenta nodes represent mental illness. d Comprehensive information heatmap of 72 drug candidates. Each column represents a candidate drug, and each row represents an attribute of the candidate drug (for example, the method, brain region, whether or not it is from the MCKG, whether or not it can treat ASD, the type of study, the subject, etc.). Yellow indicates whether the drug candidate is related to other mental illnesses in the MCKG. e Target NCGs and GSEA results of drug candidates identified by the dtGSEA method. (For interpretation of the references to color in this figure legend, the reader is referred to the web version of this article.)
None

Similar articles

Cited by

References

    1. Jeste S.S., Geschwind D.H. Disentangling the heterogeneity of autism spectrum disorder through genetic findings. Nat Rev Neurol. 2014;10(2):74–81. - PMC - PubMed
    1. Ecker C., Bookheimer S.Y., Murphy D.G.M. Neuroimaging in autism spectrum disorder: brain structure and function across the lifespan. Lancet Neurol. 2015;14(11):1121–1134. - PubMed
    1. Jon Baio E, Wiggins L, Christensen DL, Maenner MJ, Daniels J, Warren Z: Prevalence of Autism Spectrum Disorder Among Children Aged 8 Years — Autism and Developmental Disabilities Monitoring Network, 11 Sites, United States, 2014. Morbidity and Mortality Weekly Report (MMWR) 2018. - PMC - PubMed
    1. Ji N.Y., Findling R.L. An update on pharmacotherapy for autism spectrum disorder in children and adolescents. Curr Opin Psychiatr. 2015;28(2):91–101. - PubMed
    1. Mazzone L., Giovagnoli G., Siracusano M., Postorino V., Curatolo P. Drug treatments for core symptoms of autism spectrum disorder: unmet needs and future directions. J Pediatr Neurol. 2017;15(03):134–142.

LinkOut - more resources