

Autophagy-Related Genes in Atherosclerosis
- PMID: 34306596
- PMCID: PMC8270709
- DOI: 10.1155/2021/6402206
Autophagy-Related Genes in Atherosclerosis
Abstract
Background: Atherosclerosis (AS) is a common chronic vascular inflammatory disease and one of the main causes of cardiovascular/cerebrovascular diseases (CVDs). Autophagy-related genes (ARGs) play a crucial part in pathophysiological processes of AS. However, the expression profile of ARGs has rarely been adopted to explore the relationship between autophagy and AS. Therefore, using the expression profile of ARGs to explore the relationship between autophagy and AS may provide new insights for the treatment of CVDs.
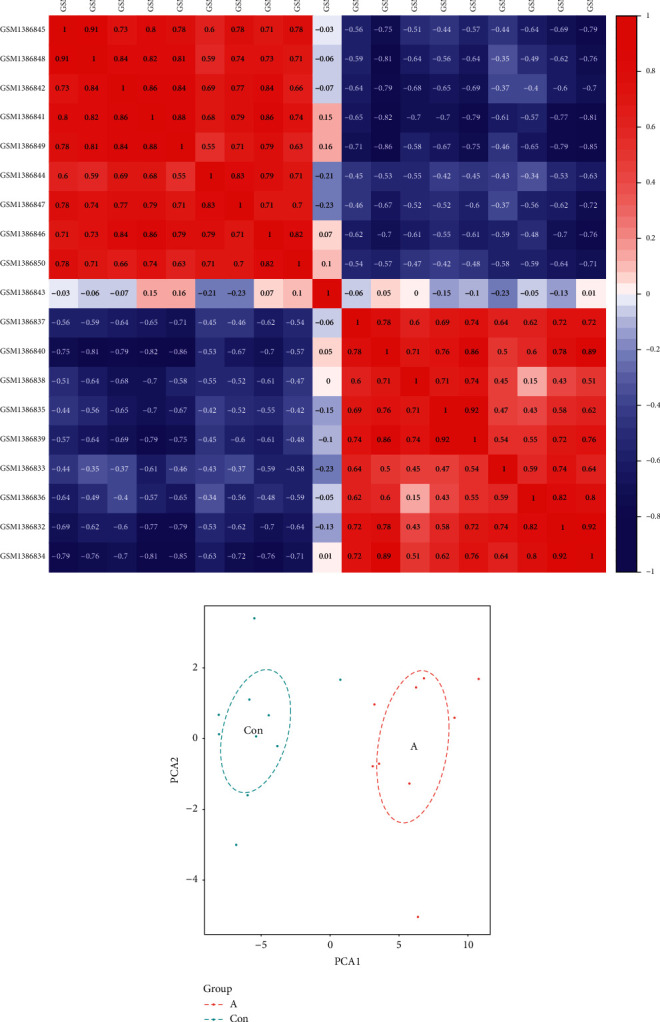
Methods: The differentially expressed ARGs of the GSE57691 dataset were obtained from the Human Autophagy Database (HADb) and the Gene Expression Omnibus (GEO) database, and the GSE57691 dataset contains 9 aortic atheroma tissues and 10 normal aortic tissues. The differentially expressed ARGs of the GSE57691 dataset were analyzed by protein-protein interaction (PPI), gene ontology analysis (GO), and Kyoto Encyclopedia of Genes and Genomes analysis (KEGG) and were chosen to explore related miRNAs/transcriptional factors.
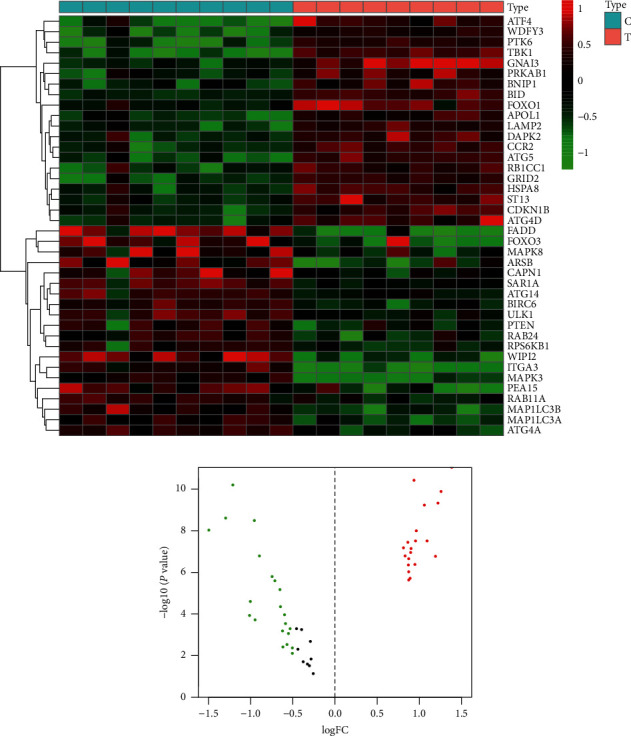
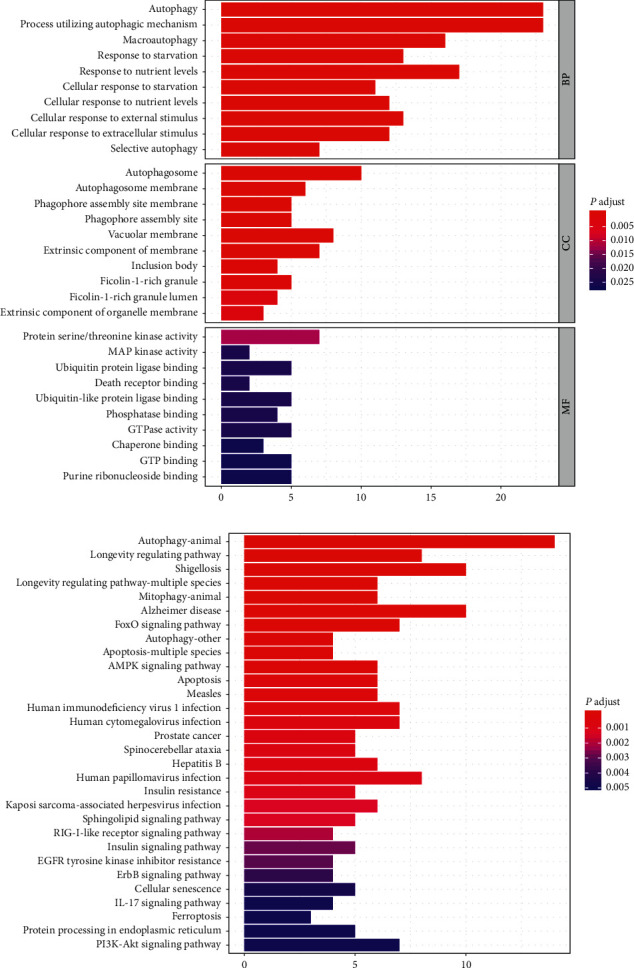
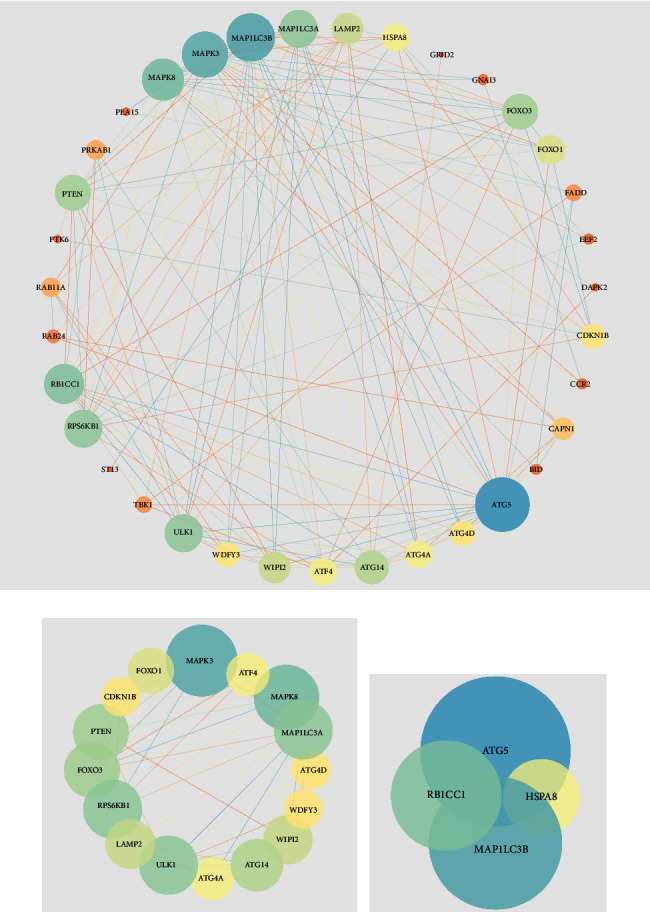
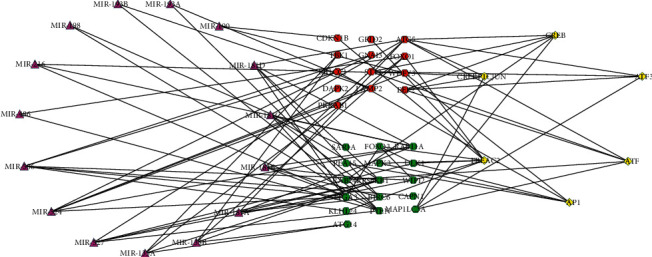
Results: The GSE57691 dataset had a total of 41 differentially expressed ARGs. The GO analysis results revealed that ARGs were mainly enriched in autophagy, autophagosome, and protein serine/threonine kinase activity. KEGG analysis results showed that ARGs were mainly enriched in autophagy-animal and longevity regulating signaling pathways. Expressions of ATG5, MAP1LC3B, MAPK3, MAPK8, and RB1CC1 were regarded as focus in the PPI regulatory networks. Furthermore, 11 related miRNAs and 6 related transcription factors were obtained by miRNAs/transcription factor target network analysis.
Conclusions: Autophagy and ARGs may play a vital role in regulating the pathophysiology of AS.
Copyright © 2021 Yuankun Chen et al.
Conflict of interest statement
The authors declare that they have no conflicts of interest.
Figures
Similar articles
-
Identification and validation of autophagy-related genes in Kawasaki disease.Hereditas. 2023 Apr 21;160(1):17. doi: 10.1186/s41065-023-00278-9. Hereditas. 2023. PMID: 37085930 Free PMC article.
-
Identification and experimental validation of autophagy-related genes in abdominal aortic aneurysm.Eur J Med Res. 2023 Sep 22;28(1):368. doi: 10.1186/s40001-023-01354-6. Eur J Med Res. 2023. PMID: 37737183 Free PMC article.
-
Screening and identification of NOTCH1, CDKN2A, and NOS3 as differentially expressed autophagy-related genes in erectile dysfunction.PeerJ. 2021 Aug 13;9:e11986. doi: 10.7717/peerj.11986. eCollection 2021. PeerJ. 2021. PMID: 34447638 Free PMC article.
-
Revealing the novel autophagy-related genes for ligamentum flavum hypertrophy in patients and mice model.Front Immunol. 2022 Oct 5;13:973799. doi: 10.3389/fimmu.2022.973799. eCollection 2022. Front Immunol. 2022. PMID: 36275675 Free PMC article.
-
MAPK8 and HDAC6: potential biomarkers related to autophagy in diabetic retinopathy based on bioinformatics analysis.Front Endocrinol (Lausanne). 2025 May 21;16:1487007. doi: 10.3389/fendo.2025.1487007. eCollection 2025. Front Endocrinol (Lausanne). 2025. PMID: 40469433 Free PMC article.
Cited by
-
Characterization of caffeine response regulatory variants in vascular endothelial cells.Elife. 2024 Feb 9;13:e85235. doi: 10.7554/eLife.85235. Elife. 2024. PMID: 38334359 Free PMC article.
-
The chemical composition analysis of Yixin Tongmai Granules using UHPLC-MS/MS and exploration of its potential mechanism in treatment of coronary artery disease based on network pharmacology and molecular docking.Medicine (Baltimore). 2025 Feb 21;104(8):e41620. doi: 10.1097/MD.0000000000041620. Medicine (Baltimore). 2025. PMID: 39993113 Free PMC article.
-
The Integrated Analysis Identifies Three Critical Genes as Novel Diagnostic Biomarkers Involved in Immune Infiltration in Atherosclerosis.Front Immunol. 2022 May 18;13:905921. doi: 10.3389/fimmu.2022.905921. eCollection 2022. Front Immunol. 2022. PMID: 35663954 Free PMC article.
-
Identification of Potentially Functional Circular RNA/Long Noncoding RNA-MicroRNA-mRNA Regulatory Networks Associated with Vascular Injury in Type 2 Diabetes Mellitus by Integrated Microarray Analysis.J Diabetes Res. 2023 Mar 10;2023:3720602. doi: 10.1155/2023/3720602. eCollection 2023. J Diabetes Res. 2023. PMID: 36937538 Free PMC article.
-
Autophagy, Pyroptosis, and Ferroptosis: New Regulatory Mechanisms for Atherosclerosis.Front Cell Dev Biol. 2022 Jan 13;9:809955. doi: 10.3389/fcell.2021.809955. eCollection 2021. Front Cell Dev Biol. 2022. PMID: 35096837 Free PMC article. Review.
References
Publication types
MeSH terms
Substances
LinkOut - more resources
Full Text Sources
Medical
Research Materials
Miscellaneous
