

Development of a Nomogram Based on Preoperative Bi-Parametric MRI and Blood Indices for the Differentiation Between Cystic-Solid Pituitary Adenoma and Craniopharyngioma
- PMID: 34307178
- PMCID: PMC8300562
- DOI: 10.3389/fonc.2021.709321
Development of a Nomogram Based on Preoperative Bi-Parametric MRI and Blood Indices for the Differentiation Between Cystic-Solid Pituitary Adenoma and Craniopharyngioma
Abstract
Background: Given the similarities in clinical manifestations of cystic-solid pituitary adenomas (CS-PAs) and craniopharyngiomas (CPs), this study aims to establish and validate a nomogram based on preoperative imaging features and blood indices to differentiate between CS-PAs and CPs.
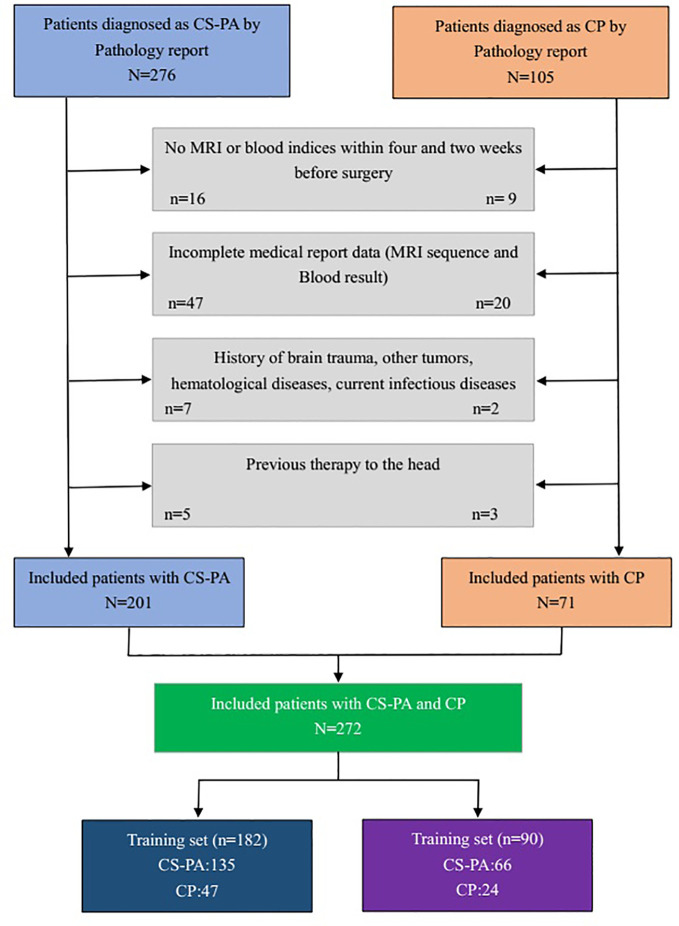
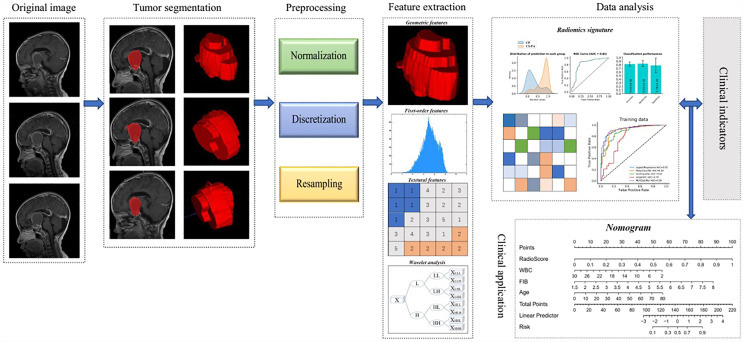
Methods: A departmental database was searched to identify patients who had undergone tumor resection between January 2012 and December 2020, and those diagnosed with CS-PAs or CPs by histopathology were included. Preoperative magnetic resonance imaging (MRI) features as well as blood indices were retrieved and analyzed. Radiological features were extracted from the tumor on contrast-enhanced T1 (CE-T1) weighted and T2 weighted sequences. The two independent samples t-test and principal component analysis (PCA) were used for feature selection, data dimension reduction, and radiomics signature building. Next, the radiomics signature was put in five classification models for exploring the best classifier with superior identification performance. Multivariate logistic regression analysis was then used to establish a radiomic-clinical model containing radiomics and hematological features, and the model was presented as a nomogram. The performance of the radiomics-clinical model was assessed by calibration curve, clinical effectiveness as well as internal validation.
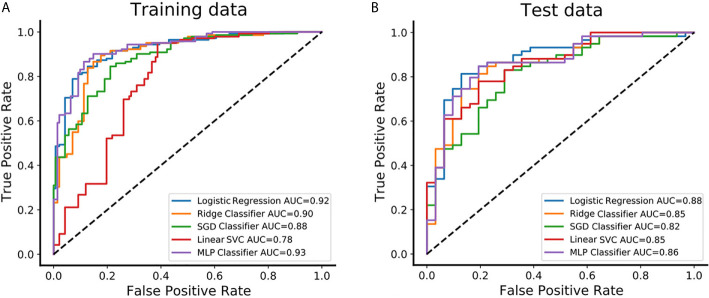
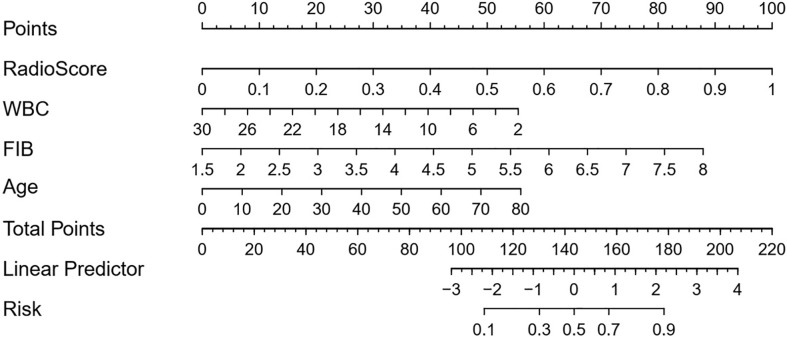
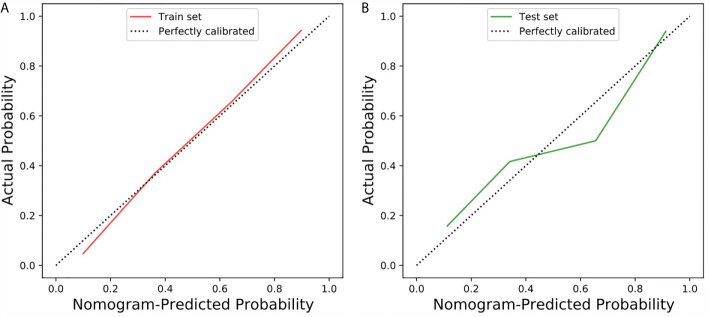
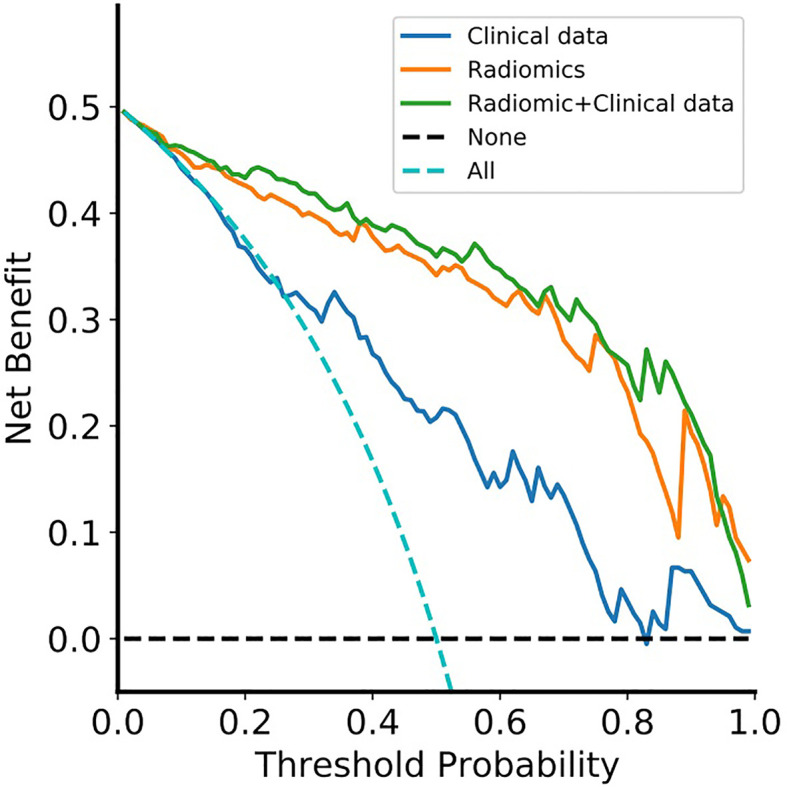
Results: A total of 272 patients were included in this study: 201 with CS-PAs and 71 with CPs. These patients were randomized into training set (n=182) and test set (n=90). The radiomics signature, which consisted of 18 features after dimensionality reduction, showed superior discrimination performance in 5 different classification models. The area under the curve (AUC) values of the training set and the test set obtained by the radiomics signature are 0.92 and 0.88 in the logistic regression model, 0.90 and 0.85 in the Ridge classifier, 0.88 and 0.82 in the stochastic gradient descent (SGD) classifier, 0.78 and 0.85 in the linear support vector classification (Linear SVC), 0.93 and 0.86 in the multilayers perceptron (MLP) classifier, respectively. The predictive factors of the nomogram included radiomic signature, age, WBC count, and FIB. The nomogram showed good discrimination performance (with an AUC of 0.93 in the training set and 0.90 in the test set) and good calibration. Moreover, decision curve analysis (DCA) demonstrated satisfactory clinical effectiveness of the proposed radiomic-clinical nomogram.
Conclusions: A personalized nomogram containing radiomics signature and blood indices was proposed in this study. This nomogram is simple yet effective in differentiating between CS-PAs and CPs and thus can be used in routine clinical practice.
Keywords: craniopharyngioma; machine learning; nomogram; pituitary adenoma; predictive model; radiomics.
Copyright © 2021 Zhao, Xiao, Nie, Zhang, Jiang, Jecha, Yan and Zhao.
Conflict of interest statement
The authors declare that the research was conducted in the absence of any commercial or financial relationships that could be construed as a potential conflict of interest.
Figures
Similar articles
-
Multi-parametric MRI-based machine learning model for prediction of WHO grading in patients with meningiomas.Eur Radiol. 2024 Apr;34(4):2468-2479. doi: 10.1007/s00330-023-10252-8. Epub 2023 Oct 9. Eur Radiol. 2024. PMID: 37812296 Free PMC article.
-
Preoperative prediction of cavernous sinus invasion by pituitary adenomas using a radiomics method based on magnetic resonance images.Eur Radiol. 2019 Mar;29(3):1625-1634. doi: 10.1007/s00330-018-5725-3. Epub 2018 Sep 25. Eur Radiol. 2019. PMID: 30255254 Free PMC article.
-
Development and validation of a radiomics-visual evoked potential nomogram for preoperative prediction of visual outcome after endoscopic craniopharyngioma resection.J Neurosurg. 2025 Jan 24;142(6):1663-1673. doi: 10.3171/2024.9.JNS241482. Print 2025 Jun 1. J Neurosurg. 2025. PMID: 39854715
-
Development and validation of a MRI-based combined radiomics nomogram for differentiation in chondrosarcoma.Front Oncol. 2023 Feb 28;13:1090229. doi: 10.3389/fonc.2023.1090229. eCollection 2023. Front Oncol. 2023. PMID: 36925933 Free PMC article.
-
A Radiomics nomogram for predicting bone metastasis in newly diagnosed prostate cancer patients.Eur J Radiol. 2020 Jul;128:109020. doi: 10.1016/j.ejrad.2020.109020. Epub 2020 Apr 19. Eur J Radiol. 2020. PMID: 32371181
Cited by
-
Deep learning-enhanced radiomics for histologic classification and grade stratification of stage IA lung adenocarcinoma: a multicenter study.Front Oncol. 2023 Jul 20;13:1224455. doi: 10.3389/fonc.2023.1224455. eCollection 2023. Front Oncol. 2023. PMID: 37546407 Free PMC article.
-
A Novel Magnetic Resonance Imaging-Based Radiomics and Clinical Predictive Model for the Regrowth of Postoperative Residual Tumor in Non-Functioning Pituitary Neuroendocrine Tumor.Medicina (Kaunas). 2023 Aug 23;59(9):1525. doi: 10.3390/medicina59091525. Medicina (Kaunas). 2023. PMID: 37763643 Free PMC article.
-
Machine learning method based on radiomics help differentiate posterior pituitary tumors from pituitary neuroendocrine tumors and craniopharyngioma.Sci Rep. 2025 Jun 6;15(1):19967. doi: 10.1038/s41598-025-05143-5. Sci Rep. 2025. PMID: 40481169 Free PMC article.
-
Development and validation of a radiomics nomogram for preoperative prediction of BRAFV600E mutation status in adult patients with craniopharyngioma.Neurosurg Rev. 2024 Dec 27;48(1):8. doi: 10.1007/s10143-024-03170-w. Neurosurg Rev. 2024. PMID: 39729136
-
Multi-parametric MRI-based machine learning model for prediction of WHO grading in patients with meningiomas.Eur Radiol. 2024 Apr;34(4):2468-2479. doi: 10.1007/s00330-023-10252-8. Epub 2023 Oct 9. Eur Radiol. 2024. PMID: 37812296 Free PMC article.
References
LinkOut - more resources
Full Text Sources