. 2021 Jul 9:9:698659.
doi: 10.3389/fcell.2021.698659. eCollection 2021.

Pan-Cancer Survey of Tumor Mass Dormancy and Underlying Mutational Processes

Affiliations

Pan-Cancer Survey of Tumor Mass Dormancy and Underlying Mutational Processes

Anna Julia Wiecek et al. Front Cell Dev Biol. .

Abstract

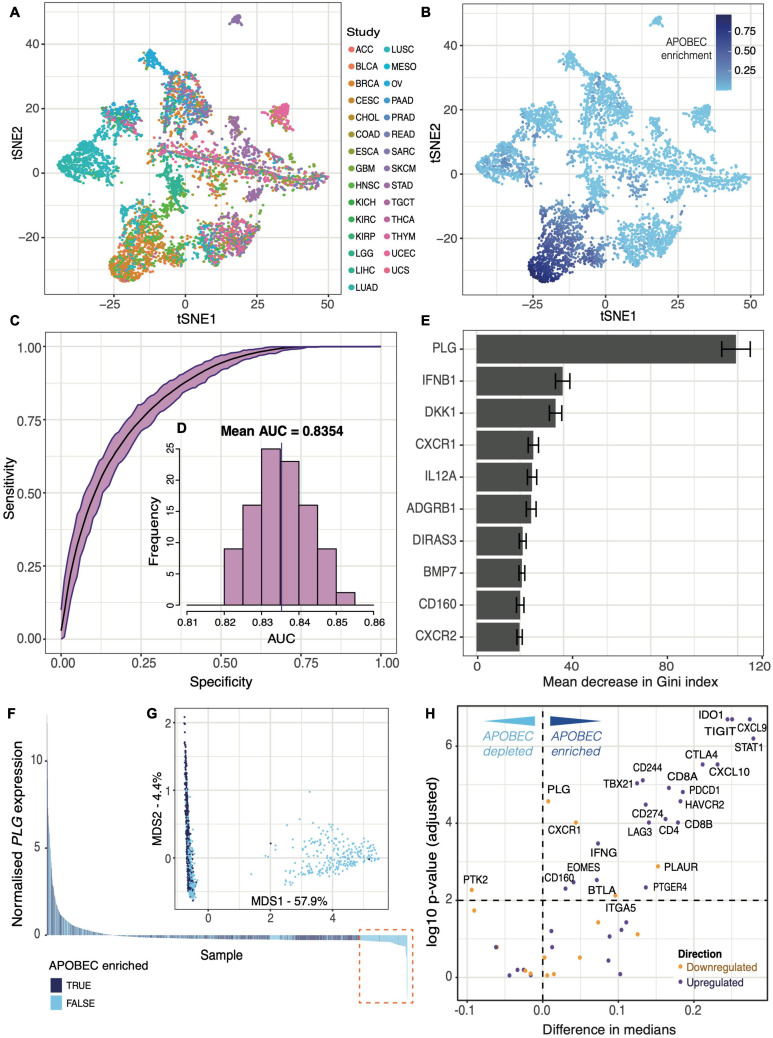
Tumor mass dormancy is the key intermediate step between immune surveillance and cancer progression, yet due to its transitory nature it has been difficult to capture and characterize. Little is understood of its prevalence across cancer types and of the mutational background that may favor such a state. While this balance is finely tuned internally by the equilibrium between cell proliferation and cell death, the main external factors contributing to tumor mass dormancy are immunological and angiogenic. To understand the genomic and cellular context in which tumor mass dormancy may develop, we comprehensively profiled signals of immune and angiogenic dormancy in 9,631 cancers from the Cancer Genome Atlas and linked them to tumor mutagenesis. We find evidence for immunological and angiogenic dormancy-like signals in 16.5% of bulk sequenced tumors, with a frequency of up to 33% in certain tissues. Mutations in the CASP8 and HRAS oncogenes were positively selected in dormant tumors, suggesting an evolutionary pressure for controlling cell growth/apoptosis signals. By surveying the mutational damage patterns left in the genome by known cancer risk factors, we found that aging-induced mutations were relatively depleted in these tumors, while patterns of smoking and defective base excision repair were linked with increased tumor mass dormancy. Furthermore, we identified a link between APOBEC mutagenesis and dormancy, which comes in conjunction with immune exhaustion and may partly depend on the expression of the angiogenesis regulator PLG as well as interferon and chemokine signals. Tumor mass dormancy also appeared to be impaired in hypoxic conditions in the majority of cancers. The microenvironment of dormant cancers was enriched in cytotoxic and regulatory T cells, as expected, but also in macrophages and showed a reduction in inflammatory Th17 signals. Finally, tumor mass dormancy was linked with improved patient survival outcomes. Our analysis sheds light onto the complex interplay between dormancy, exhaustion, APOBEC activity and hypoxia, and sets directions for future mechanistic explorations.

Keywords: APOBEC; angiogenesis; hypoxia; immunity; mutational signatures; tumor mass dormancy.


Conflict of interest statement

The authors declare that the research was conducted in the absence of any commercial or financial relationships that could be construed as a potential conflict of interest.

Figures

FIGURE 1
FIGURE 1
The pan-cancer landscape of tumor mass dormancy (TMD). (A–D) PHATE dimensionality reduction applied to 9,631 primary tumor samples based on the expression of genes within the TMD and exhaustion programs before (A) and after (B–D) removal of tissue specific expression patterns. The maps are colored by their corresponding tissue type (A,B), TMD program score (C) and TMD status (D). (E) Relationship between immunological and angiogenic program scores within individual TCGA cancer tissues. Samples are colored by their angiogenic (orange, AD), immunological (purple, ID) and tumor mass (green, A/ID) dormancy status. Samples showing no evidence of TMD (NO) are colored in dark gray, and slowly expanding tumors in light gray (MID). Horizontal and vertical dashed lines represent the upper quartile of the pan-cancer angiogenic and immunological dormancy program scores, respectively. KICH was not plotted because it lacked TMD samples. (F) Variation in TMD, immunological and angiogenic dormancy scores across primary tumor TCGA samples stratified by tissue type. The tissues are sorted by their TMD levels.
FIGURE 2
FIGURE 2
Genomic drivers and mutational processes linked with TMD. (A) Genes presenting an enrichment or depletion of mutations within high TMD samples. Blue circles represent odds ratios on a log2 scale and the confidence intervals for each of the individual Fisher’s exact tests are depicted. (B) Genes showing signals of positive selection in samples with high (purple) and low (black) TMD, as well as across both groups (yellow). (C) Matrices depicting the Person correlation between mutational signatures and the TMD, exhaustion and APOBEC programs, both pan-cancer (first 3 columns) and within individual cancer tissues. Statistically significant correlations (p < 0.05) are highlighted with an asterisk. Only signatures with at least one significant correlation are shown.
FIGURE 3
FIGURE 3
Tumor mass dormancy and exhaustion programs correlate with APOBEC transcriptional activity. (A–D) Pan-cancer correlation between the activity of the APOBEC program and (A) TMD, (B) immunological dormancy, (C) angiogenic dormancy and (D) exhaustion programs. (E–G) TMD, APOBEC, and exhaustion program scores compared between samples with angiogenic dormancy (AD), immunological dormancy (ID), both angiogenic and immunological dormancy (A/ID) and expanding tumors without evidence of TMD (NO); ****p < 0.00001. (H) Pan-cancer correlation between individual genes in the dormancy and exhaustion programs and APOBEC/AID enzyme family gene expression. Genes downregulated in the immunological and angiogenic dormancy programs are shown in red. Significant correlations are marked with an asterisk.
FIGURE 4
FIGURE 4
Tumor mass dormancy and exhaustion programs distinguish an APOBEC mutagenesis cluster. tSNE dimensionality reduction of 6,410 primary tumor samples based on single-base substitution signature profiles labeled by (A) TCGA study and (B) the total contribution of mutations from APOBEC signatures SBS2 and SBS13. (C) Receiver operating characteristic (ROC) curves of 100 random forest classifiers of APOBEC signature enrichment based on expression of genes involved in the TMD and exhaustion programs. (D) Distribution of Area Under Curve (AUC) values across all 100 random forest classifiers. (E) The top 10 ranked genes with highest importance for APOBEC signature enrichment classification, ranked by mean associated decrease in Gini index across all 100 classifiers. (F) Waterfall plot displaying samples included in an exemplary classifier ranked by normalized PLG expression, colored by APOBEC enrichment labels. The dashed orange box highlights the subset of samples with low PLG expression and marked depletion of APOBEC signatures. (G) Multidimensional scaling plot displaying samples included in the exemplary classifier. (H) Volcano plot displaying the difference in median normalized expression for each gene involved in the TMD and exhaustion programs between APOBEC-enriched and non-enriched groups, colored by anticipated direction of regulation. Differences in medians above 0 correspond to an increase in expression in the APOBEC-enriched group. Genes with a difference in median < 0 would instead be higher expressed in the non-enriched cluster (APOBEC depleted). A significance cut-off of p < 0.01 was applied after Benjamini–Hochberg multiple testing correction.
FIGURE 5
FIGURE 5
Tumor mass dormancy is reduced in the context of hypoxia. (A) Comparison of hypoxia scores across samples falling within distinct TMD categories: both angiogenic and immunological dormancy (A/ID), angiogenic dormancy (AD), immunological dormancy (ID), slowly expanding tumors (MID), expanding tumors without evidence of TMD (NO). (B,C) Distributions of dormancy status within hypoxia groups, defined by binning the hypoxia scores into intervals of 10: (B) pan-cancer, and (C) by TCGA cancer tissue, arranged in descending proportion of dormant samples. KICH was not plotted because it lacked TMD samples. (D–F) Volcano plots displaying the cancer-study-specific Pearson correlations of (D) TMD, (E) immunogenic dormancy and (F) angiogenic dormancy program scores against hypoxia scores. Cancers showing an increased dormancy in the context of hypoxia are highlighted in corresponding colors, while cancers with high dormancy in normoxic conditions are depicted in black. ****p < 0.0001.
FIGURE 6
FIGURE 6
Tumor microenvironment activity correlates with the TMD program. (A) Correlation between cell infiltration estimates and the APOBEC, exhaustion and dormancy program scores across the TCGA primary tumor samples. The three broader categories on the right hand side summarize the combined marker expression for all cytotoxic, T helper and dendritic cells. (B–D) PHATE dimensionality reduction of 9,631 primary tumor samples, based on the expression of genes driving the TMD and exhaustion programs, with removal of tissue specific expression patterns and colored by (B) cytotoxic cell enrichment score, (C) Th cell enrichment score and (D) dendritic cell enrichment score. (E) Cytotoxic T cell, Th1/Th2 and dendritic cell abundance compared between samples with angiogenic dormancy (AD), immunological dormancy (ID), both angiogenic and immunological dormancy (A/ID) and samples without TMD (NO); ****p < 0.00001.
FIGURE 7
FIGURE 7
Tumor mass dormancy is linked with better prognosis pan-cancer. (A) Overall survival compared between tumors with distinct levels of TMD: strong evidence for TMD (TMD), middle/weak evidence (MID) and no evidence (NO). The number of patients at risk for the corresponding time points are displayed below. (B) Log hazard ratios of survival for tumors with angiogenic dormancy (AD), immunological dormancy (ID), both angiogenic and immunological dormancy (A/ID) compared to the ‘NO’ dormancy category, whilst accounting for age and gender, followed by the inclusion of TCGA study, tumor stage (early/late), and both TCGA study and tumor stage.

References

    1. Aguirre Ghiso J. A. (2002). Inhibition of FAK signaling activated by urokinase receptor induces dormancy in human carcinoma cells in vivo. Oncogene 21 2513–2524. 10.1038/sj.onc.1205342 - DOI - PubMed
    1. Aguirre Ghiso J. A., Kovalski K., Ossowski L. (1999). Tumor dormancy induced by downregulation of urokinase receptor in human carcinoma involves integrin and MAPK signaling. J. Cell Biol. 147 89–104. 10.1083/jcb.147.1.89 - DOI - PMC - PubMed
    1. Aguirre-Ghiso J. A. (2007). Models, mechanisms and clinical evidence for cancer dormancy. Nat. Rev. Cancer 7 834–846. 10.1038/nrc2256 - DOI - PMC - PubMed
    1. Aguirre-Ghiso J. A., Estrada Y., Liu D., Ossowski L. (2003). ERK(MAPK) activity as a determinant of tumor growth and dormancy; regulation by p38(SAPK). Cancer Res. 63 1684–1695. - PubMed
    1. Alexandrov L. B., Jones P. H., Wedge D. C., Sale J. E., Campbell P. J., Nik-Zainal S., et al. (2015). Clock-like mutational processes in human somatic cells. Nat. Genet. 47 1402–1407. 10.1038/ng.3441 - DOI - PMC - PubMed