. 2021 Jul 2;6(28):18333-18343.
doi: 10.1021/acsomega.1c02203. eCollection 2021 Jul 20.

Development of a Rapid In Vitro Screening Assay Using Metabolic Inhibitors to Detect Highly Selective Anticancer Agents

Affiliations

Development of a Rapid In Vitro Screening Assay Using Metabolic Inhibitors to Detect Highly Selective Anticancer Agents

Felagot A Abebe et al. ACS Omega. .

Abstract

Traditional long exposure (24-72 h) cell viability assays for identification of potential drug compounds can fail to identify compounds that are: (a) biologically active but not toxic and (b) inactive without the addition of a synergistic additive. Herein, we report the development of a rapid (1-2 h) compound screening technique using a commercially available cell viability kit (CellTiter-Glo) that has led to the detection of compounds that were not identified as active agents using traditional cytotoxicity screening methods. These compounds, in combination with metabolic inhibitor 2-deoxyglucose, display selectivity toward a pancreatic cancer cell line. An evaluation of 11 mammalian cell lines against 30 novel compounds and two metabolic inhibitors is reported. The inclusion of metabolic inhibitors during an initial screening process, and not simply during mechanistic investigations of a previously identified hit compound, provides a rapid and sensitive tool for identifying drug candidates potentially overlooked by other methods.


Conflict of interest statement

The authors declare no competing financial interest.

Figures

Scheme 1
Scheme 1. ATP Production in Normal versus Cancerous Cells
Figure 1
Figure 1
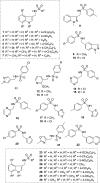
Heteroaryl N-benzyl sulfonamides 1–30.
Figure 2
Figure 2
All values are shown as POC (percent of DMSO control) and error bars represent standard deviation from duplicate experiments. CellTiter-Blue assay of compounds 1–30 performed at 100 μM using H293 cells at 24 h exposure time shown in dark blue. Coefficient of variation (% CV) calculated as 3.24%. CellTiter-Glo assay of compounds 1–30 performed at 100 μM using H293 cells at 1 h exposure time shown in yellow (% CV = 8.86%). CellTiter-Glo assay of compounds 1–30 performed at 100 μM using H293 cells at 24 h exposure time shown in light blue (% CV = 5.30%). The zone (moderate and strong) for hit detection is highlighted in green.
Figure 3
Figure 3
All values are shown as POC (percent of DMSO control) and error bars represent standard deviation from duplicate experiments. CellTiter-Glo assays performed in the presence of 2DG (10–20 mM) and/or rotenone (1.25 μM) using H293, BxPC3, HDF, and MCF10A cells, all at 1 h exposure times. The zone (moderate and strong) for hit detection is highlighted in green.
Figure 4
Figure 4
All values are shown as POC (percent of DMSO control) and error bars represent standard deviation from duplicate experiments. CellTiter-Glo assay of compounds 1–30 performed at 100 μM using H293 cells in the absence or presence of metabolic inhibitors (2DG or rotenone), all at 1 h exposure times. The coefficient of variation (% CV) of assay in the absence of metabolic inhibitors (yellow bars) is 8.86%; % CV of assay with 2DG (red bars) is 4.62%; and % CV of assay with rotenone (green bars) is 3.61%. The zone (moderate and strong) for hit detection is highlighted in green.
Figure 5
Figure 5
All values are shown as POC (percent of DMSO control) and error bars represent standard deviation from duplicate experiments. CellTiter-Blue assay of compounds 1–30 performed at 100 μM using H293 cells at 24 h exposure time shown in blue (% CV = 3.24%). CellTiter-Glo assay of compounds 1–30 performed at 100 μM with the addition of 2DG using H293 cells at 1 h exposure time shown in red (% CV = 4.62%). The zone (moderate and strong) for hit detection is highlighted in green.
Figure 6
Figure 6
Venn diagram of hit compounds (product numbers from Figure 1 are displayed) identified by each assay performed at 100 μM using H293 cells. A “hit” is defined as having a POC value <50%. CTG = CellTiter-Glo; CTB = CellTiter-Blue.
Figure 7
Figure 7
Activity of compound 5 at 100 μM in the absence and presence of metabolic inhibitors against all cell lines. All values in POC obtained from duplicate experiments (error bars indicate standard deviation) using CTG with 1 h exposure time.
Figure 8
Figure 8
Synergy analysis of library compounds 1–30 against noncancerous (HDF and MCF10A) and pancreatic cancer (BxPC3) cell lines. Ratios are obtained by dividing the POC values obtained without 2DG by that of the POC values with 2DG for each cell line and library compound. A higher ratio value indicates a stronger synergistic activity for a cell line when 2DG is present.
Figure 9
Figure 9
All values are shown as POC (percent of DMSO control) and error bars represent standard deviation from duplicate experiments. All assays shown are CellTiter-Glo with 1 h incubation time. The zone (moderate and strong) for hit detection is highlighted in green.

References

    1. American Cancer Society. Cancer Facts and Figures 2021. https://www.cancer.org/content/dam/cancer-org/research/cancer-facts-and-... (accessed March 29, 2021).
    1. Mazzarella L.; Curigliano G. A new approach to assess drug sensitivity in cells for novel drug discovery. Expert Opin. Drug Discovery 2018, 13, 339–346. 10.1080/17460441.2018.1437136. - DOI - PubMed
    1. Ediriweera M. K.; Tennekoon K. H.; Samarakoon S. R. In vitro assays and techniques utilized in anticancer drug discovery. J. Appl. Toxicol. 2019, 39, 38–71. 10.1002/jat.3658. - DOI - PubMed
    1. Menyhárt O.; Harami-Papp H.; Sukumar S.; Schafer R.; Magnani L.; de Barrios O.; Gyorffy B. Guidelines for the selection of functional assays to evaluate the hallmarks of cancer. Biochim. Biophys. Acta, Rev. Cancer 2016, 1866, 300–319. 10.1016/j.bbcan.2016.10.002. - DOI - PubMed
    1. Hsu P. P.; Sabatini D. M. Cancer cell metabolism: Warburg and beyond. Cell 2008, 134, 703–707. 10.1016/j.cell.2008.08.021. - DOI - PubMed
    2. Resendis-Antonio O.; Checa A.; Encarnacion S. Modeling core metabolism in cancer cells: surveying the topology underlying the Warburg effect. PLoS One 2010, 5, e1238310.1371/journal.pone.0012383. - DOI - PMC - PubMed
    3. Flaveny C. A.; Griffett K.; El-Gendy Bel D.; Kazantzis M.; Sengupta M.; Amelio A. L.; Chatterjee A.; Walker J.; Solt L. A.; Kamenecka T. M.; Burris T. P. Broad Anti-tumor Activity of a Small Molecule that Selectively Targets the Warburg Effect and Lipogenesis. Cancer Cell 2015, 28, 42–56. 10.1016/j.ccell.2015.05.007. - DOI - PMC - PubMed