

The impact of lockdown timing on COVID-19 transmission across US counties
- PMID: 34308301
- PMCID: PMC8283304
- DOI: 10.1016/j.eclinm.2021.101035
The impact of lockdown timing on COVID-19 transmission across US counties
Abstract
Background: Many countries have implemented lockdowns to reduce COVID-19 transmission. However, there is no consensus on the optimal timing of these lockdowns to control community spread of the disease. Here we evaluated the relationship between timing of lockdowns, along with other risk factors, and the growth trajectories of COVID-19 across 3,112 counties in the US.
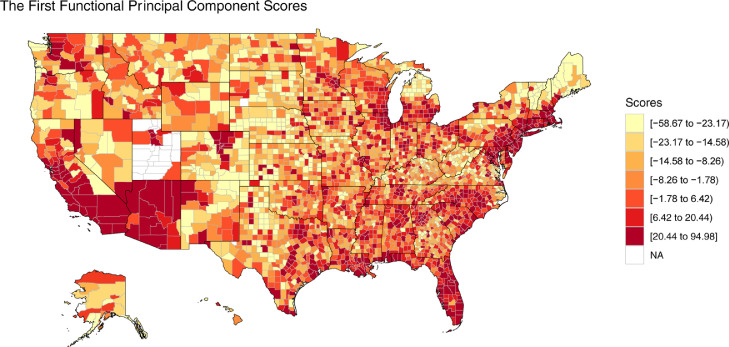
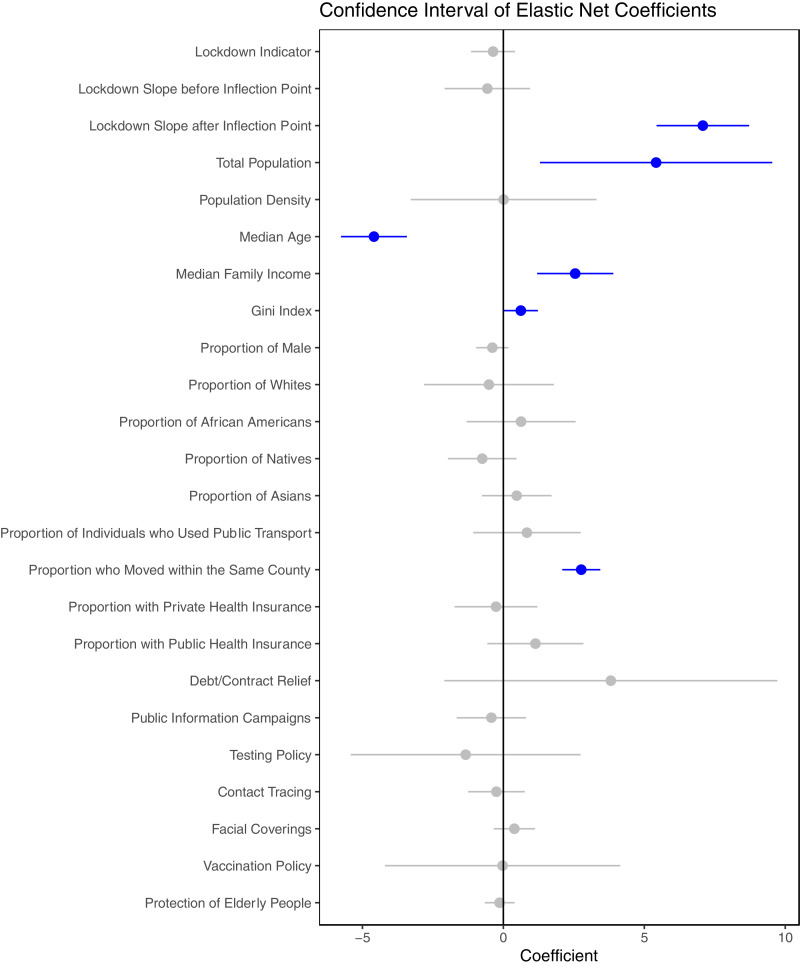
Methods: We ascertained dates for lockdowns and implementation of various non-pharmaceutical interventions at a county level and merged these data with those of US census and county-specific COVID-19 daily cumulative case counts. We then applied a Functional Principal Component (FPC) analysis on this dataset to generate FPC scores, which were used as a surrogate variable to describe the trajectory of daily cumulative case counts for each county. We used machine learning methods to identify risk factors including the timing of lockdown that significantly influenced the FPC scores.
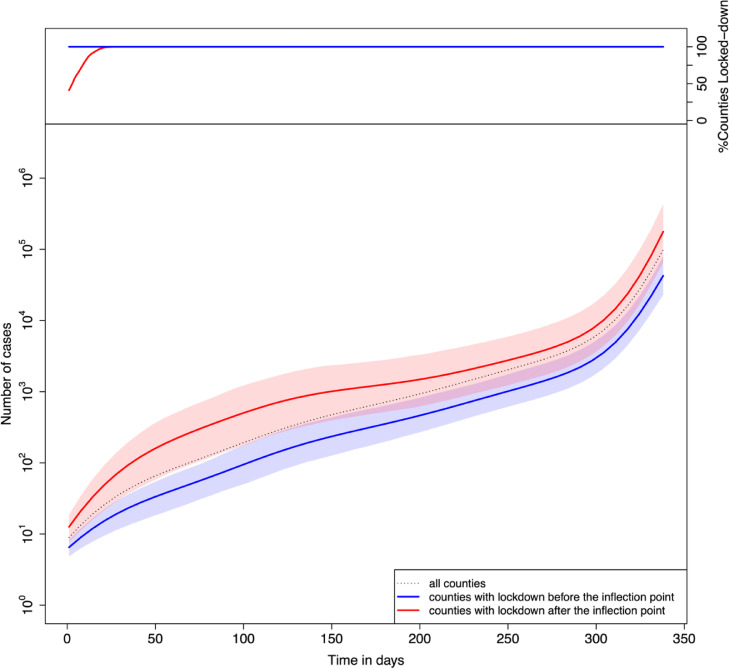
Findings: We found that the first eigen-function accounted for most (>92%) of the variations in the daily cumulative case counts. The impact of lockdown timing on the total daily case count of a county became significant beginning approximately 7 days prior to that county reporting at least 5 cumulative cases of COVID-19. Delays in lockdown implementation after this date led to a rapid acceleration of COVID-19 spread in the county over the first ~50 days from the date with at least 5 cumulative cases, and higher case counts across the entirety of the follow-up period. Other factors such as total population, median family income, Gini index, median age, and within-county mobility also had a substantial effect. When adjusted for all these factors, the timing of lockdowns was the most significant risk factor associated with the county-specific daily cumulative case counts.
Interpretation: Lockdowns are an effective way of controlling the spread of COVID-19 in communities. Significant delays in lockdown cause a dramatic increase in the cumulative case counts. Thus, the timing of the lockdown relative to the case count is an important consideration in controlling the pandemic in communities.
Funding: The study period is from June 2020 to July 2021. Dr. Xuekui Zhang is a Tier 2 Canada Research Chairs (Grant No. 950231363) and funded by Natural Sciences and Engineering Research Council of Canada (Grant No. RGPIN201704722). Dr. Li Xing is funded by Natural Sciences and Engineering Research Council of Canada (Grant Number: RGPIN 202103530). This research was enabled in part by support provided by WestGrid (www.westgrid.ca) and Compute Canada (www.computecanada.ca). The computing resource is provided by Compute Canada Resource Allocation Competitions #3495 (PI: Xuekui Zhang) and #1551 (PI: Li Xing). Dr. Don Sin is a Tier 1 Canada Research Chair in COPD and holds the de Lazzari Family Chair at the Heart Lung Innovation, Vancouver, Canada.
Keywords: Covid-19; Elastic net; Functional principal component analysis; Lockdown.
© 2021 The Author(s).
Conflict of interest statement
Dr. Zhang reports grants from Natural Sciences and Engineering Research Council of Canada, during the conduct of the study; Dr. Xing reports grants from Natural Sciences and Engineering Research Council of Canada, during the conduct of the study; Dr. Sin reports personal fees from GSK, grants and personal fees from AstraZeneca, personal fees from Boehringer Ingelheim, personal fees from Grifols, outside the submitted work; all other authors report nothing.
Figures

References
-
- Hannah Ritchie, Esteban Ortiz-Ospina, Diana Beltekian, Edouard Mathieu, Joe Hasell, Bobbie Macdonald, Charlie Giattino, Cameron Appel, Lucas Rodés-Guirao and Max Roser (2020) - "Coronavirus Pandemic (COVID-19)". Published online at OurWorldInData.org. Retrieved from: https://ourworldindata.org/coronavirus [Online Resource].
-
- Hale T., Angrist N., Goldszmidt R. A global panel database of pandemic policies (Oxford COVID-19 Government response tracker) Nat Hum Behav. 2021;5:529–538. - PubMed
LinkOut - more resources
Full Text Sources
Research Materials
Miscellaneous
