

Trends in 30-day readmissions following hospitalisation for heart failure by sex, socioeconomic status and ethnicity
- PMID: 34308315
- PMCID: PMC8283308
- DOI: 10.1016/j.eclinm.2021.101008
Trends in 30-day readmissions following hospitalisation for heart failure by sex, socioeconomic status and ethnicity
Abstract
Background: Reducing the high patient and economic burden of early readmissions after hospitalisation for heart failure (HF) has become a health policy priority of recent years.
Methods: An observational study linking Hospital Episode Statistics to socioeconomic and death data in England (2002-2018). All first hospitalisations with a primary discharge code for HF were identified. Quasi-poisson models were used to investigate trends in 30-day readmissions by age, sex, socioeconomic status and ethnicity.
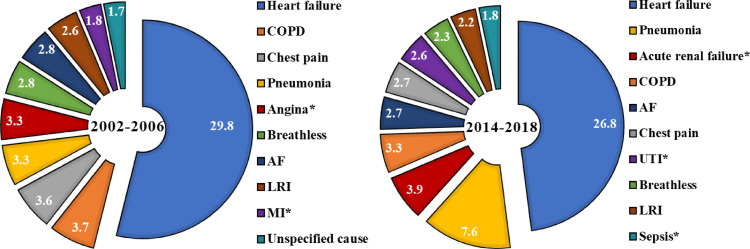
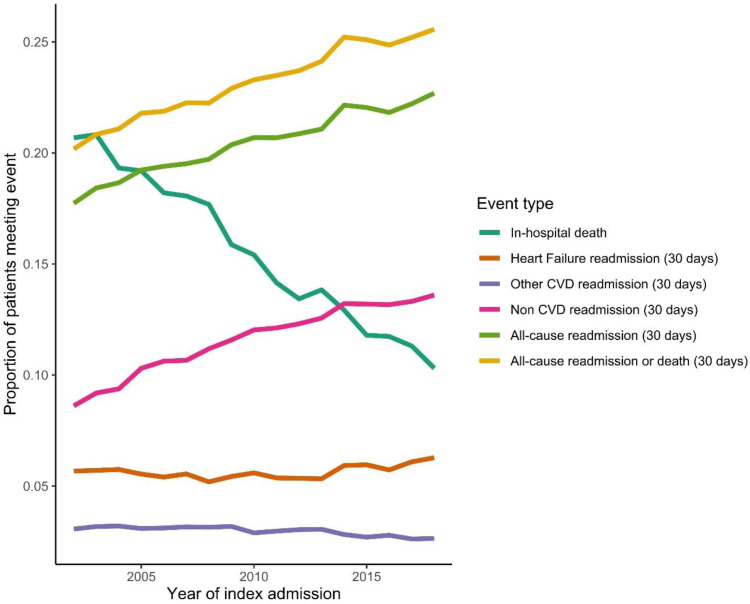
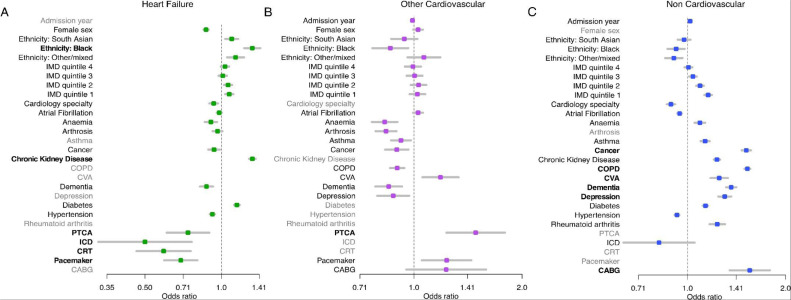
Findings: There were 698,983 HF admissions, median age 81 years [IQR 14].In-hospital deaths reduced by 0.7% per annum (pa), whilst additional deaths at 30-days remained stable at 5%. Age adjusted 30-day readmissions (21% overall), increased by 1.4% pa (95% CI 1.3-1.5). Readmissions for HF (6%) and 'other cardiovascular disease (CVD)' (3%) remained stable, but readmissions for non-CVD causes (12%) increased at a rate of 2.6% (2.4-2.7) pa. Proportions were similar by sex but trends diverged by ethnicity. Black groups experienced an increase in readmissions for HF (1.8% pa, interaction-p 0.03) and South Asian groups had more rapidly increasing readmission rates for non-CVD causes (interaction-p 0.04). Non-CVD readmissions were also more prominent in the least (15%; 15-15) compared to the most affluent group (12%; 12-12). Strongest predictors for HF readmission were Black ethnicity and chronic kidney disease, whilst cardiac procedures were protective. For non-CVD readmissions, strongest predictors were non-CVD comorbidities, whilst cardiologist care was protective.
Interpretation: In HF, despite readmission reduction policies, 30-day readmissions have increased, impacting the least affluent and ethnic minority groups the most.
Funding: NIHR.
Keywords: AF, Atrial fibrillation; CI, Confidence Interval; COPD, Chronic obstructive pulmonary disease; CRT, Cardiac resynchronisation therapy; CVA, Cerebrovascular accident; CVD, Cardiovascular disease; HES, Hospital Episode Statistics; HF, Heart failure; Heart failure; ICD, Implantable cardioverter defibrillator; IHD, Ischaemic heart disease; IMD, Index of Multiple Deprivation; MI, Myocardial infarction; ONS, Office of National Statistics; PCI, Percutaneous coronary intervention; Readmission; hospitalisation.
© 2021 The Authors.
Conflict of interest statement
Dr. Khunti reports personal fees from Amgen, Abbott, AstraZeneca, Bayer, NAPP, Lilly, Merck Sharp & Dohme, Novartis, Novo Nordisk, Roche, Berlin-Chemie AG / Menarini Group, Boehringer-Ingelheim, Sanofi-Aventis and Servier, served as a board member at Astrazeneca, Lilly, Merck Sharp & Dohme, Novo Nordisk, Sanofi-Aventis, reports grants from AstraZeneca, Novartis, Novo Nordisk, Sanofi-Aventis, Lilly, Servier, Pfizer, Boehringer Ingelheim and Merck Sharp & Dohme, outside the submitted work; Dr. Zaccardi reports and Speaker fees from Napp Pharmaceutical and Boehringer Ingelheim; Dr. Davies reports personal fees from Novo Nordisk, personal fees from Sanofi, personal fees from Eli Lilly, personal fees from Boehringer Ingelheim, personal fees from AstraZeneca, personal fees from Gilead Sciences Ltd, personal fees from Janssen, personal fees from Lexicon, personal fees from Napp Pharmaceuticals, personal fees from Takeda Pharmaceuticals International Inc., grants from AstraZeneca, grants from Novo Nordisk, grants from Boehringer Ingelheim, grants from Janssen, grants from Sanofi, outside the submitted work. All other authors declare no competing interests.
Figures
References
-
- Liao L, Allen LA, Whellan DJ. Economic Burden of Heart Failure in the Elderly. Pharmacoeconomics. 2008;26(6):447–462. - PubMed
-
- Braunstein JB, Anderson GF, Gerstenblith G, Weller W, Niefeld M, Herbert R, et al. Noncardiac comorbidity increases preventable hospitalizations and mortality among Medicare beneficiaries with chronic heart failure. J Am Coll Cardiol. 2003 Oct 1;42(7):1226–1233. - PubMed
LinkOut - more resources
Full Text Sources
Research Materials
Miscellaneous
