

Distinct roles of α- and β-tubulin polyglutamylation in controlling axonal transport and in neurodegeneration
- PMID: 34309047
- PMCID: PMC8408597
- DOI: 10.15252/embj.2021108498
Distinct roles of α- and β-tubulin polyglutamylation in controlling axonal transport and in neurodegeneration
Erratum in
-
Distinct roles of α- and β-tubulin polyglutamylation in controlling axonal transport and in neurodegeneration.EMBO J. 2022 Jun 1;41(11):e111373. doi: 10.15252/embj.2022111373. EMBO J. 2022. PMID: 35642378 Free PMC article. No abstract available.
Abstract
Tubulin polyglutamylation is a post-translational modification of the microtubule cytoskeleton, which is generated by a variety of enzymes with different specificities. The "tubulin code" hypothesis predicts that modifications generated by specific enzymes selectively control microtubule functions. Our recent finding that excessive accumulation of polyglutamylation in neurons causes their degeneration and perturbs axonal transport provides an opportunity for testing this hypothesis. By developing novel mouse models and a new glutamylation-specific antibody, we demonstrate here that the glutamylases TTLL1 and TTLL7 generate unique and distinct glutamylation patterns on neuronal microtubules. We find that under physiological conditions, TTLL1 polyglutamylates α-tubulin, while TTLL7 modifies β-tubulin. TTLL1, but not TTLL7, catalyses the excessive hyperglutamylation found in mice lacking the deglutamylase CCP1. Consequently, deletion of TTLL1, but not of TTLL7, prevents degeneration of Purkinje cells and of myelinated axons in peripheral nerves in these mice. Moreover, loss of TTLL1 leads to increased mitochondria motility in neurons, while loss of TTLL7 has no such effect. By revealing how specific patterns of tubulin glutamylation, generated by distinct enzymes, translate into specific physiological and pathological readouts, we demonstrate the relevance of the tubulin code for homeostasis.
Keywords: TTLL1; TTLL7; axonal transport; polyglutamylation; tubulin post-translational modifications.
© 2021 The Authors.
Conflict of interest statement
The authors declare that they have no conflict of interest.
Figures
- A
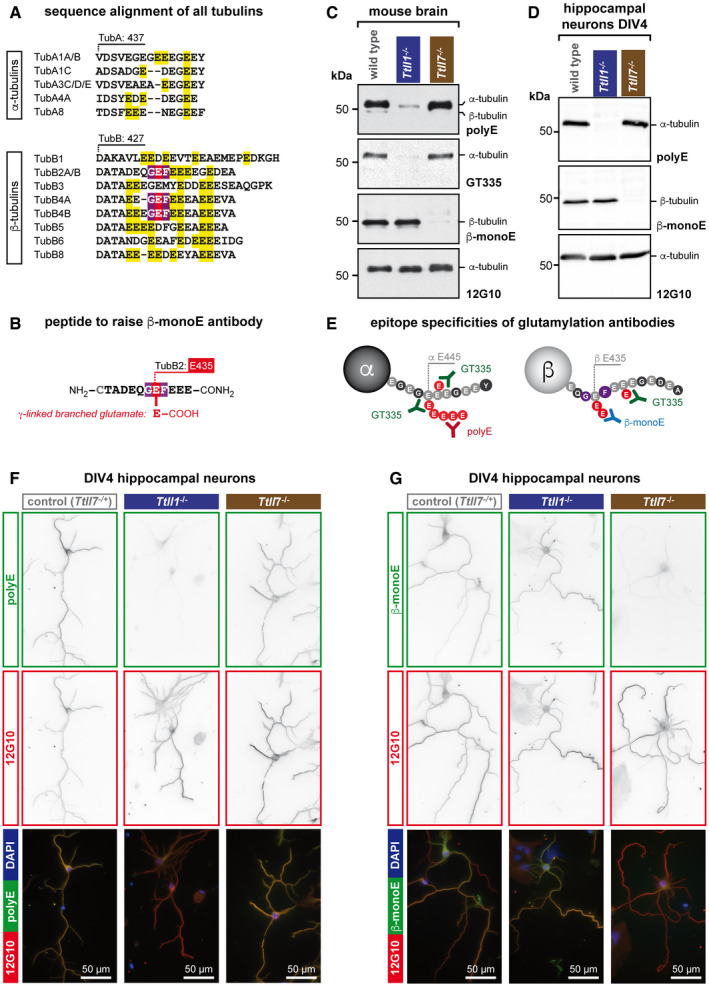
Alignment of sequences of all human α‐ and β‐tubulin isotypes. Only the C‐terminal tail region of the tubulins is shown. Isotypes with identical amino acid sequence in these regions are pooled. A large number of glutamate residues in the C‐terminal tails would, if modified by glutamylation, be detectable with GT335 (yellow), which requires one additional acidic amino acid residue after the modification site (Wolff et al, 1992). By contrast, the GEF motif (red/purple), which is the main glutamylation site in β2‐tubulin (TUBB2) in the brain (Rüdiger et al, 1992), is present only in a few β‐tubulin isotypes, but not in α‐tubulin.
- B
Schematic representation of the synthetic peptide used as antigen to raise the β‐monoE antibody. The modified glutamate residue is in red.
- C
Representative immunoblots of brain extracts of wild‐type, Ttll1 −/− and Ttll7 −/− mice. Polyglutamylation of α‐tubulin, detected with polyE and GT335, is specifically lost in Ttll1 −/− brain. By contrast, β‐tubulin glutamylation, which is specifically detected with β‐monoE, is absent from brains of Ttll7 −/− mice.
- D
Representative immunoblots of extracts of wild‐type, Ttll1 −/− and Ttll7 −/− primary hippocampal neurons at DIV4. As in brain (C), α‐tubulin polyglutamylation is specifically lost in Ttll1 −/− neurons, while β‐tubulin glutamylation lacks in Ttll7 −/− neurons.
- E
Schematic representation of the epitopes detected by the anti‐glutamylation antibodies used in this study. For clarity, α‐ and β‐tubulin are shown separately.
- F, G
Immunocytochemistry of DIV4 primary hippocampal neurons from wild‐type, Ttll1 −/− and Ttll7 −/− mice. Microtubules in Ttll1 −/− cells have reduced levels of polyE signal, indicative of lower α‐tubulin polyglutamylation (F), and Ttll7 −/− neurons are specifically reduced in β‐monoE reactivity, indicating the lack of β‐tubulin glutamylation (G).
- A
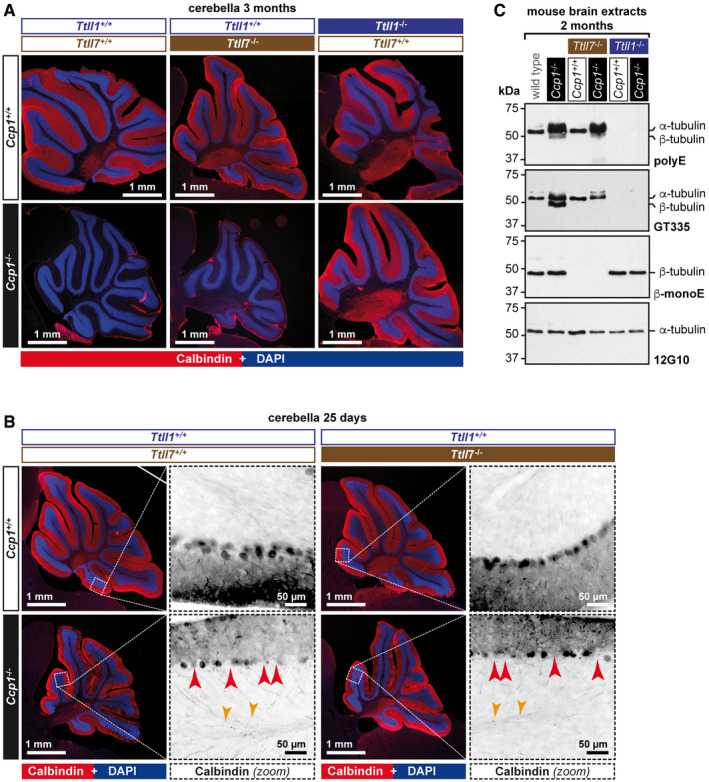
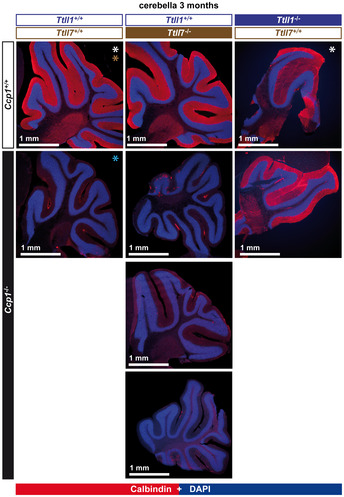
Representative histology images of cerebella from 3‐month‐old mice stained with anti‐calbindin antibody, which specifically labels Purkinje cells (Sequier et al, 1988). Note the presence of an intact Purkinje‐cell layer in cerebella of wild‐type, Ttll1 −/−, Ttll7 −/− and Ccp1 −/− Ttll1 −/− mice, in contrast to the complete absence of these cells in Ccp1 −/− and Ccp1 −/− Ttll7 −/− mice. A complete representation of all analysed cerebella is shown in Fig EV1.
- B
Histology of 25‐day‐old mice with partial degeneration of Purkinje Cells. Note that both Ccp1 −/− and Ccp1 −/− Ttll7 −/− brains show highly similar pattern of partial Purkinje‐cell loss (red arrow heads: gaps in the Purkinje‐cell layer, indicating degenerated Purkinje cells; and orange arrow heads: swellings of Purkinje‐cell axons, indicative of ongoing degeneration).
- C
Representative immunoblots of cerebellum extracts of wild‐type, Ccp1 −/−, Ttll7 −/−, Ccp1 −/− Ttll7 −/−, Ttll1 −/− and Ccp1 −/− Ttll1 −/− mice. Loss of CCP1 leads to hyperglutamylation of α‐ and β‐tubulin as revealed with polyE and GT335 antibodies. Concomitant deletion of TTLL7 leads to a loss of glutamylation from β‐tubulin (β‐monoE, GT335), while hyperglutamylation of α‐tubulin persists (polyE, GT335). Concomitant loss of CCP1 and TTLL1 eliminates hyperglutamylation from both α‐ and β‐tubulin (polyE, GT335), while β‐tubulin glutamylation is unaltered (β‐monoE).
- A
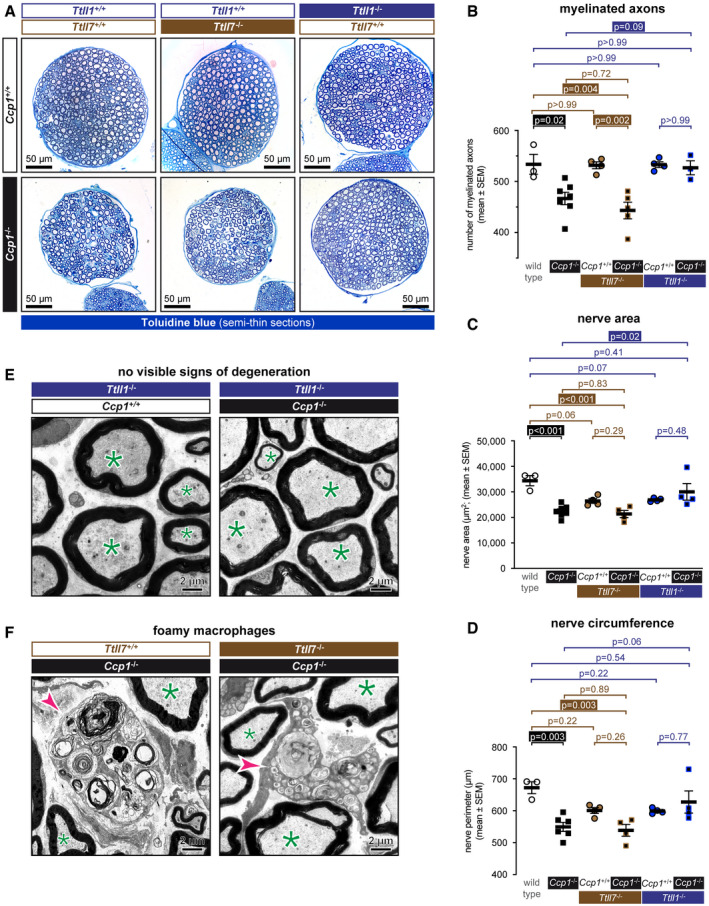
Semithin cross sections of femoral quadriceps nerves stained with alkaline methylene blue. Note the smaller size of Ccp1 −/− and Ccp1 −/− Ttll7 −/− nerves.
- B–D
Sections from (A) were quantified for (B) number of myelinated axons, (C) nerve area (D) and nerve perimeter (Fig EV2) of femoral quadriceps nerves from wild‐type, Ccp1 −/−, Ttll7 −/−, Ccp1 −/− Ttll7 −/−, Ttll1 −/− and Ccp1 −/− Ttll1 −/− mice. Scatter dot plots in which each point represents one nerve of an individual mouse are shown. The black lines indicate means ±SEM. Significance was tested with one‐way ANOVA and Holm–Šídák’s multiple comparison test. Note that all three parameters are decreased for Ccp1 −/− and Ccp1 −/− Ttll7 −/− mice, while Ccp1 −/− Ttll1 −/− mice showed no difference to the Ttll1 −/− control.
- E, F
Representative electron microscopy images of cross sections of femoral quadriceps nerves. (E) Nerves from Ttll1 −/− and Ccp1 −/− Ttll1 −/− mice show no abnormalities of myelinated axons (green asterisks), indicating that loss of TTLL1 prevents axonal degeneration caused by the absence of CCP1. (F) Ccp1 −/− and Ccp1 −/− Ttll7 −/− mice both show the presence of foamy macrophages (magenta arrowheads), which are signs for myelin phagocytosis during axon degeneration. This indicates that loss of TTLL7 cannot prevent the CCP1‐induced degeneration of femoral quadriceps nerves.
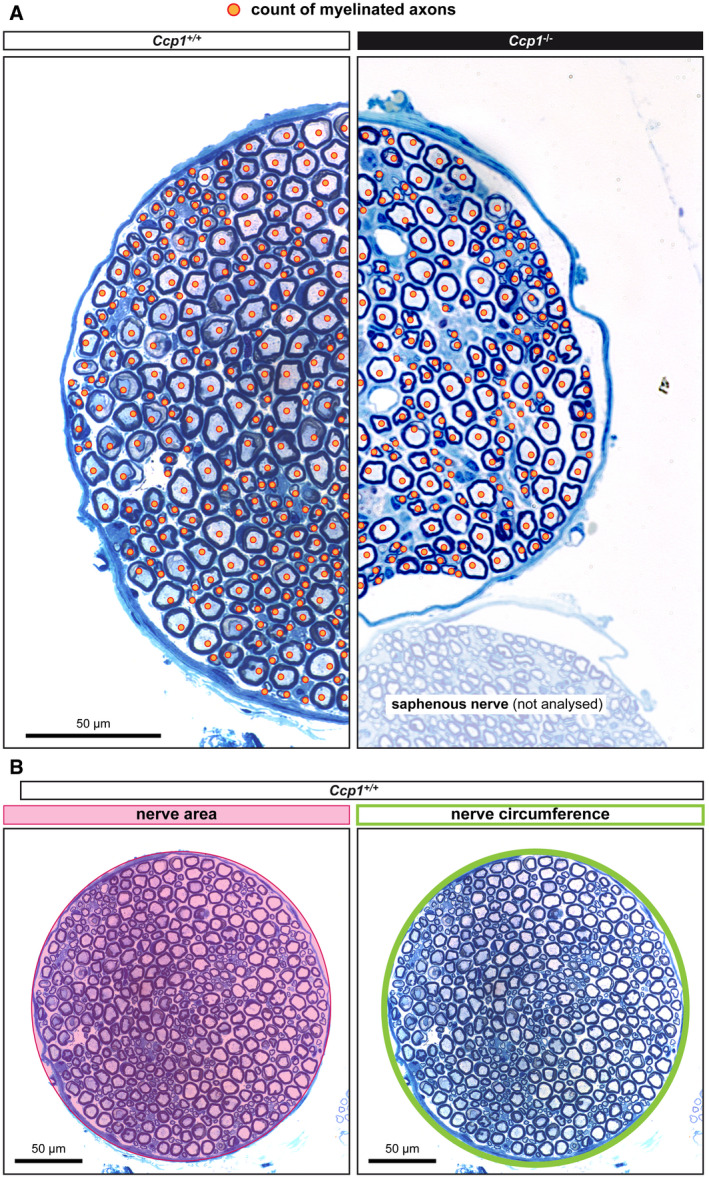
- A
Representative example of how myelinated axons, identified by orange spots, were counted. Axons of all calibres were counted.
- B
The surface and the circumference of nerves was measured as indicated.
- A
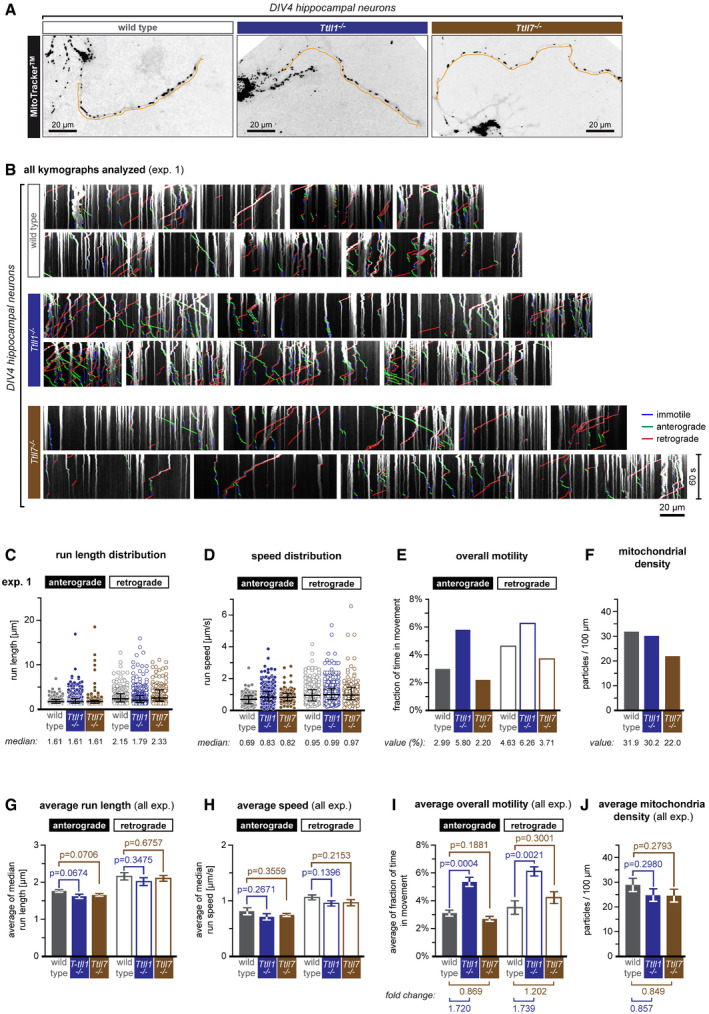
Representative images of DIV4 primary hippocampal neurons from wild‐type, Ttll1 −/− and Ttll7 −/− mice (see also Movie [Link], [Link]A). Cells were incubated with MitoTracker® (black dots), and mitochondria movements were recorded in the longest neurite (orange lines).
- B
Kymographs of one representative experiment representing mitochondrial movements (Movie [Link], [Link]B).
- C–F
Analysis of one single experiment shown in (B). Scatter dot plots of (C) run length and (D) speed distributions, where each point represents a single run extracted from the kymographs shown in (B). The black lines indicate the median of the distribution, with whiskers at interquartile range. Numerical values of medians are indicated below each plot. (E) A bar graph showing the overall motility of mitochondria (the fraction of time mitochondria spent in movement relative to the total number of mitochondria during the recording time of 60 s). (F) A bar graph showing mitochondrial density in analysed axons. Values of the overall motilities and mitochondrial densities are given below the bar plots.
- G–J
Statistical analyses of mitochondrial transport parameters of five independent experiments shown in (D–G and Fig EV3A–D). Each bar represents the mean (±SEM) of medians of single experiments for (G) run length and (H) speed distributions, and average (±SEM) (I) overall mitochondrial motility and (J) density of all five experiments. Values of fold change between control and Ttll1 −/− and Ttll7 −/− conditions are indicated below the graphs. Full bars are for anterograde, and empty bars for retrograde transport events. Significance was tested using unpaired t‐test. Average (G) run length as well as (H) speed showed no significant differences between control and Ttll1 −/− and Ttll7 −/− conditions. (I) The averages of overall motilities reveal an about 1.7‐fold increase in overall mitochondrial motility in Ttll1 −/− neurons, while no significant differences were found in Ttll7 −/− neurons. (J) Mitochondrial density was unaltered between control and knockout conditions. Total number of mitochondria analysed from five independent experiments: control (1,260), Ttll1 −/− (1,158) and Ttll7 −/− (1,191). For further statistical data on transport analyses, see Appendix Table S2.
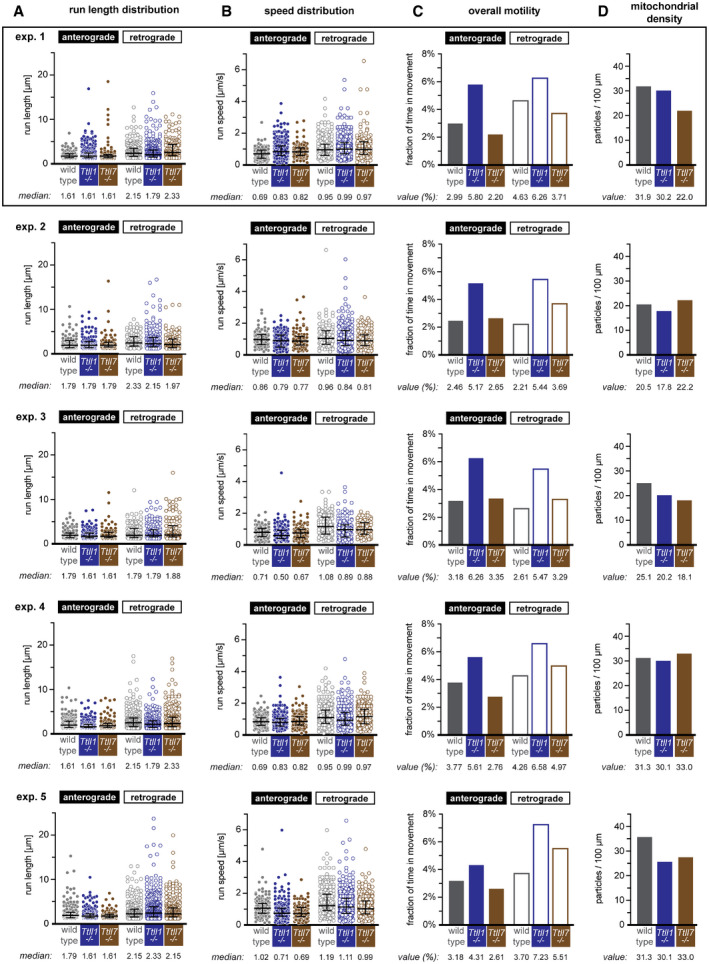
- A, B
Scattered dot plots of (A) run length and (B) speed measurements, where each point represents a single particle movement without change in direction or speed (run). The black lines indicate the median of the distribution, with whiskers at interquartile range. The numerical values of the medians are shown below each plot.
- C
Bar graphs of the overall motility (fraction of time mitochondria spent in movement relative to the total number of mitochondria present during the recording time of 60 s). Values for single experiment are shown below plots.
- D
Bar graphs of mitochondria densities (values are shown below plots).
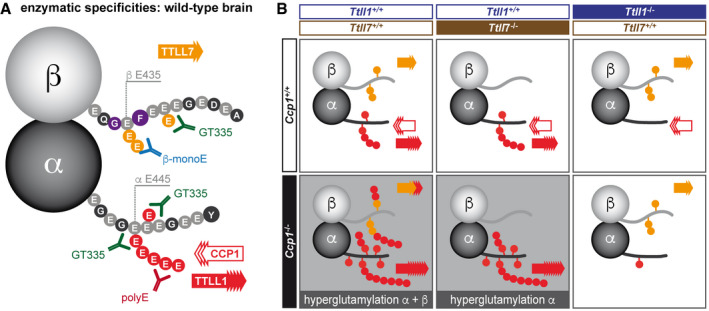
- A
Representation of the differential glutamylation of α‐ and β‐tubulin and which epitopes can be detected by the glutamylation‐specific antibodies used in this study. The most prominent tubulin isotypes in brain, α1‐ and β2‐tubulin are shown with their C‐terminal tails represented as amino acid sequences. The main modification sites, glutamates (E) 445 on α1‐tubulin (Eddé et al, 1990) and E435 on β2‐tubulin (Rüdiger et al, 1992) are indicated. However, all glutamate residues in these C‐terminal tails (light grey circles) could potentially be glutamylated. Glutamylation generated by TTLL1 is colour‐coded red, while TTLL7‐catalysed glutamylation is orange. Note that under wild‐type conditions, TTLL1 and TTLL7 exclusively modify α‐ and β‐tubulin, respectively, in brain tissue.
- B
Representation of glutamylation patterns found in the knockout mouse models studied here, and interpretation of the participation of the TTLL1, TTLL7 and CCP1 in their generation. Based on the immunoblot analysis shown in Fig 2C, it can be deduced that TTLL1 is able to hyperglutamylate both α‐ and β‐tubulin in the absence of CCP1. By contrast, loss of CCP1 in the absence of TTLL1 does not lead to hyperglutamylation, suggesting that TTLL7 is not sufficient to generate this phenotype. In this context, our observation that hyperglutamylation of β‐tubulin is abolished with TTLL7 indicates that while TTLL1 can hyperglutamylate β‐tubulin, it requires prior glutamylation by TTLL7 to do so. We thus conclude that TTLL1 specifically elongates nascent glutamate chains generated by TTLL7.
References
-
- Aillaud C, Bosc C, Peris L, Bosson A, Heemeryck P, Van Dijk J, Le Friec J, Boulan B, Vossier F, Sanman LEet al (2017) Vasohibins/SVBP are tubulin carboxypeptidases (TCPs) that regulate neuron differentiation. Science 358: 1448–1453 - PubMed
-
- Audebert S, Koulakoff A, Berwald‐Netter Y, Gros F, Denoulet P, Eddé B (1994) Developmental regulation of polyglutamylated alpha‐ and beta‐tubulin in mouse brain neurons. J Cell Sci 107: 2313–2322 - PubMed
Publication types
MeSH terms
Substances
LinkOut - more resources
Full Text Sources
Medical
Molecular Biology Databases
