

Host autophagy mediates organ wasting and nutrient mobilization for tumor growth
- PMID: 34309071
- PMCID: PMC8441431
- DOI: 10.15252/embj.2020107336
Host autophagy mediates organ wasting and nutrient mobilization for tumor growth
Abstract
During tumor growth-when nutrient and anabolic demands are high-autophagy supports tumor metabolism and growth through lysosomal organelle turnover and nutrient recycling. Ras-driven tumors additionally invoke non-autonomous autophagy in the microenvironment to support tumor growth, in part through transfer of amino acids. Here we uncover a third critical role of autophagy in mediating systemic organ wasting and nutrient mobilization for tumor growth using a well-characterized malignant tumor model in Drosophila melanogaster. Micro-computed X-ray tomography and metabolic profiling reveal that RasV12 ; scrib-/- tumors grow 10-fold in volume, while systemic organ wasting unfolds with progressive muscle atrophy, loss of body mass, -motility, -feeding, and eventually death. Tissue wasting is found to be mediated by autophagy and results in host mobilization of amino acids and sugars into circulation. Natural abundance Carbon 13 tracing demonstrates that tumor biomass is increasingly derived from host tissues as a nutrient source as wasting progresses. We conclude that host autophagy mediates organ wasting and nutrient mobilization that is utilized for tumor growth.
Keywords: Drosophila; autophagy; cancer cachexia; muscle; tumor; wasting.
© 2021 The Authors. Published under the terms of the CC BY NC ND 4.0 license.
Conflict of interest statement
EG is a Board member and a shareholder of Metabomed Ltd, Israel. NSK and HJ are employees at Genentech, Inc.
Figures
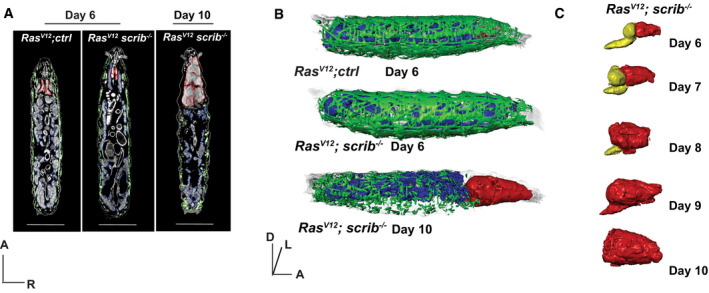
- A
Representative 2D μ‐CT scans of RasV12; ctrl at day 6, RasV12; scrib −/− larvae at day 6 and day 10. Muscle (green), fat body (blue) and eye‐antennal discs/tumor (red) are outlined. Scale bar: 1 mm. Anterior (A), Right (R).
- B
Representative 3D rendering of genotypes indicated in (A). Anterior (A), Dorsal (D), Left (L).
- C
Representative 3D rendering of RasV12; scrib −/− tumors (red) and central nervous system (yellow), over time.
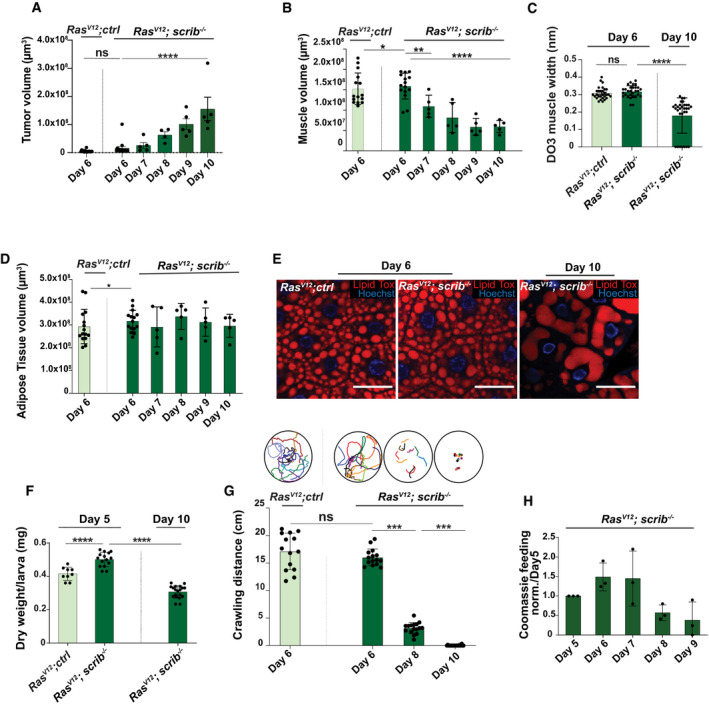
- A
Quantification of tumor growth of RasV12; ctrl day 6 (n = 15) RasV12; scrib −/− tumors, day 6 (n = 15), day 7 (n = 5), day 8 (n = 4), day 9 (n = 5), and day 10 (n = 5).
- B
Quantifications of muscle volume, of larvae carrying tumors of RasV12; ctrl (n = 15), and RasV12; scrib −/− at day 6(n = 15), day 7 (n = 5), day 8 (n = 5), day 9 (n = 5), and dat 10 (n = 5).
- C
Quantification of width of Dorsal Oblique 3 (DO3) muscle in larvae carrying tumors of RasV12; ctrl at day 6 (n = 29) and RasV12; scrib −/−at days 6 (n = 29) and day 10 (n = 31).
- D
Quantification of adipose tissue volume in larvae carrying tumors of RasV12; ctrl at day 6 and RasV12; scrib −/− at days 6 and day 10.
- E
Representative confocal images of adipose tissue in RasV12; ctrl and RasV12; scrib −/− tumors bearing animals at indicated ages. Lipid droplets are highlighted with Lipid Tox staining. Scale bar: 50 μm.
- F
Quantification of dry weight of RasV12; ctrl (n = 9), RasV12; scrib −/− day 6 (n = 15) and day 10 (n = 18) tumor‐bearing larvae excluding the tumor weight.
- G
Quantification of larval motility measure by crawling distance and crawling pattern in RasV12; ctrl (n = 14), RasV12; scrib −/− day 6 (n = 15), day 8 (n = 16), and day 10 (n = 14), each colored line represents a single larva.
- H
Coomassie feeding assay to asses food intake of RasV12; scrib −/− over time, three repeated measurements of an average food intake of 20 larvae.
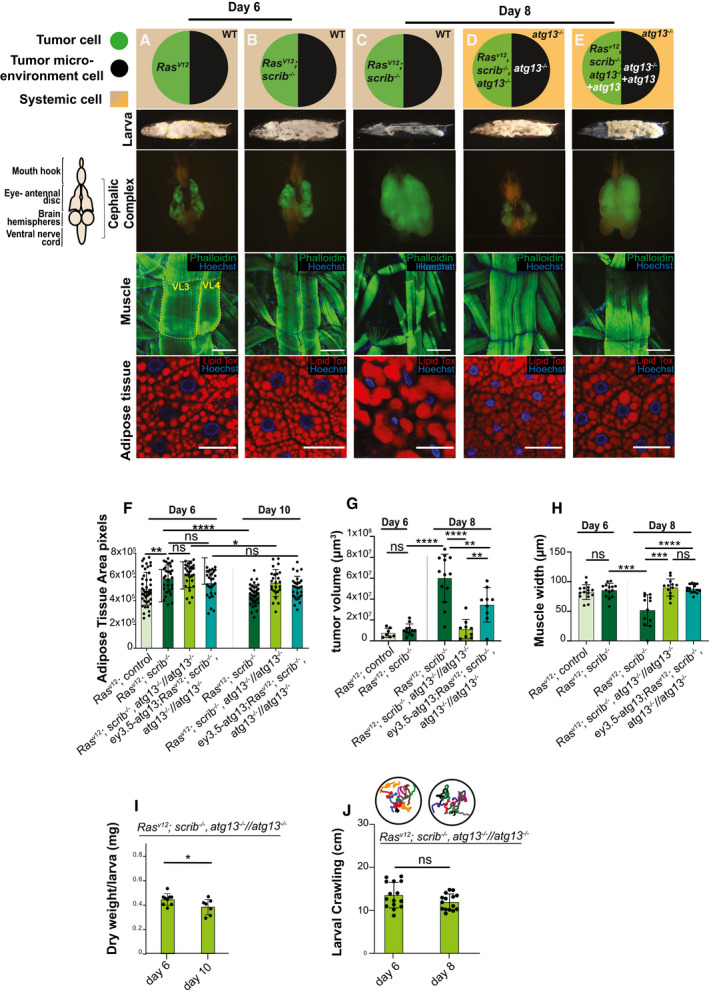
- A–E
Cartoon (top) illustrates the genotypes of the larvae, eye‐antennal disc (EAD, circle: tumor cells in green and microenvironment cell in black), systemic cells are illustrated as a square (wild‐type cells in light brown and atg13‐mutant cells in light orange) at indicated ages. Cartoon (left) illustrates the structure of cephalic complex attached to mouth hook. Representative images of Larva (image of larva using the backlight of microscope), cephalic complex (green highlights the GFP‐labeled tumor clones), muscle (Phalloidin in green stains actin and Hoechst in blue stains nucleus), and adipose tissue (Lipid Tox in red stains for lipid droplets, Hoechst stains nucleus) from top to bottom. (A) RasV12; ctrl tumor‐bearing animal at day 6. (B) RasV12; scrib −/− tumor‐bearing animal at day 6. (C) RasV12; scrib −/− tumor‐bearing animal at day 8. (D) RasV12, scrib −/− , atg13 −/− //atg13 −/− at day 8. (E) ey3.5‐atg13; RasV12; scrib −/−, atg13 −/− //atg13 −/− animal complemented with eye‐specific transgenic atg13 expression, rescuing the tumor growth, at day 8.
- F
Quantification of area of space occupied with lobes of fat body within larval segments 4 to 8 (shown in yellow dashed line in 2A), of animals bearing tumors at day 6 RasV12; ctrl (n = 45), RasV12; scrib −/− (n = 30), RasV12, scrib −/− , atg13 −/− //atg13 −/− (n = 30) and ey3.5‐atg13; RasV12, scrib −/− , atg13 −/− //atg13 −/− (n = 29) and at day 10 RasV12; scrib −/− (n = 40), RasV12, scrib −/− , atg13 −/− //atg13 −/− (n = 25) and ey3.5‐atg13; RasV12, scrib −/− , atg13 −/− //atg13 −/− (n = 28).
- G
Quantification of tumor volumes day 6 RasV12; ctrl (n = 7), RasV12; scrib −/− (n = 11) and day 8 RasV12; scrib −/− (n = 13), RasV12, scrib −/− , atg13 −/− //atg13 −/− (n = 9) and ey3.5‐atg13; RasV12, scrib −/− , atg13 −/− //atg13 −/− (n = 9).
- H
Quantification of Ventral Longitudinal muscle 4 (VL4) (shown in yellow dashed line in 2A) of third segment of larvae carrying at day 6 RasV12; ctrl (n = 15), RasV12; scrib −/− (n = 14), and at day8 RasV12; scrib −/− (n = 11), RasV12, scrib −/− , atg13 −/− //atg13 −/− (n = 12) and ey3.5‐atg13; RasV12; scrib −/− , atg13 −/− //atg13 −/− (n = 14).
- I
Quantification of dry weight excluding tumor of RasV12; scrib −/− , atg13 −/− //atg13 −/−at day 6 (n = 8) and day 10 (n = 7).
- J
Quantification of larval motility measured by crawling distance and crawling pattern for RasV12; scrib −/− , atg13 −/− //atg13 −/− at day 6 (n = 15) and at day 8 (n = 15), each colored line represents a single larva.
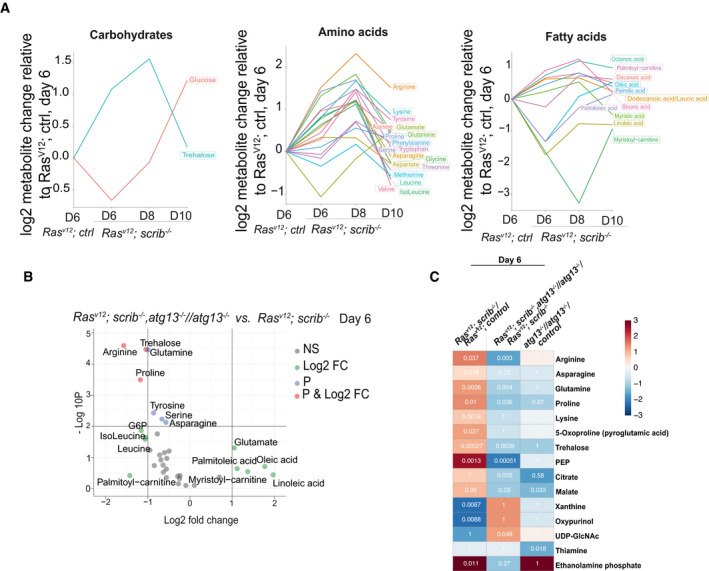
- A
Changes in groups (carbohydrates, amino acids, and fatty acids) of storage metabolites measured in circulating hemolymph with progressing wasting, shown as log2 changes measured by LC‐MS and calculated per larvae relative to RasV12; ctrl at day 6.
- B
Volcano plot showing autophagy‐dependent changes to amounts of circulating metabolites at day 6. X‐axis shows the log2 of fold change of RasV12; atg13 −/− scrib −/− // atg13 −/− vs. RasV12; scrib −/−, y‐axis shows −log10 P‐value, calculated by t‐test. Metabolite names are shown for metabolites with log2 (FC) >± 1 and/or –log10(P) < 2. Green points indicate log2 (FC) >± 1, blue indicates −log10(P) < 2, and red indicates for above both thresholds.
- C
Autophagy‐driven wasting releases metabolites into circulation of 113 reliably detected metabolites, those showing significant differences in any of the three comparisons are shown. Color indicates the log2 (fold change) difference and the numbers show the P‐value of the comparison. The statistical test to define significance was FDR‐adjusted t‐test P‐value < 0.05.
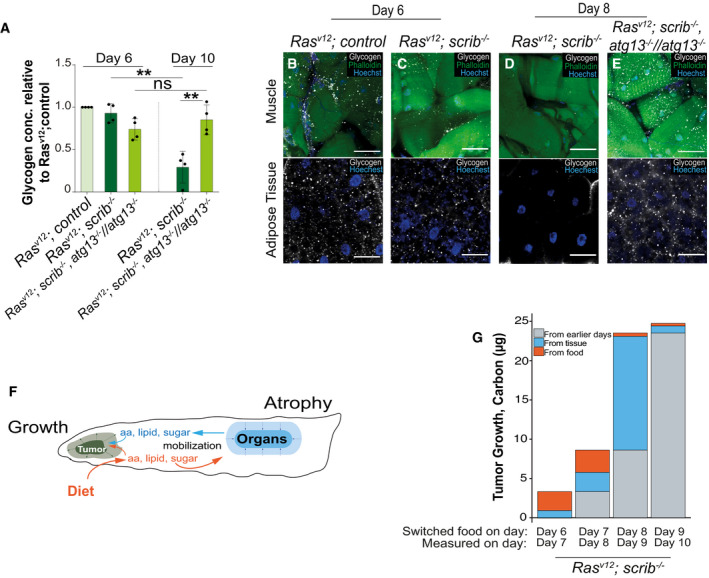
- A
The amount of glycogen in the whole larvae measured by biochemical assay (n = 4), normalized to RasV12; ctrl at day 6, and per number of larvae.
- B–E
Representative confocal images of muscle and adipose tissue of larvae carrying RasV12; ctrl, RasV12; scrib −/− and RasV12; scrib −/− , atg13 −/− //atg13 −/− showing glycogen levels (white) at day 6 and day 8.
- F
Cartoon illustrating tumor growth (green) incorporation of molecules derived from food (in orange) or from host tissues (in blue).
- G
Sources of carbon incorporated into tumor biomass were differentiated by changing the isotopic carbon content of the food source 25 h before measuring the total carbon content and isotopic ratio of the tumor. A similar, but independent experiment is reported in Holland et al (2021).
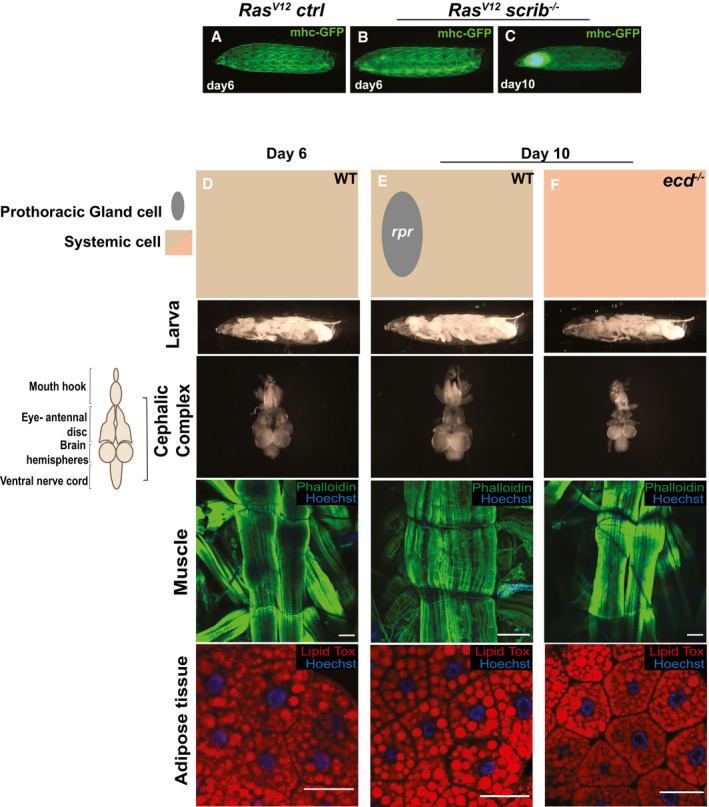
- A–C
Representative images of larvae with GFP‐labeled muscles at day 6 and 10.
- D–F
Cartoon (top) illustrates the genotypes of the larvae, prothoracic gland (gray oval), systemic cells are illustrated as a square (wild‐type cells in light brown and ecdysone mutant cells in light red) at day 6 and day 10. Cartoon (left) illustrates the structure of cephalic complex attached to mouth hook. Larva (image of larva using the backlight of microscope), cephalic complex (no tumors), muscle (Phalloidin in green stains actin and Hoechst in blue stains muscle nuclei), and adipose tissue (Lipid Tox in red stains for lipid droplets, Hoechst stains cell nuclei) from top to bottom. (D) Wild type larva (w1118) control, (E) spok‐Gal4,UAS‐Dcr2.D;UAS‐rpr larva that linger due to lack of cells expressing ecdysone hormone and (F) ecd1ts (ecdysoneless), larva that lingers due to ecdysone deficiency. Scale bar: muscle, 100 μm and adipose tissue, 50 μm.
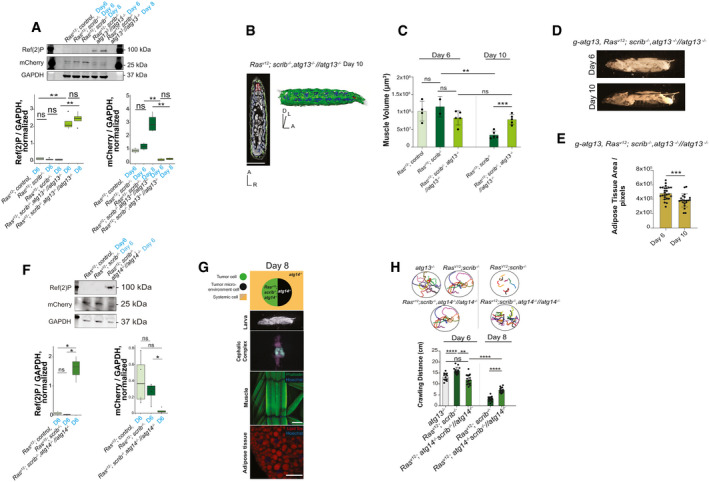
- A
Western blot analysis and quantification of Cherry‐Atg8a processing and Ref(2)P accumulation in larval body wall muscles, representative of four independent experiments. Quantifications are normalized to the mean of signals for a given band in each independent experiment. Boxplot used with default settings for geom_boxplot in R; line shows the median, boxes extending 25th percentile to 75th percentile and whiskers 1.5× of inter‐quartile range.
- B
Representative 2D μ‐CT scan and representative 3D rendering of RasV12 ; scrib −/−, atg13 −/− //atg13 −/−larva at day 10. Muscle (green), fat body (blue), and eye‐antennal discs/tumor (red), Anterior (A), Dorsal (D), Left (L), Right (R). Scale bar: 1 mm.
- C
Quantifications of muscle volumes larvae carrying at day 6 RasV12 ; ctrl (n = 4), RasV12 ; scrib −/− (n = 2), RasV12 ; scrib −/−, atg13 −/− //atg13 −/− (n = 5) and at day 10 RasV12 ; scrib −/− (n = 5), RasV12 ; scrib −/−, atg13 −/− //atg13 −/− (n = 5).
- D
Representative images of whole larva at days 6 and 10 of g‐atg13, RasV12; scrib −/− , atg13 −/− //atg13 −/−.
- E
Quantification of space within segments 4–8 occupied by white adipose tissue in a whole/intact larva, shown in pixels. g‐atg13, RasV12; scrib −/− , atg13 −/− //atg13 −/−, at day 6 (n = 25) and at day 10 (n = 21).
- F
Western blot analysis and quantification of Cherry‐Atg8a processing and Ref(2)P accumulation in larval carcass, representative of four independent experiments. Quantifications are normalized to the mean of signals for a given band in each independent experiment. Boxplot used with default settings for geom_boxplot in R; line shows the median, boxes extending 25th percentile to 75th percentile and whiskers 1.5× of inter‐quartile range.
- G
Cartoon (top) illustrates the genotypes of the larva, eye‐antennal disc (EAD, circle: tumor cells in green and microenvironment cell in black), systemic cells are illustrated as a square. Representative images of RasV12; scrib −/− , atg14 −/− //atg14 −/−larva (image of larva using the backlight of microscope), cephalic complex (green highlights the GFP‐labeled tumor clones), muscle (Phalloidin in green stains actin and Hoechst in blue stains nucleus), and adipose tissue (Lipid Tox in red stains for lipid droplets, Hoechst stains nucleus) from top to bottom. Scale bar: muscles 100 μm and adipose tissue 50 μm.
- H
Quantification of larval motility measured by crawling distance and crawling pattern for atg13 −/− larvae (n = 12), RasV12; scrib −/− (same data that shown in Fig 2). RasV12; scrib −/− , atg14 −/− //atg14 −/− at day 6 (n = 15) and at day 8 (n = 16), each colored line represents a single larva.
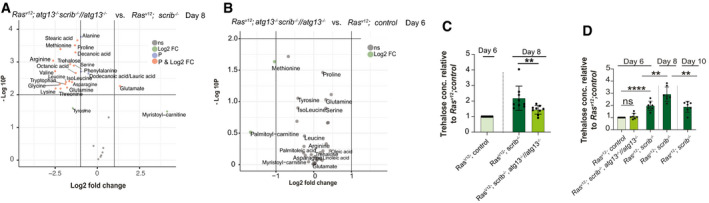
- A
Volcano plot showing autophagy‐dependent changes to amounts of circulating metabolites in wasting larvae at day 8. X‐axis shows the log2 of fold change of RasV12; scrib −/− , atg13 −/− //atg13 −/− vs. RasV12; scrib −/−, y‐axis shows −log10 P‐value, calculated by t‐test. Metabolite names are shown for metabolites with log2(FC) >± 1 and/or −log10(P) < 2. Green points indicate log2(FC) >± 1, blue indicate −log10(P) < 2, and red indicates for above both thresholds.
- B
Volcano plot showing the amounts of circulating metabolites in RasV12; scrib −/− , atg13 −/− //atg13 −/− vs. RasV12; ctrl at day 6.
- C
The amount of trehalose measured by biochemical assay in whole larvae (n = 9) in RasV12; scrib −/− and RasV12; scrib −/− , atg13 −/− //atg13 −/− at day 8, normalized to RasV12; ctrl at day 6, and per number of larvae.
- D
The amount of trehalose measured by biochemical assay of the whole larvae (n = 7), in RasV12; scrib −/− , atg13 −/− //atg13 −/− at day 6 and RasV12; scrib −/− at days 6, 8, and 10 normalized to RasV12; ctrl at day 6, and per number of larvae.
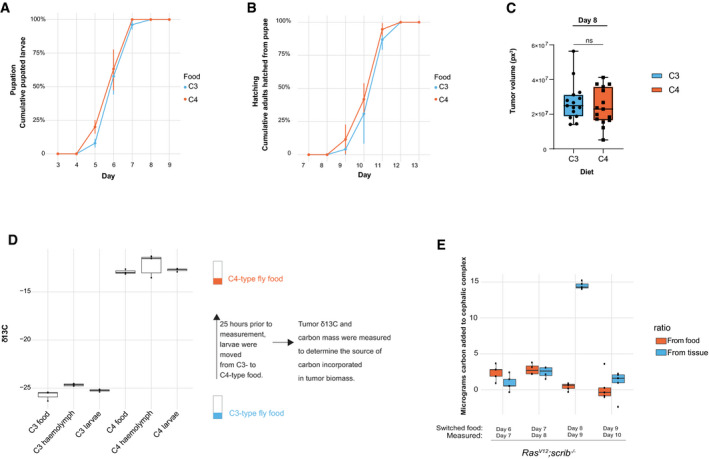
- A–C
(A, B) Animals raised on C3 (n = 74) or C4 (n = 85) type food were scored for cumulative pupation and hatching rate and (C) Day 8 tumor volume of rasV12; scrib −/− larvae (C3: n = 15, C4; n = 15). Boxes extending 25th percentile to 75th percentile and whiskers represents total range, band equals median. ns, not significant, from unpaired, two‐tailed test.
- D
δ13C (representing 13C/12C) measurements of two different food types, either with C3‐ or C4‐type plant‐derived nutrients. Measurements of whole larvae or hemolymph growing on these food types for are also shown along with a brief description of the methodology to determine the source of carbon used for tumor growth. Two measurements are shown for all samples. Boxplot used with default settings for geom_boxplot in R; line shows the median, boxes extending 25th percentile to 75th percentile and whiskers 1.5× of inter‐quartile range.
- E
Carbon incorporated into the cephalic complex biomass from food or host tissues were determined by moving rasV12; scrib −/− larvae at indicated stages tumor development from C3‐ to C4‐type food and then measuring the carbon composition as well as carbon mass 25 h later. Each time point measurement has four biological replicates. Box plot used with default settings for geom_boxplot in R; line shows the median, boxes extending 25th percentile to 75th percentile and whiskers 1.5× of inter‐quartile range.
References
-
- Baracos VE, Martin L, Korc M, Guttridge DC, Fearon KCH (2018) Cancer‐associated cachexia. Nat Rev Dis Primers 4: 17105 - PubMed
-
- Blighe K, Rana S, Lewis M (2019) EnhancedVolcano: Publication‐ready volcano plots with enhanced colouring and labeling. R package version 1.4.0. https://github.com/kevinblighe/EnhancedVolcano
Publication types
MeSH terms
Grants and funding
LinkOut - more resources
Full Text Sources
Medical
Molecular Biology Databases
