LAG3 is not expressed in human and murine neurons and does not modulate α-synucleinopathies
- PMID: 34309222
- PMCID: PMC8422075
- DOI: 10.15252/emmm.202114745
LAG3 is not expressed in human and murine neurons and does not modulate α-synucleinopathies
Abstract
While the initial pathology of Parkinson's disease and other α-synucleinopathies is often confined to circumscribed brain regions, it can spread and progressively affect adjacent and distant brain locales. This process may be controlled by cellular receptors of α-synuclein fibrils, one of which was proposed to be the LAG3 immune checkpoint molecule. Here, we analysed the expression pattern of LAG3 in human and mouse brains. Using a variety of methods and model systems, we found no evidence for LAG3 expression by neurons. While we confirmed that LAG3 interacts with α-synuclein fibrils, the specificity of this interaction appears limited. Moreover, overexpression of LAG3 in cultured human neural cells did not cause any worsening of α-synuclein pathology ex vivo. The overall survival of A53T α-synuclein transgenic mice was unaffected by LAG3 depletion, and the seeded induction of α-synuclein lesions in hippocampal slice cultures was unaffected by LAG3 knockout. These data suggest that the proposed role of LAG3 in the spreading of α-synucleinopathies is not universally valid.
Keywords: LAG3; neurodegeneration; prionoids; α-synuclein.
© 2021 The Authors. Published under the terms of the CC BY 4.0 license.
Conflict of interest statement
AA is a member of the board of directors of Mabylon AG which has funded antibody‐related work in the Aguzzi lab in the past. All other authors declare no competing interests.
Figures

Binding of eight commercial antibodies to recombinant human LAG323‐450 and murine LAG324‐442 via indirect ELISA. Seven out of eight antibodies bound either human or mouse LAG3, while one antibody (LSB15026) recognized both species.
Specific detection of murine but not human LAG3 using 4‐10‐C9 anti‐LAG3 antibody is confirmed with Western blotting.
No detection of human LAG3 in neuronal or glial cell lines of human origin. The band for LAG3 was detected in activated T cells.
No band for human LAG3 could be detected with Western blot in lysates of fully differentiated human NSC‐derived neural cultures.
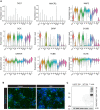
Violin plot showing the RNA expression levels of human LAG3 in human NSC‐derived neural cultures. Identities annotate different clusters: Neuronal clusters are comprised of the following markers: GAD2, GABRG1, NTRK2, NEFM, SNCG, SLC17A6, SCN2A, DDIT3/HRK. Mixed glial clusters are defined by the following markers: GFAP, S100B, STMN2, NRN1, GPM6B, COL1A1, with astrocyte‐specific clusters characterized by GFAP, S100B, GPM6B, COL1A1. LAG3 cannot be evidenced in any of the clusters beyond few random events. Data shown from 5,476 unique analysed cells from one out of two independent biological replicates.
Dopaminergic neuronal cultures from control lines and glucocerebrosidase (GBA) N370S PD patients were immunoblotted for the presence of LAG3. No band for LAG3 could be observed in neurons.
Using high power, high‐resolution laser scanning confocal microscopy, no human LAG3 signal could be detected in human neurons (Auto‐hLAG3 transduced, DOX OFF) by two different anti‐human LAG3 antibodies (17B4 and D2G40; left panel and zoomed‐in insets) whereas LAG3 was clearly detected in human neurons induced to express hLAG3 (DOX ON; right panel and zoomed‐in insets). Scale bars 25 µm.
Human brain homogenates from autopsy material were immunoblotted for the presence of LAG3. No band for LAG3 could be evidenced in any of the brain homogenates. Control samples (tonsils and activated human T cells) show expected bands.
Nuclei were isolated from 21 human dorsolateral prefrontal cortices from 16 donors, isolated and were subjected to snRNAseq. Expression levels were quantified and are shown as violin plots. The LAG3 transcripts are non‐detectable in all 34 distinct cell types, including multiple excitatory and inhibitory neurons, oligodendrocytes (ODC), oligodendrocyte precursor cell (OPC) microglia (MGL), astrocytes (AST) or endothelial cells (EC). Cluster markers as detailed in Saez‐Atienzar et al, .

Expression levels of cellular markers and control genes in human NSC‐derived neuronal cultures assessed by scRNAseq. Data shown from 5,476 unique analysed cells from one out of two independent biological replicates.
Immunofluorescence images of iPSC‐derived dopaminergic neuronal cultures from controls and PD patients with N370S mutations in GBA. Staining for DAPI and tyrosine hydroxylase (TH). Scale bar represent 100 µm.
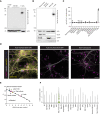
Western blotting of brain homogenates from LAG3 KO and WT mice, with activated murine T cells as controls. Anti‐LAG3 antibody LSB15026 was used.

Brain homogenates from LAG3 KO and WT mice were immunoblotted for the presence of murine LAG3. Western blot does not show a specific band other than for activated murine T cells.
Mixed neuroglial, neuron‐enriched and glial cortical cultures were assayed for the presence of LAG3 where no band could be found. Activated T cells display band at expected size.
Lysates of synaptoneurosomes (SNS) of different brain regions and mouse brain region‐specific areas as well as murine activated T cells were assayed for the presence of LAG3 with sandwich ELISA. No evidence for LAG3 could be found in any of the samples other than in activated T cells. Expression is shown in pg LAG3 per µg total protein as mean values of technical quadruplicates with 95% confidence intervals.
Using high power, high‐resolution laser scanning confocal microscopy, no mouse LAG3 signal could be detected in murine primary neuronal cultures (Auto‐mLAG3 transduced, DOX OFF and non‐transduced neurons) using anti‐mouse LAG3 antibody (MABF954) whereas LAG3 was clearly detected in primary neurons induced to express mLAG3 (Auto‐mLAG3 transduced, DOX ON). Scale bars 20 µm.
RT–qPCR‐derived CT values to measure the cDNA copy number. Mixed neuroglial cultures, glial cultures and neuron‐enriched cultures show transcript levels that are close to indistinguishable to those from LAG3−/− BH. Conversely, around 1,600 transcripts/ng of RNA were counted in activated T cells.
Murine mesencephalon and striatum of 1‐year‐old mice (n = 17 in total) were interrogated with scRNAseq. Violin plot showing expression values of Lag3, in 76,305 assigned cells, between identified cell clusters, mainly expressed in TMEM119‐positive microglia cells. Cluster markers are detailed in Russo et al, .

- A, B
IP enrichment of murine brain homogenates (A) and cultures (B). The enrichment was performed with anti‐LAG3 antibody (4‐10‐C9), and the immunoblot was done with LSB15026.
- C
Uniform Manifold Approximation and Projection (UMAP) visualization of cell clusters identified by scRNAseq of 76,305 cells derived from the mouse midbrain and striatum, with major cell types labelled.
- D
Feature plot showing distribution of Lag3 transcripts in the identified mouse cell types from the midbrain and striatum area.
- E
Lag3 transcript levels after striatal injections of PBS or LPS. LPS treatment decreases detectable transcripts, while the basal expression is already extremely low.


- A, B
Binding of ASC filaments (A) or α‐synuclein PFFs (B) to multiple proteins. Serial dilutions of ASC filaments and α‐synuclein PFFs were performed, and bound fractions were detected using anti‐ASC or anti‐α‐synuclein (MJFR1) antibodies. ASC filaments did not interact with any of the proteins (A). Conversely, α‐synuclein PFFs strongly bound LAG3, CD4 and MTBD tau and showed moderate binding properties to PrPC, APOE3 and TDP‐43. No binding between α‐synuclein PFFs and nAra h 2 or BSA could be detected. Values represent means ± SD of technical duplicates.
- C, D
Diffusional sizing of α‐synuclein PFFs with fluorescently conjugated LAG3, CD4, BSA and MJFR1 α‐synuclein antibody (C) and of fluorescently labelled LAG3 with monomeric α‐synuclein, α‐synuclein PFFs, FGL1 and Relatlimab anti‐LAG3 antibody (D). An increase in the hydrodynamic radius (Rh) of α‐synuclein PFFs is seen with increasing concentrations for MJFR1 but not for LAG3 or any of the control proteins, also not at a lower scale (see insert) (C). Similarly, the hydrodynamic radius of labelled LAG3 increases with higher concentrations of Relatlimab and FGL1 but does not change with α‐synuclein PFFs or monomeric α‐synuclein (D). Values are given as means ± SD of technical triplicates.
- E, F
Co‐immunoprecipitation of LAG3 and subsequent immunoblotting with anti‐α‐synuclein antibody (MJFR1) (E) and co‐immunoprecipitation of α‐synuclein (monomeric or PFFs) and subsequent immunoblotting with anti‐LAG3 antibody (D2G40) (F). Using the anti‐α‐synuclein antibody for pulldown resulted in LAG3 bands with both monomeric as well as fibrillar α‐synuclein. The usage of anti‐LAG3 for pulldown led to the specific detection of α‐synuclein PFFs, although the PFF fraction predominates also in the input and supernatant. Bands for α‐synuclein (E) and LAG3 (F) are indicated by arrows.

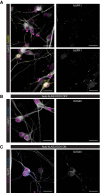
Neurons (MAP2+ cells) in human neural cultures express α‐synuclein (MJFR1).
Human neural cultures transduced with Auto‐hLAG3 LVs do not show any positivity for LAG3 (17B4) in DOX OFF condition.
Upon inducing the expression of hLAG3 (DOX ON condition), transgenic neurons display LAG3 positivity (17B4), while non‐transduced cells remain negative. Data information: Scale bars 25 µm.


Survival curves of A53T α‐synuclein TG mice, with LAG3 knockout, heterozygous LAG3 expression, or LAG3 WT. Median survival was shortest for α‐synuclein TG LAG3−/− at 239 days, followed by α‐synuclein TG LAG3+/− at 260 days and α‐synuclein TG LAG3+/+ at 268 days. The survivals of ASYNA53T LAG3−/−, LAG3+/− and LAG3+/+ mice were similar (Mantel–Cox log‐rank test, P‐value = 0.165). Mice were euthanized and dissected in the late‐stage symptomatic phase, which would inevitably result in death within a week. None of the control LAG3−/− α‐synuclein WT mice died over the course of the experiment.
Immunostaining for hyperphosphorylated α‐synuclein aggregates (pS129) and aggregated protein (Thioflavin S) in sections of end‐stage symptomatic mice; no obvious difference in terms of staining pattern or number of stained cells was apparent in midbrain or brain stem. Scale bars represent 1 mm (sagittal section) and 100 µm (panel).
Immunofluorescence staining and quantification of pS129‐positive α‐synuclein inclusions in hippocampal slice cultures (HSCs) at 5 weeks post‐seeding with 350 µM PFF. Scale bars represent 500 µm (overview), and 100 µm (insets). Shown is mean ± SEM, and individual values are shown; n = 6 cultures per group; two‐way‐ANOVA revealed for LAG3 F(1, 20) = 0.0294; P = 0.8656; A53T F(1, 20) = 36.42, P < 0.0001; interaction F(1, 20) = 0.0062, P = 0.9382. Bonferroni’s correction for multiple comparisons revealed P = 0.9973 for LAG3 WT versus KO in A53T TG and P > 0.9808 for LAG3 WT versus KO in A53T WT.
Immunofluorescence staining and quantification of Thioflavin S‐positive α‐synuclein inclusions in HSCs at 5 weeks post‐seeding. Scale bars represent 500 µm (overview), and 100 µm (insets). Shown is mean ± SEM, and individual values are shown; n = 5–6 cultures per group; two‐way‐ANOVA revealed for LAG3 F(1, 19) = 1.972, P = 0.1763; A53T F(1, 19) = 62.49, P < 0.0001; interaction F(1, 19) = 1.586, P = 0.2231. Bonferroni’s correction for multiple comparisons revealed P = 0.1373 for LAG3 WT versus KO in A53T TG and P > 0.9999 for LAG3 WT versus KO in A53T WT.
References
-
- Aguzzi A (2009) Cell biology: beyond the prion principle. Nature 459: 924–925 - PubMed
-
- Arosio P, Müller T, Rajah L, Yates EV, Aprile FA, Zhang Y, Cohen SIA, White DA, Herling TW, De Genst EJet al (2016) Microfluidic diffusion analysis of the sizes and interactions of proteins under native solution conditions. ACS Nano 10: 333–341 - PubMed
Publication types
MeSH terms
Substances
Grants and funding
- MR/N029453/1/MRC_/Medical Research Council/United Kingdom
- K-1003/PUK_/Parkinson's UK/United Kingdom
- G-1003/PUK_/Parkinson's UK/United Kingdom
- MR/P007058/1/MRC_/Medical Research Council/United Kingdom
- H-1102/PUK_/Parkinson's UK/United Kingdom
- H-1301/PUK_/Parkinson's UK/United Kingdom
- G0400144/MRC_/Medical Research Council/United Kingdom
- J-0901/PUK_/Parkinson's UK/United Kingdom
- MC_EX_MR/N50192X/1/MRC_/Medical Research Council/United Kingdom
- MR/L023784/2/MRC_/Medical Research Council/United Kingdom
- MR/M024962/1/MRC_/Medical Research Council/United Kingdom
- G-0801/PUK_/Parkinson's UK/United Kingdom
- BB/D012910/1/BB_/Biotechnology and Biological Sciences Research Council/United Kingdom
LinkOut - more resources
Full Text Sources
Medical
Molecular Biology Databases

