. 2021 Dec;19(12):2488-2500.
doi: 10.1111/pbi.13674. Epub 2021 Aug 24.

Modelling of gene loss propensity in the pangenomes of three Brassica species suggests different mechanisms between polyploids and diploids

Affiliations

Modelling of gene loss propensity in the pangenomes of three Brassica species suggests different mechanisms between polyploids and diploids

Philipp E Bayer et al. Plant Biotechnol J. 2021 Dec.

Abstract

Plant genomes demonstrate significant presence/absence variation (PAV) within a species; however, the factors that lead to this variation have not been studied systematically in Brassica across diploids and polyploids. Here, we developed pangenomes of polyploid Brassica napus and its two diploid progenitor genomes B. rapa and B. oleracea to infer how PAV may differ between diploids and polyploids. Modelling of gene loss suggests that loss propensity is primarily associated with transposable elements in the diploids while in B. napus, gene loss propensity is associated with homoeologous recombination. We use these results to gain insights into the different causes of gene loss, both in diploids and following polyploidization, and pave the way for the application of machine learning methods to understanding the underlying biological and physical causes of gene presence/absence.

Keywords: Brassica; XGBoost; gene loss propensity; machine learning; pangenome; transposable elements.


Conflict of interest statement

The authors declare no conflict of interests.

Figures

Figure 1
Figure 1
Pangenome models based on the (Golicz et al., 2016) gene number modelling method for (a) B. oleracea, (b) B. rapa, (c) B. napus (including synthetic lines) and (d) B. napus (excluding synthetic lines). Upper curves show the total pangenome after different combinations of individuals, the lower curve shows the number of core genes between all combinations of individuals.
Figure 2
Figure 2
Genes shared across B. oleracea, B. rapa and B. napus in the three assembled pangenomes. (a) B. oleracea pangenome (58 315 genes), (b) B. rapa pangenome (59 864 genes) and (c) B. napus pangenome (108 580 genes).,
Figure 3
Figure 3
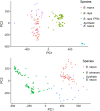
First two principal components based on PAV data of (a) A genome genes and (b) C genome genes. The PAV matrix of all B. napus genes was split into two subsets – (a) one containing only A‐genome genes and A‐genome species (B. rapa, fast‐cycling B. rapa FPSc, B. napus) and (b) one containing only C‐genome genes and C‐genome species (B. oleracea, B. napus). PCA was carried out using logistic singular value decomposition (SVD). In both cases 31% of variance was explained by the model.
Figure 4
Figure 4
Impact of model output for the prediction of gene loss propensity measured via SHAP values for three XGBoost models trained for PAV data from B. oleracea (a), B. rapa (b) and B. napus (c). High feature values are displayed in red, low in blue. Twenty attributes with the strongest impact on the model are displayed. Binary variables are 1/0 encoded, so genes with a 1 for the dispensable C01 are located on the chromosome C01. In this case, high (red colour) with high SHAP values means that the presence of a gene on this chromosome is a stronger predictor of gene dispensability. The transposable element codes follow the nomenclature of (Wicker et al., 2007): DNA/DTT = CACTA, DNA/DTM = Mutator, DNA/DTH = PIF‐Harbinger.
Figure 5
Figure 5
SHAP values as a measure of importance in predicting dispensable genes based on the genes’ position on the chromosomes in three XGBoost models trained for B. oleracea (a), B. rapa (b) and B. napus (c). The x‐axis represents the feature ‘Position on chromosome’ in Figure 4. Each line represents one chromosome. The y‐axis displays SHAP values, the higher the value, the more of an impact that gene’s position has towards the prediction of a dispensable gene. Negative SHAP values imply that this gene’s position has an impact towards the prediction of a core gene. Only on B. napus do SHAP values exceed 1, and then only at the telomeres of almost all chromosomes. In the diploids, genes located at the telomeres have negative SHAP values, i.e. their telomeres are not linked with the prediction of gene loss propensity.

Similar articles

Cited by

References

    1. Adams, K.L. , Cronn, R. , Percifield, R. and Wendel, J.F. (2003) Genes duplicated by polyploidy show unequal contributions to the transcriptome and organ‐specific reciprocal silencing. Proc. Natl Acad. Sci. USA, 100, 4649–4654. - PMC - PubMed
    1. Alexa, A. and Rahnenführer, J. (2009) Gene set enrichment analysis with topGO. Bioconductor Improve, 27, 1–26.
    1. Alix, K. , Joets, J. , Ryder, C.D. , Moore, J. , Barker, G.C. , Bailey, J.P. , King, G.J. et al. (2008) The CACTA transposon Bot1 played a major role in Brassica genome divergence and gene proliferation. Plant J. 56, 1030–1044. - PubMed
    1. Allainguillaume, J. , Alexander, M. , Bullock, J. , Saunders, M. , Allender, C.J. , King, G. , Ford, C.S. et al. (2006) Fitness of hybrids between rapeseed (Brassica napus) and wild Brassica rapa in natural habitats. Mol. Ecol. 15, 1175–1184. - PubMed
    1. Allender, C.J. and King, G.J. (2010) Origins of the amphiploid species Brassica napus L. investigated by chloroplast and nuclear molecular markers. BMC Plant Biol. 10, 54. - PMC - PubMed

Publication types

LinkOut - more resources