. 2021 Jul 26:10:e60126.
doi: 10.7554/eLife.60126.

Autoregulatory control of microtubule binding in doublecortin-like kinase 1

Affiliations

Autoregulatory control of microtubule binding in doublecortin-like kinase 1

Regina L Agulto et al. Elife. .

Abstract

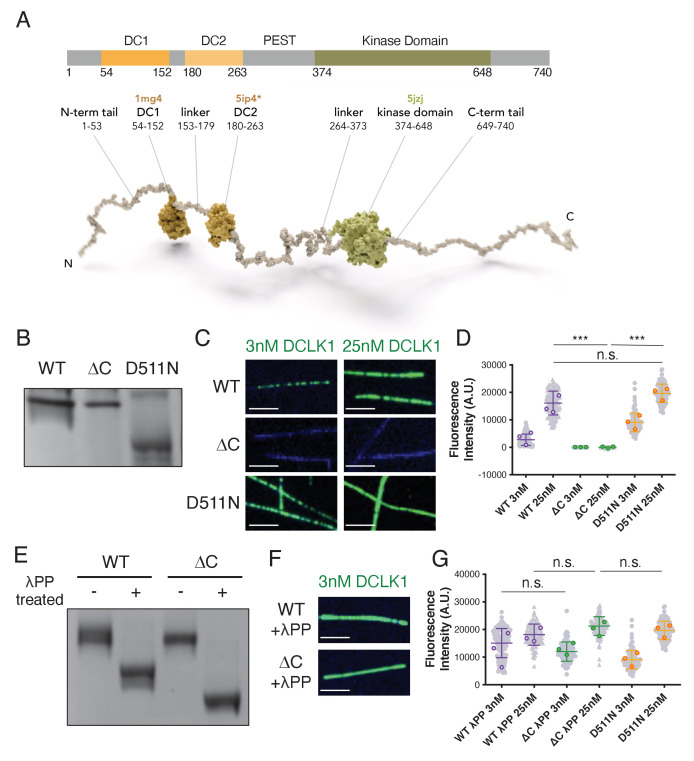
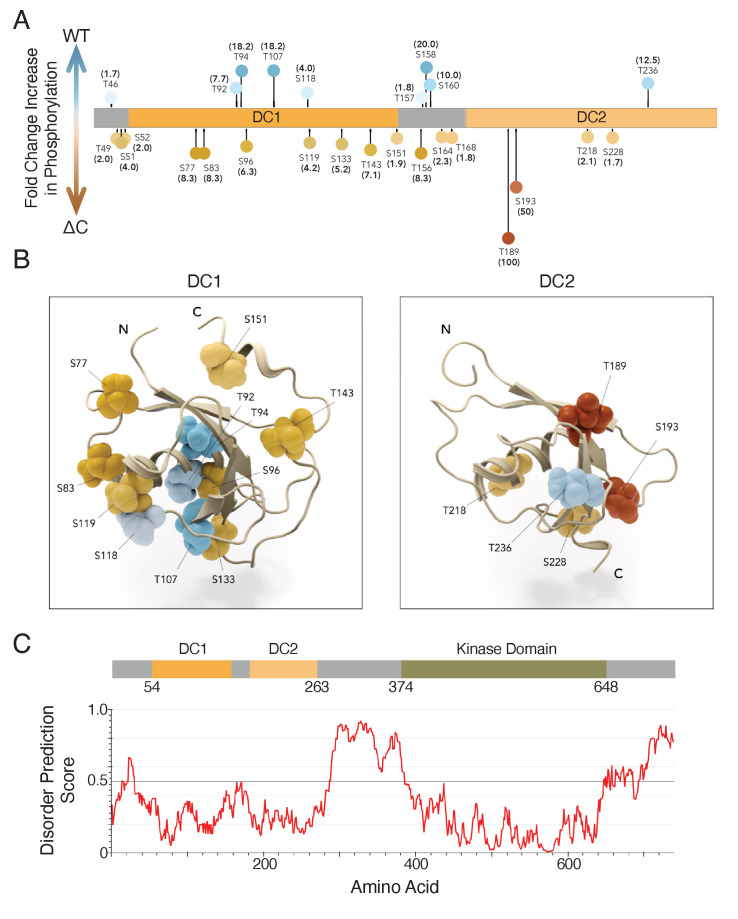
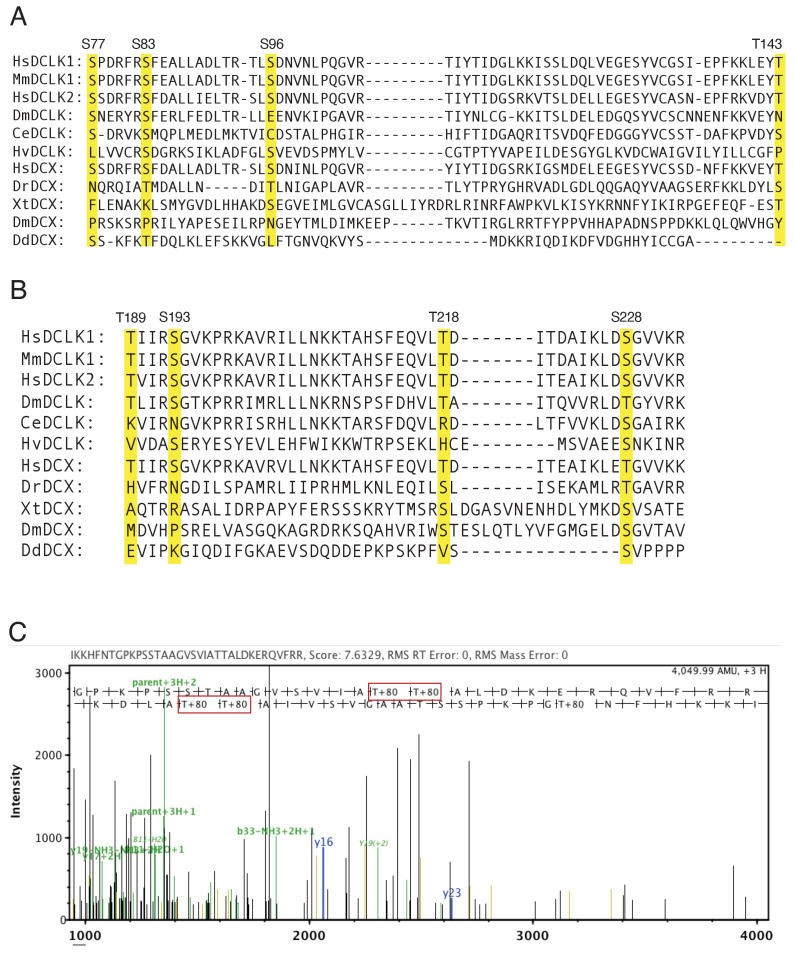
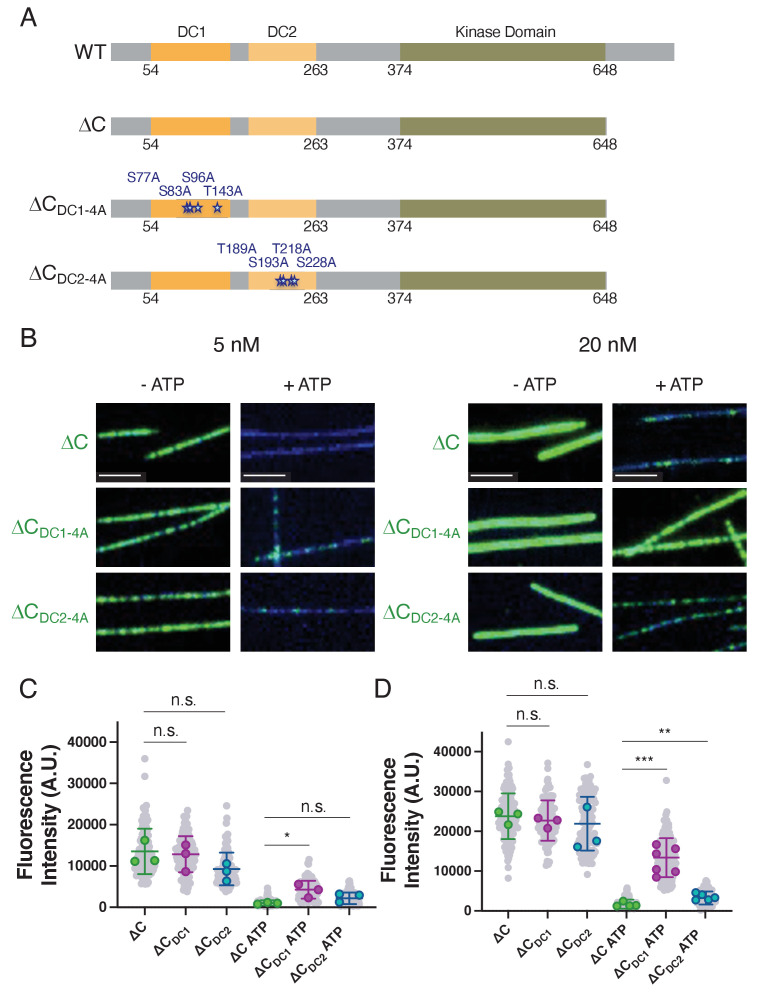
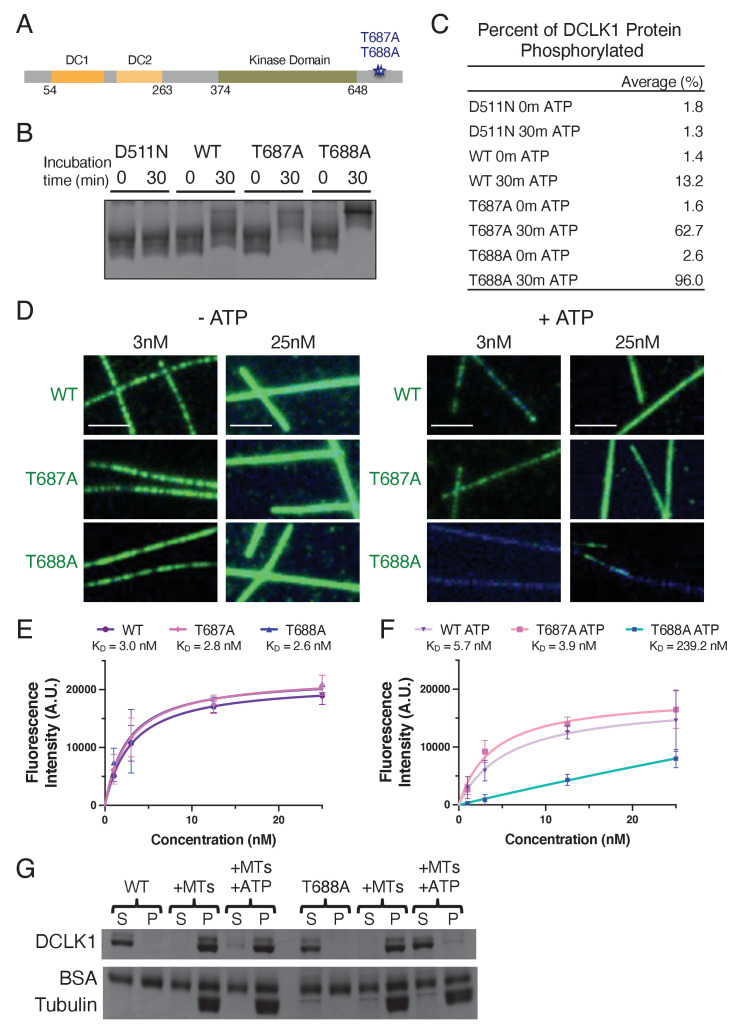
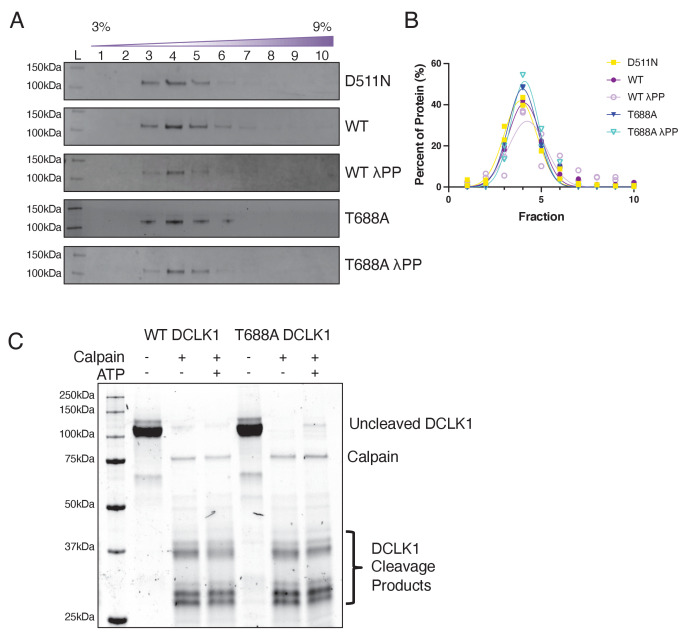
The microtubule-associated protein, doublecortin-like kinase 1 (DCLK1), is highly expressed in a range of cancers and is a prominent therapeutic target for kinase inhibitors. The physiological roles of DCLK1 kinase activity and how it is regulated remain elusive. Here, we analyze the role of mammalian DCLK1 kinase activity in regulating microtubule binding. We found that DCLK1 autophosphorylates a residue within its C-terminal tail to restrict its kinase activity and prevent aberrant hyperphosphorylation within its microtubule-binding domain. Removal of the C-terminal tail or mutation of this residue causes an increase in phosphorylation within the doublecortin domains, which abolishes microtubule binding. Therefore, autophosphorylation at specific sites within DCLK1 has diametric effects on the molecule's association with microtubules. Our results suggest a mechanism by which DCLK1 modulates its kinase activity to tune its microtubule-binding affinity. These results provide molecular insights for future therapeutic efforts related to DCLK1's role in cancer development and progression.

Keywords: MAP; autophosphorylation; biochemistry; cancer; cancer biology; chemical biology; doublecortin-like kinase 1; microtubule; microtubule-associated protein; mouse.


Conflict of interest statement

RA, MR, TT, AR, AD, HB, JC, DN No competing interests declared, KO Reviewing editor, eLife

Figures

Figure 1.
Figure 1.. The C-terminal domain of DCLK1 regulates autophosphorylation and microtubule binding.
(A) Diagram of domains and motifs of human doublecortin-like kinase 1 (DCLK1) (UniProt O15075) that are conserved in the mouse DCLK1 used in this study. DC1, N-terminal doublecortin-like (DCX) domain; DC2, C-terminal DCX domain; kinase domain. Motifs enriched in PEST (proline/P, glutamic acid/E, serine/S, threonine/T) and DEND (aspartic acid/D, glutamic acid/E, asparagine/N, aspartic acid/D) based on Burgess and Reiner, 2001 and Nagamine et al., 2011. Below: model of human DCLK1. DC1 domain (1mg4; Kim et al., 2003a), DC2 domain modeled by homology to DCX-DC2 (5ip4; Burger et al., 2016), kinase domain (5jzj; Patel et al., 2016). DCLK1 is shown as a full-length pseudo-model, with projection domains/tails (and domain linkers) modeled as unfolded to visualize the length and convey the intrinsic disorder predicted for those regions. The mouse DCLK1 (1–740) used in this paper has the same amino acid boundaries as that of humans. (B) Coomassie blue-stained sodium dodecyl sulfate-polyacrylamide gel electrophoresis (SDS-PAGE) Phos-tag gel of purified wild-type (WT), ΔC, and kinase-dead (D511N) DCLK1 proteins separated by phosphorylation level. Representative gel from n = 3 independent experiments. (C) Total internal reflection fluorescence microscopy (TIRF-M) images of 3 nM and 25 nM sfGFP-DCLK1 WT, ΔC, and D511N (green), expressed in bacteria under standard conditions, binding to taxol-stabilized microtubules (blue). Scale bars: 2.5 μm. (D) Quantification of microtubule-bound sfGFP-DCLK1 fluorescence intensity. Means ± sd: 2748.9 ± 2073.6 for 3 nM WT, 16119.6 ± 4324.3 for 25 nM WT, 1.2 ± 31.6 for 3 nM ΔC, 3.8 ± 101.9 for 25 nM ΔC, 9072.4 ± 3380.1 for 3 nM D511N, and 19666.6 ± 3345.3 for 25 nM D511N (n>100 microtubules from n = 3 independent trials for each concentration of each protein). Gray dots indicate individual microtubule intensities, while colored dots represent the averages from each trial. ***p<0.0001 and p = 0.3240 for 25 nM WT vs 25 nM D511N, calculated using Student’s t-test. p-values were calculated using n = 3. (E) Coomassie blue-stained SDS-PAGE Phos-tag gel of purified DCLK1-WT and -ΔC incubated with lambda phosphatase (λPP) or incubated in buffer alone for 1 hr at 30°C. Representative gel from n = 3 independent experiments. (F) TIRF-M images of 3 nM sfGFP-DCLK1 WT and ΔC (green) after treatment with λPP, binding to taxol-stabilized microtubules (blue). Scale bars: 2.5 μm. (G) Quantification of microtubule-bound sfGFP-DCLK1 fluorescence intensity. Means ± sd: 15090.7 ± 5285.6 for 3 nM WT + λPP, 18155.3 ± 3833.5 for 25 nM WT + λPP, 12004.2 ± 3490.3 for 3 nM ΔC + λPP, and 21240.6 ± 3413.5 for 25 nM ΔC + λPP (n>100 microtubules from n = 3 independent trials for each protein concentration; gray dots indicate individual microtubule intensities, while colored dots represent the averages from each trial.). D511N data are reproduced from (D) for comparison. p = 0.3566 for 25 nM WT + λPP vs 25 nM ΔC + λPP, p = 0.6341 for 25 nM WT + λPP vs 25 nM D511N, p = 0.5989 for 25 nM ΔC + λPP vs 25 nM D511N, and p = 0.4462 for 3 nM WT + λPP vs 3 nM ΔC + λPP, calculated using Student’s t-test. p-values were calculated using n = 3. For all experiments, at least two separate protein purifications were used.
Figure 1—figure supplement 1.
Figure 1—figure supplement 1.. Diagram of full-length DCLK1 used in this study and gels for purified recombinant proteins used in this study.
(A) Coomassie blue-stained sodium dodecyl sulfate-polyacrylamide gel electrophoresis (SDS-PAGE) gels of sfGFP-DCLK1 proteins used in this study. (B) Anion exchange elution chromatograms for wild-type doublecortin-like kinase 1 (DCLK1-WT) compared to -T687A, -T688A, and -D511N (left) and DCLK1-ΔC compared to ∆CDC1-4A and ∆CDC2-4A (right), showing that all proteins elute in a homogenous peak at approximately the same ionic strength, revealing that they are similarly folded. (C) Anion exchange elution chromatograms for DCLK1-WT and DCLK1-ΔC prepped in the presence or absence of lambda phosphatase (λPP). The non-phosphorylated proteins (+λPP) elute at a lower ionic strength consistent with a lower net negative charge. Note the larger shift in the elution volume for the non-phosphorylated vs phosphorylated DCLK1-ΔC, indicating a more pronounced change in the net charge between the two preps.
Figure 1—figure supplement 2.
Figure 1—figure supplement 2.. DCLK1 autophosphorylates via an intramolecular mechanism.
(A) Immunoblots of strepII-sfGFP-tagged wild-type (WT) or kinase-dead (D511N) doublecortin-like kinase 1 (DCLK1) incubated in the absence or presence of ATPγS for 30 min at 37°C. DCLK1-WT, but not DCLK1-D511N, robustly autophosphorylates. (B) Immunoblots of strepII-sfGFP-tagged DCLK1-D511N incubated with an untagged version of DCLK1-WT to distinguish the proteins by size in the absence or presence of ATPγS for 30 min at 37°C. While DCLK1-WT autophosphorylated, there was still no detectable level of phosphorylation for DCLK1-D511N. For (A) and (B), primary antibodies used were mouse anti-strep (Fisher NBP243719) and rabbit anti-thiophosphate ester (Abcam ab133473). For both (A) and (B), these blots are representative images from at least n = 3 independent experiments. (C) Coomassie blue-stained sodium dodecyl sulfate-polyacrylamide gel electrophoresis (SDS-PAGE) Phos-tag gel of purified DCLK1-WT, -ΔC, and -D511N incubated with lambda phosphatase (λPP) or incubated in buffer alone for 1 hr at 30°C. Representative gel from n = 3 independent experiments. (D) Representative total internal reflection fluorescence microscopy (TIRF-M) image of 10 nM sfGFP-DCLK1-ΔC (green, co-expressed in bacteria with λPP) binding to taxol-stabilized microtubules (blue) after a 30-min incubation in the presence of 2 mM adenosine triphosphate (ATP). Scale bar: 5 μm. (E) Coomassie blue-stained SDS-PAGE shows the binding behavior of 500 nM DCLK1-WT or -ΔC in the absence or presence of 2 mM ATP in the absence or presence of 2 μM taxol-stabilized microtubules. In the absence of ATP, the percent (means ± sd) of DCLK1 that co-pelleted with microtubules was 99.3 ± 0.5% for WT and 96.3 ± 1.4% for ΔC (n = 3 independent experiments; p = 0.0250). In the presence of ATP, the percent (means ± sd) of DCLK1 that co-pelleted with microtubules was 86.2 ± 4.9% for WT and 6.9 ± 5.0% for ΔC (n = 3 independent experiments; p<0.0001). For all experiments, at least two separate protein purifications were used.
Figure 2.
Figure 2.. Hyperphosphorylation of DCLK1-ΔC prohibits microtubule binding.
(A) Coomassie blue-stained sodium dodecyl sulphate–polyacrylamide gel electrophoresis (SDS-PAGE) Phos-tag gel of purified doublecortin-like kinase 1 wild-type (DCLK1-WT) and -ΔC proteins separated by phosphorylation level. The first and fifth lanes contain DCLK1-WT and -ΔC expressed in bacteria under standard conditions. All other lanes contain DCLK1-WT and -ΔC that were co-expressed with lambda phosphatase (λPP), which was subsequently separated from DCLK1. Incubation of λPP-treated DCLK1-WT and -ΔC with 2 mM adenosine triphosphate (ATP) at the indicated times reveals a band shift, indicative of an increase in phosphorylation. (B) Quantification of the average percent of total DCLK1 protein that is phosphorylated in each condition. Averages are derived from n = 3 independent experiments. (C) Total internal reflection fluorescence microscopy (TIRF-M) images of sfGFP-DCLK1-WT and -ΔC (co-expressed in bacteria with λPP) at indicated concentrations (green) binding to taxol-stabilized microtubules (blue) after a 30-min incubation in the absence or presence of 2 mM ATP. Scale bars: 2.5 μm. (D) Quantification of microtubule-bound sfGFP-DCLK1-WT fluorescence intensity plotted against concentration after a 30-min incubation in the absence or presence of ATP (WT without ATP, KD = 2.1 nM, and WT with ATP, KD = 5.4 nM, derived from at least n = 3 independent trials per condition). (E) Quantification of microtubule-bound sfGFP-DCLK1-ΔC fluorescence intensity plotted against concentration after a 30-min incubation in the absence or presence of ATP (ΔC without ATP, KD = 3.9 nM, and ΔC with ATP, KD = 161.0 nM, derived from n = 3 independent trials). (F) TIRF-M images of 10 nM sfGFP-DCLK1-WT or -ΔC (green, co-expressed in bacteria with λPP) binding to non-stabilized GDP microtubules grown from GMPCPP seeds (blue) after a 30-min incubation in the absence or presence of 2 mM ATP. Scale bars: 2.5 μm. (G) Quantification of microtubule-bound sfGFP-DCLK1 fluorescence intensity. Means ± sd: 15004.4 ± 6503.8 for WT, 12535.9 ± 3247.5 for WT + ATP, 12111.3 ± 3534.0 for ΔC, and 1579.3 ± 866.5 for ΔC + ATP (n>60 microtubules from n = 2 independent trials for each condition; gray dots indicate individual microtubule intensities, while colored dots represent the averages from each trial; p = 0.6360 for WT vs ΔC and p = 0.0440 for WT + ATP vs ΔC + ATP, calculated using Student’s t-test; p-values were calculated using n = 2). For all experiments, at least two separate protein purifications were used.
Figure 3.
Figure 3.. DCLK1-ΔC aberrantly autophosphorylates at multiple sites within the microtubule-binding region.
(A, B) Visualization of changes in phosphorylation due to deletion of C-terminal domain. Experiment compared peptides from wild-type (WT) and ∆C constructs: data are expressed as fold-change increases in phosphorylation in one construct over the other based on the percent of total peptides that exhibited phosphorylation at a particular site (n = 751 and 637 total peptides analyzed for WT and ∆C, respectively, from n = 3 independent experiments). Darker colors indicate a higher fold change in phosphorylation; that is darker blue indicates that a site is more commonly phosphorylated in the WT construct, while darker orange indicates a site is more commonly phosphorylated in the ∆C construct. (A) Lollipop plot summarizes changes in phosphorylation (≥1.5 fold change) mapped onto a diagram of the mouse doublecortin-like kinase 1 (DCLK1) used in this study, but all listed residues are conserved in human DCLK1. (B) DC1 domain (1mg4; Kim et al., 2003a) and DC2 domain modeled by homology to DCX-DC2 (5ip4; Burger et al., 2016). Domain structures are aligned and shown as ribbon representations with labeled S/T residues visualized as CPK/balls. Level of saturation in color indicates fold change in phosphorylation of those residues: increase in WT (blue colors) and increase in ∆C (orange/red colors). (C) Architecture of DCLK1 protein with the per-residue IUPRED2A (Mészáros et al., 2018) disorder prediction score shown in the corresponding plot with a cutoff value of 0.5 indicated by the dashed line. Residues scored above this value are predicted to be disordered.
Figure 3—figure supplement 1.
Figure 3—figure supplement 1.. Dissection of the phosphorylated residues within DCLK1.
(A) Sequence alignment of the region of DC1 in DCLK or DCX, including the four amino acid residues mutated in ∆C4A-DC1 (highlighted in yellow). Amino acid boundaries: HsDCLK1: 77–143, MmDCLK1: 77–143, HsDCLK2: 92–158, DmDCLK: 178–244, CeDCLK: 232–298, HvDCLK: 173–241, HsDCX: 73–139, DrDCX: 34–97, XtDCX: 255–331, DmDCX: 189–260, and DdDCX: 43–95. (B) Sequence alignment of the region of DC2 in DCLK or DCX, including the four amino acid residues mutated in ∆C4A-DC2 (highlighted in yellow). Amino acid boundaries: HsDCLK1: 189–233, MmDCLK1: 189–233, HsDCLK2: 200–244, DmDCLK: 316–360, CeDCLK: 343–387, HvDCLK: 285–328, HsDCX: 183–227, DrDCX: 132–176, XtDCX: 383–434, DmDCX: 308–359, and DdDCX: 101–137. Hs: Homo sapiens, Mm: Mus musculus, Dm: Drosophila melanogaster, Ce: Caenorhabditis elegans, Hv: Hydra vulgaris, Dr: Danio rerio, Xt: Xenopus tropicalis, Dd: Dictyostelium discoideum. (C) Representative ion spectrum of a wild-type doublecortin-like kinase 1 (DCLK1-WT) peptide containing phosphorylation at T687 and T688 detected by liquid chromatography with tandem mass spectrometry (LC-MS/MS). The major y and b ions are labeled in the spectrum and the phosphorylated amino acids are boxed in red.
Figure 4.
Figure 4.. Phosphonull mutations within DC1 restore microtubule binding of ΔC.
(A) Diagrams depicting the domains, amino acid boundaries, and mutations relevant to the doublecortin-like kinase 1 (DCLK1) constructs used. ∆CDC1-4A indicates the four residues in DC1 that were mutated to alanines S77, S83, S96, and T143. ∆CDC2-4A indicates the four residues in DC2 that were mutated to alanines T189, S193, T218, and S228. (B) Total internal reflection fluorescence microscopy (TIRF-M) images of sfGFP-DCLK1 ΔC, ∆CDC1-4A, and ∆CDC2-4A, co-expressed in bacteria with lambda phosphatase (λPP), at indicated concentrations binding to taxol-stabilized microtubules (blue) in the absence or presence of adenosine triphosphate (ATP). Scale bars: 2.5 μm. (C) Quantification of microtubule-bound 5 nM sfGFP-DCLK1 fluorescence intensity. For 5 nM concentrations in the absence of ATP, means ± sd: 12883.5 ± 2881.6 for ΔC, 12245.5 ± 3283.0 for ∆CDC1-4A, 8552.7 ± 2097.3 for ∆CDC2-4A (n>100 microtubules per condition from n = 3 independent trials; gray dots indicate individual microtubule intensities, while colored dots represent the averages from each trial; p = 0.8128 for ΔC vs ∆CDC1-4A and p = 0.1031 for ΔC vs ∆CDC2-4A calculated using Student’s t-test; p-values were calculated using n = 3). For 5 nM concentrations in the presence of ATP, means ± sd: 987.6 ± 202.5 for ΔC + ATP, 4042.6 ± 1624.6 for ∆CDC1-4A + ATP, 2482.0 ± 1058.3 for ∆CDC2-4A + ATP (n>100 microtubules from n = 3 independent trials; gray dots indicate individual microtubule intensities, while colored dots represent the averages from each trial; p = 0.0319 for ΔC vs ∆CDC1-4A and p = 0.0742 for ΔC vs ∆CDC2-4A calculated using Student’s t-test; p-values were calculated using n = 3). (D) Quantification of microtubule-bound 20 nM sfGFP-DCLK1 fluorescence intensity. For 20 nM concentrations in the absence of ATP, means ± sd: 23634.3 ± 1725.1 for ΔC, 22277.3 ± 1334.9 for ∆CDC1-4A, 19912.2 ± 5408.6 for ∆CDC2-4A (n>100 microtubules per condition from n = 3 independent trials; gray dots indicate individual microtubule intensities, while colored dots represent the averages from each trial; p = 0.3419 for ΔC vs ∆CDC1-4A and p = 0.3196 for ΔC vs ∆CDC2-4A calculated using Student’s t-test; p-values were calculated using n = 3). For 20 nM concentrations in the presence of ATP, means ± sd: 1579.8 ± 585.1 for ΔC + ATP, 12556.9 ± 3419.9 for ∆CDC1-4A + ATP, 3503.4 ± 826.7 for ∆CDC2-4A + ATP (n>100 microtubules from n = 4, 6, and 5 independent trials for ΔC, ∆CDC1-4A, and ∆CDC2-4A, respectively; gray dots indicate individual microtubule intensities, while colored dots represent the averages from each trial; p = 0.0002 for ΔC vs ∆CDC1-4A and p = 0.0058 for ΔC vs ∆CDC2-4A calculated using Student’s t-test; p-values were calculated using n = number of independent trials as stated above). For all experiments, at least two separate protein purifications were used.
Figure 5.
Figure 5.. Normal autophosphorylation within the C-terminal domain of DCLK1 is necessary to prevent hyperphosphorylation of the rest of the molecule.
(A) Diagram depicting the domains, amino acid boundaries, and mutations in the C-terminal region relevant to the doublecortin-like kinase 1 (DCLK1) constructs used. (B) Coomassie blue-stained sodium dodecyl sulphate–polyacrylamide gel electrophoresis (SDS-PAGE) Phos-tag gel of purified kinase-dead (D511N), WT, T687A, and T688A DCLK1 proteins separated by phosphorylation level. For all experiments, DCLK1 proteins were co-expressed with lambda phosphatase (λPP), which was subsequently separated from DCLK1. Incubation of λPP-treated DCLK1 proteins with 2 mM adenosine triphosphate (ATP) at the indicated times reveals a shift in the phosphorylation level to varying degrees. (C) Quantification of the average percent of total DCLK1 protein that is phosphorylated in each condition. Averages were derived from n = 3 independent experiments. (D) Total internal reflection fluorescence microscopy (TIRF-M) images of sfGFP-DCLK1-WT, -T687A, and -T688A (co-expressed in bacteria with λPP) at indicated concentrations (green) binding to taxol-stabilized microtubules (blue) after a 30-min incubation in the absence or presence of 2 mM ATP. Scale bars: 2.5 μm. (E) Quantification of microtubule-bound sfGFP-DCLK1-WT, -T687A, and -T688A fluorescence intensity plotted against concentration after a 30-min incubation in the absence of ATP (KD = 3.0 nM, 2.8 nM, and 2.6 nM for WT, T687A, and T688A, respectively, from at least n = 3 independent trials per condition). (F) Quantification of microtubule-bound sfGFP-DCLK1-WT, -T687A, and -T688A fluorescence intensity plotted against concentration after a 30-min incubation with ATP (KD = 5.7 nM, 3.9 nM, and 239.2 nM for WT, T687A, and T688A, respectively, from at least n = 3 independent trials per condition). (G) Coomassie blue-stained SDS-PAGE shows the binding behavior of 500 nM DCLK1-WT or -T688A in the absence or presence of 2 mM ATP in the absence or presence of 2 μM taxol-stabilized microtubules. In the absence of ATP, the percent (means ± sd) of DCLK1 that co-pelleted with microtubules was 99.3 ± 0.5% for WT and 98.9 ± 1.0% for T688A (n = 3 independent experiments; p = 0.5690). In the presence of ATP, the percent (means ± sd) of DCLK1 that co-pelleted with microtubules was 86.2 ± 4.9% for WT and 7.9 ± 3.5% for T688A (n = 3 independent experiments; p<0.0001). For all experiments, at least two separate protein purifications were used.
Figure 5—figure supplement 1.
Figure 5—figure supplement 1.. DCLK1 autophosphorylation does not grossly alter protein conformation or cleavage.
(A) Coomassie blue-stained sodium dodecyl sulphate–polyacrylamide gel electrophoresis (SDS-PAGE) gels of purified doublecortin-like kinase 1 (DCLK1) proteins fractionated by sucrose density-gradient centrifugation. Representative gels from n = 2 independent experiments for each protein are shown. (B) Quantification of the average percent of DCLK1 protein in each fraction, revealing a peak in fraction 4 for all DCLK1 proteins. (C) Coomassie blue-stained SDS-PAGE gel of purified DCLK1-WT and -T688A proteins co-expressed with lambda phosphatase (λPP) in bacteria, which was first incubated either in the absence or in the presence of adenosine triphosphate (ATP) for 30 min at 25°C followed by an incubation with calpain for 15 min at 30°C. Similar band patterns are seen for each protein under each condition after cleavage with calpain. Gel is representative of n = 3 independent experiments.

References

    1. Bai J, Ramos RL, Ackman JB, Thomas AM, Lee RV, LoTurco JJ. RNAi reveals doublecortin is required for radial migration in rat neocortex. Nature Neuroscience. 2003;6:1277–1283. doi: 10.1038/nn1153. - DOI - PubMed
    1. Barisic M, Maiato H. The tubulin code: a navigation system for chromosomes during mitosis. Trends in Cell Biology. 2016;26:766–775. doi: 10.1016/j.tcb.2016.06.001. - DOI - PMC - PubMed
    1. Bechstedt S, Lu K, Brouhard GJ. Doublecortin recognizes the longitudinal curvature of the microtubule end and lattice. Current Biology. 2014;24:2366–2375. doi: 10.1016/j.cub.2014.08.039. - DOI - PubMed
    1. Bechstedt S, Brouhard GJ. Doublecortin recognizes the 13-protofilament microtubule cooperatively and tracks microtubule ends. Developmental Cell. 2012;23:181–192. doi: 10.1016/j.devcel.2012.05.006. - DOI - PMC - PubMed
    1. Burger D, Stihle M, Sharma A, Di Lello P, Benz J, D'Arcy B, Debulpaep M, Fry D, Huber W, Kremer T, Laeremans T, Matile H, Ross A, Rufer AC, Schoch G, Steinmetz MO, Steyaert J, Rudolph MG, Thoma R, Ruf A. Crystal structures of the human doublecortin C- and N-terminal domains in complex with specific antibodies. Journal of Biological Chemistry. 2016;291:16292–16306. doi: 10.1074/jbc.M116.726547. - DOI - PMC - PubMed

Publication types

MeSH terms

Substances