

Sedentary Behavior in U.S. Adults: Fall 2019
- PMID: 34310489
- PMCID: PMC8595506
- DOI: 10.1249/MSS.0000000000002751
Sedentary Behavior in U.S. Adults: Fall 2019
Abstract
Purpose: Higher levels of sedentary behavior are associated with early mortality, but the distribution of sedentary time by classes of behavior and demographic groups is poorly described in U.S. adults. To quantify the amount and sources of sedentary time in U.S. adults, we conducted a nationwide survey using a novel validated self-administered previous-day recall method and compared these values with a commonly used sitting time question.
Methods: Participants from the AmeriSpeak panel 20 to 75 yr of age (N = 2640) completed up to two activities completed over time in 24 h (ACT24) previous-day recalls. Recalls were conducted on randomly selected days in October and November 2019. Survey sample designs were applied to reflect the U.S. population.
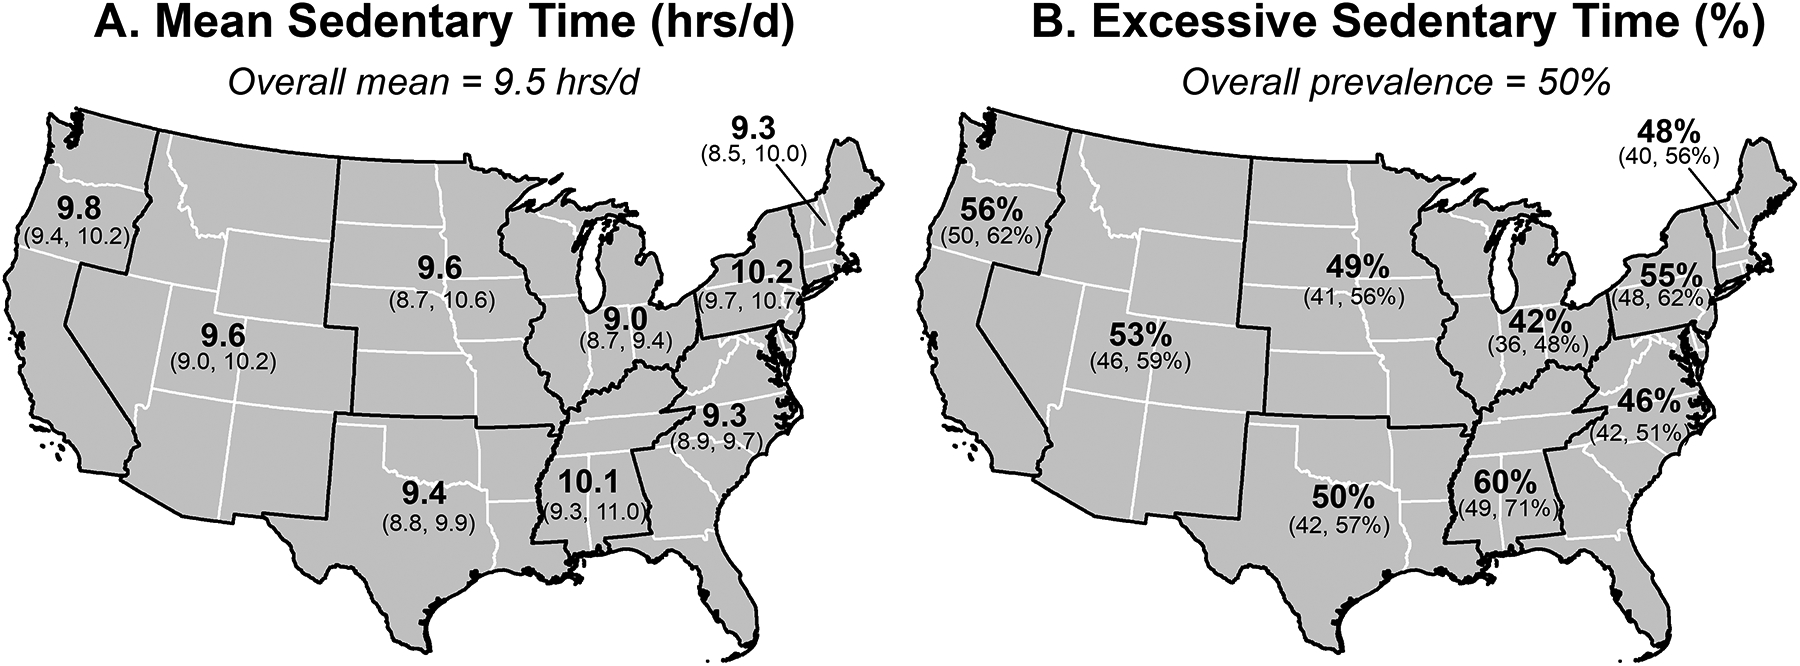
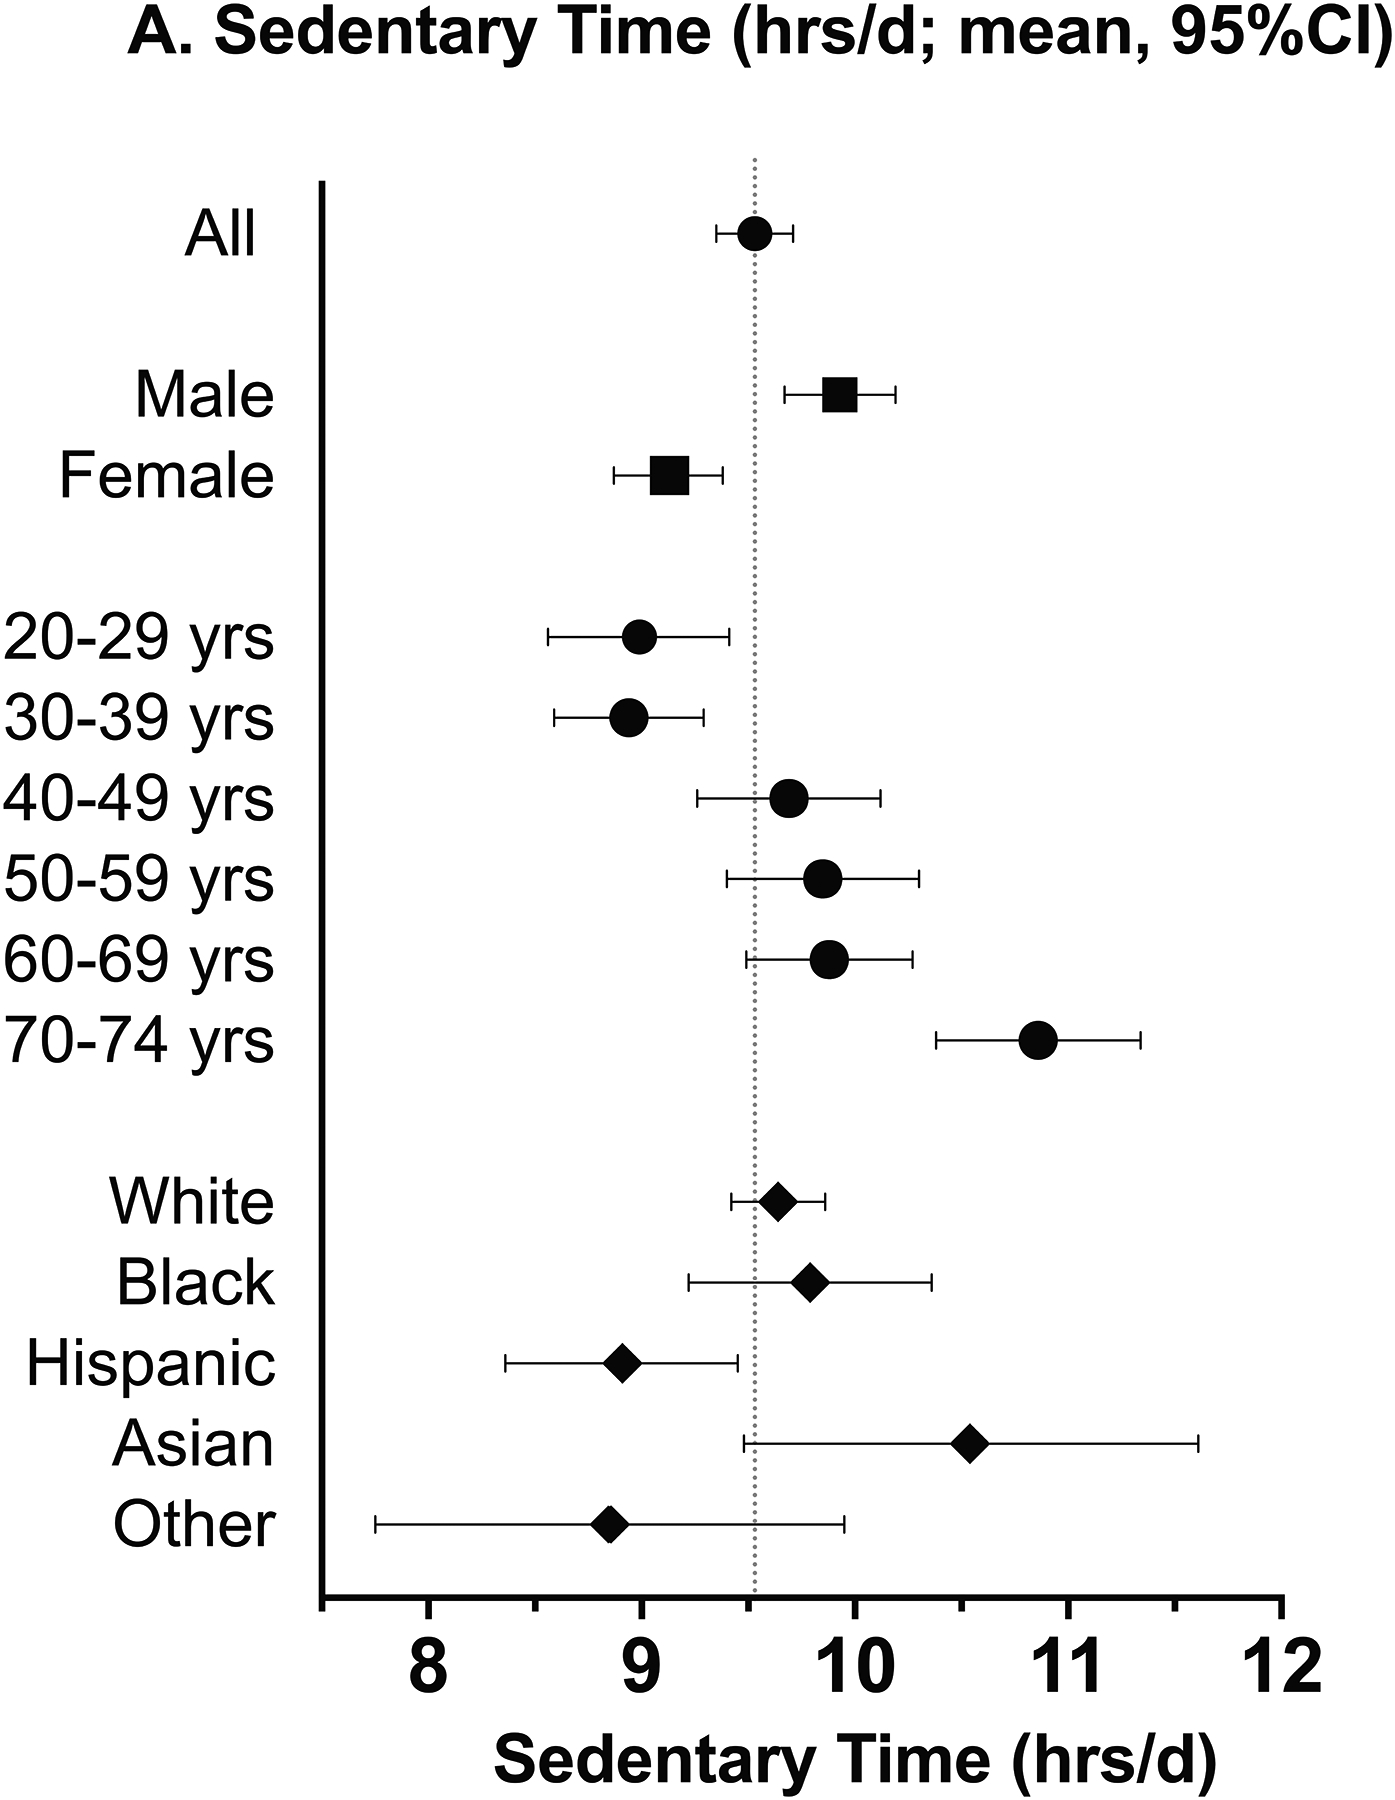
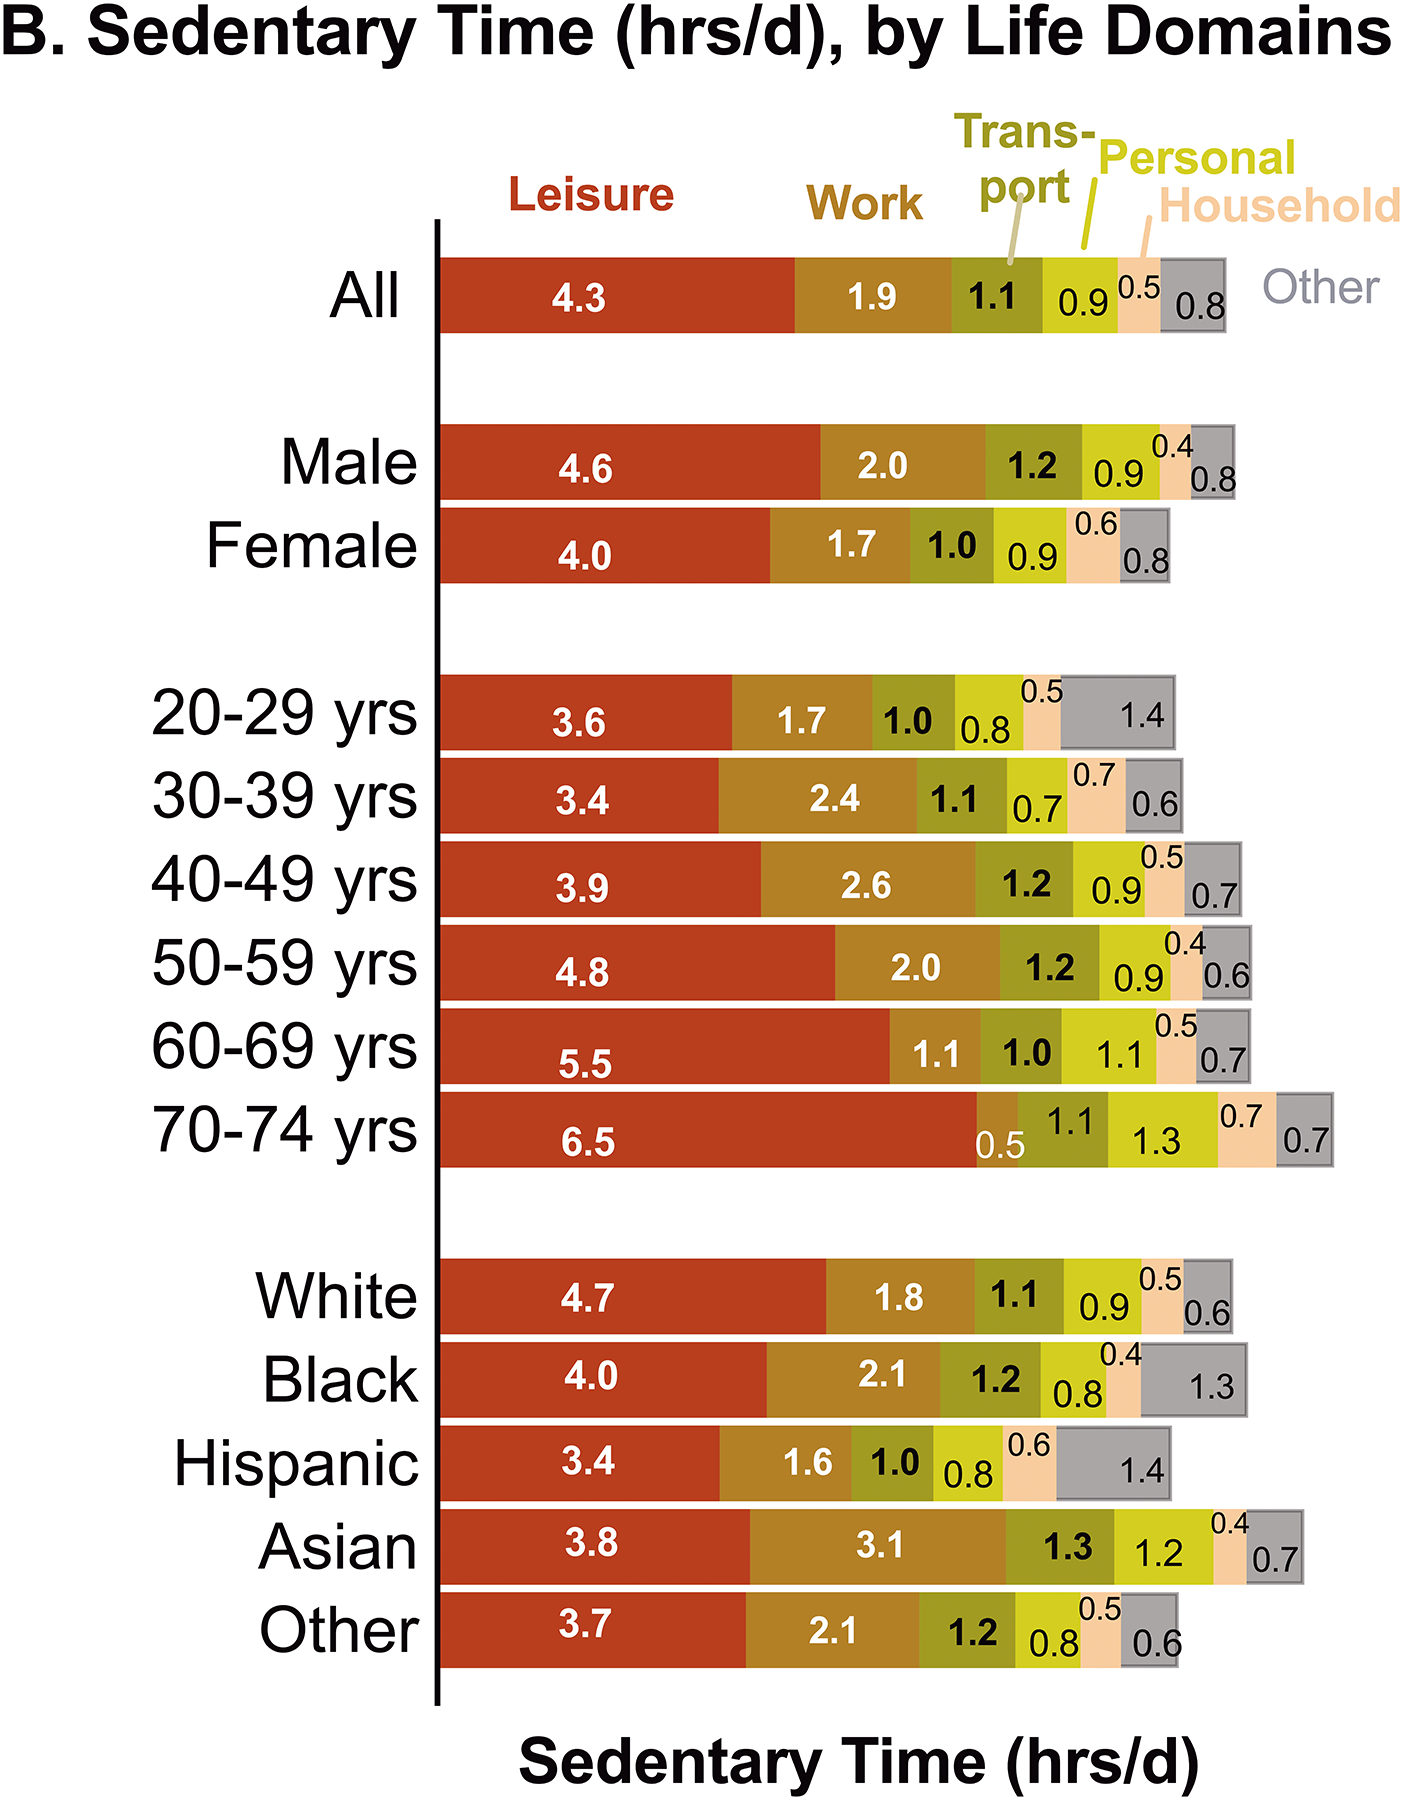
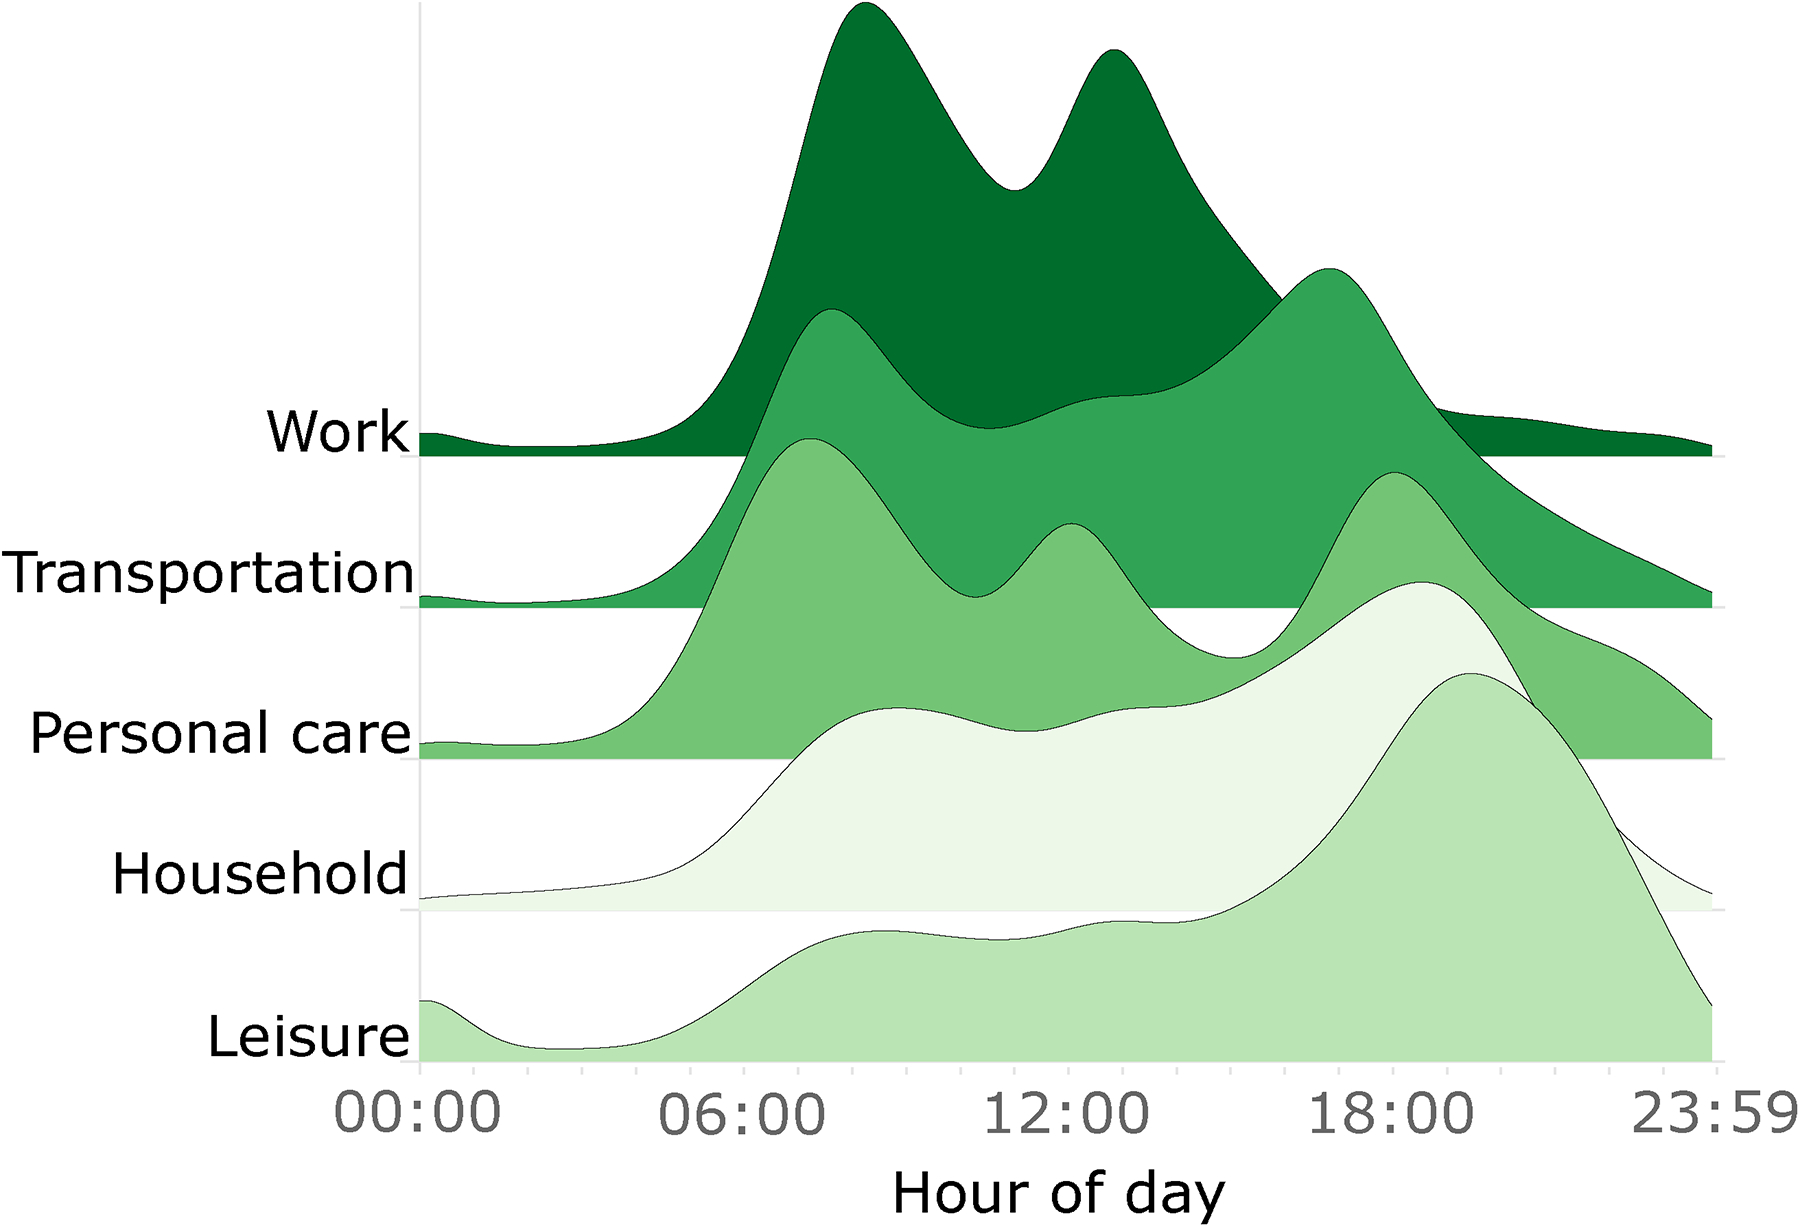
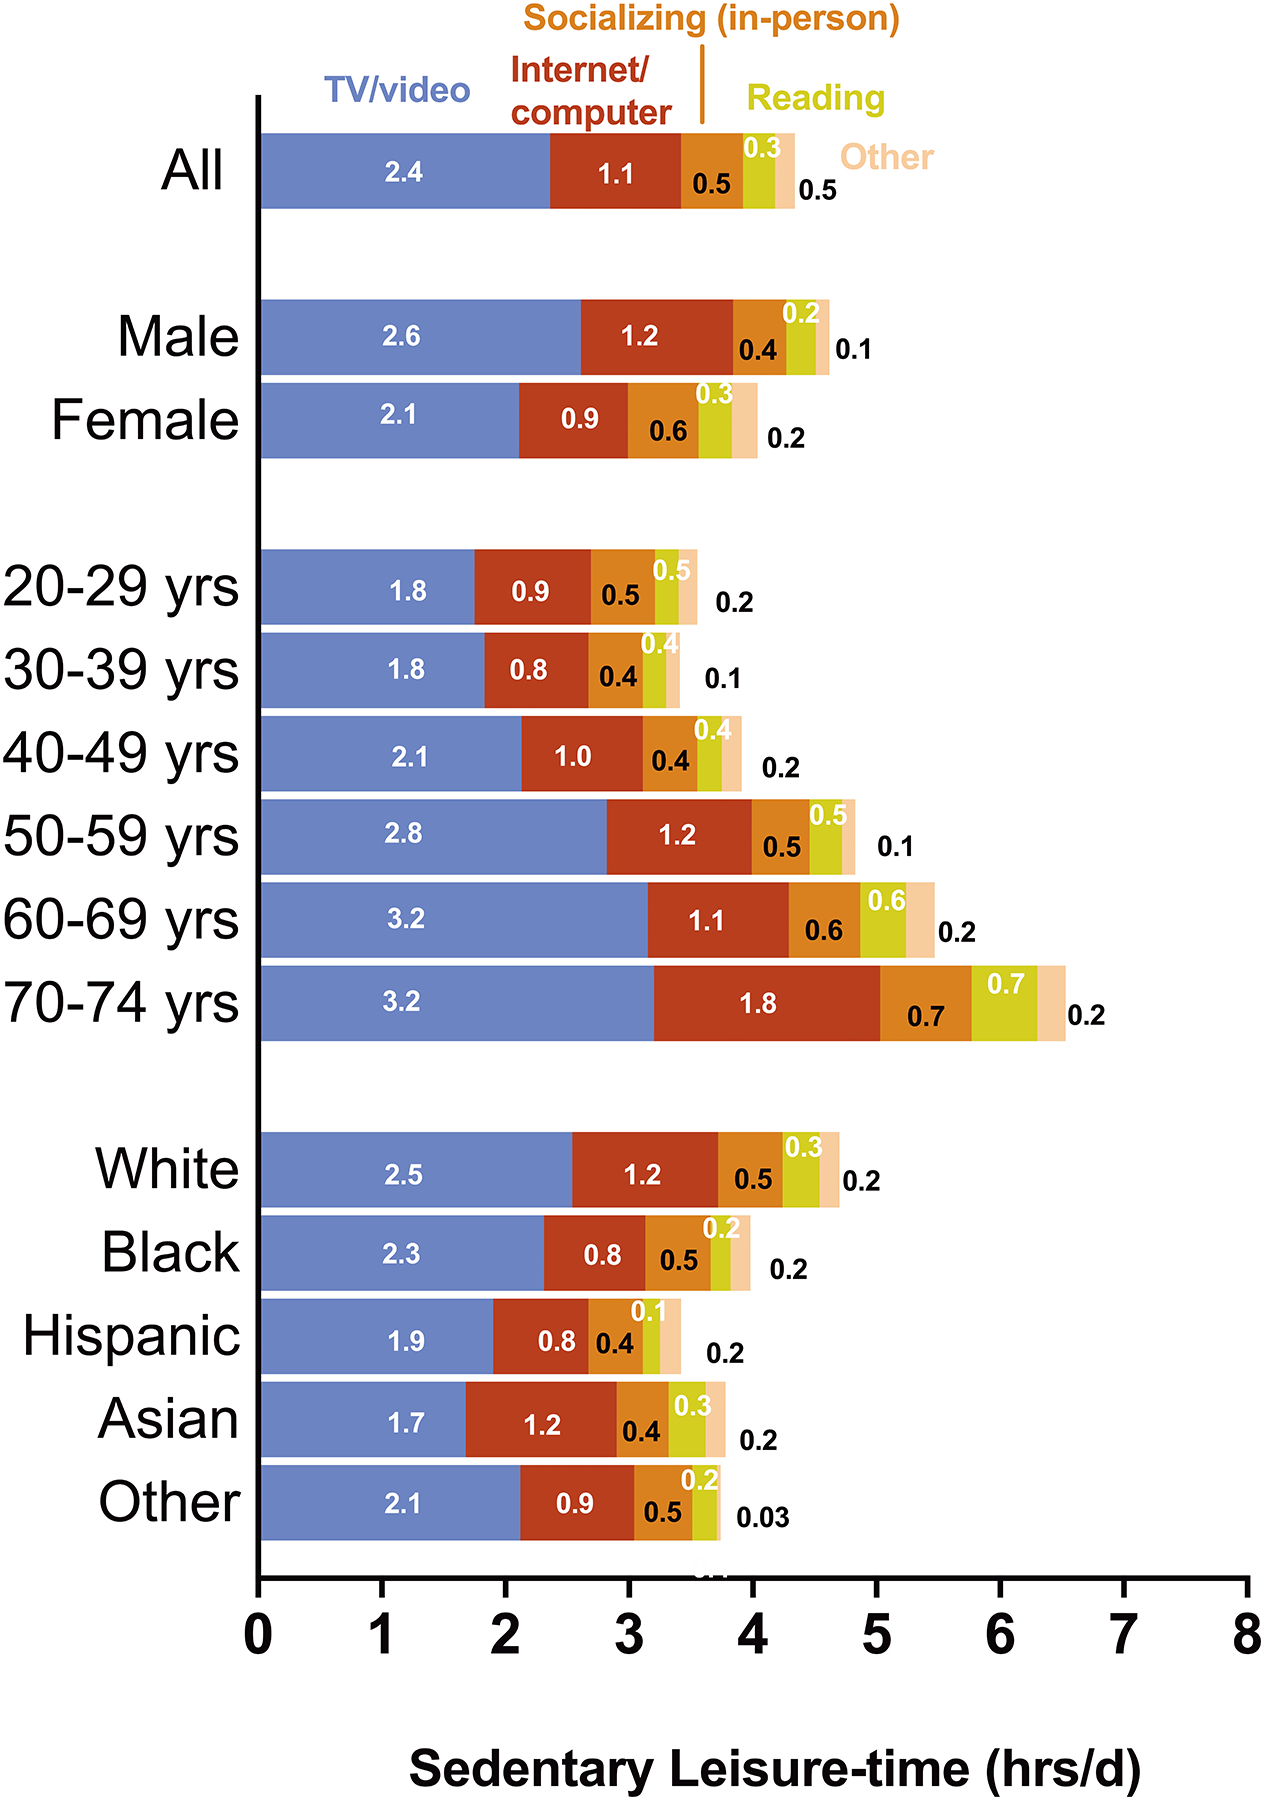
Results: Mean age was 45.3 yr, 51% were female, 67% non-Hispanic White, and 37% had a body mass index of ≥30 kg·m-2. U.S. adults reported a mean 9.5 h·d-1 of sedentary time (95% confidence interval = 9.4, 9.7 h·d-1), which was 34% more than reported using a common surveillance measure (P < 0.01). Most daily sedentary time was accumulated in the leisure and work life domains, with leisure accounting for 47% (4.3 h·d-1, 95% confidence interval = 4.2, 4.5 h·d-1) of the total sedentary time. Eighty-two percent of leisure time was spent sedentary, mainly watching television/videos or engaged in Internet/computer use.
Conclusions: U.S. adults appear to spend more time in sedentary behavior than previously thought, and the majority of this time is accumulated at work and in leisure time. Reducing sedentary screen time during leisure in favor of physically active could be an important intervention target in the effort to increase physical activity in U.S. adults.
Copyright © 2021 by the American College of Sports Medicine.
Conflict of interest statement
Conflicts of Interest
The authors report no personal of financial conflicts of interest associated with this research report. The results of this study are presented clearly, honestly, and without fabrication, falsification, or inappropriate data manipulation. The findings and conclusions in this report are those of the authors and do not necessarily represent the official position of the National Cancer Institute or the Centers for Disease Control and Prevention, nor does publication of this report constitute endorsement by the American College of Sports Medicine.
Figures
References
-
- 2018 Physical Activity Guidelines Advisory Committee. Physical Activity Guidelines Advisory Committee Scientific Report. Washington, DC: U.S. Department of Health and Human Services; 2018. Available from: U.S. Department of Health and Human Services.
-
- United States Department of Health and Human Services. Physical Activity Guidelines for Americans, 2nd edition. In. Wahsington, DC: United States Department of Health and Human Services; 2018.
