. 2021 Jul 26;17(7):e1009211.
doi: 10.1371/journal.pcbi.1009211. eCollection 2021 Jul.

A mechanistic and data-driven reconstruction of the time-varying reproduction number: Application to the COVID-19 epidemic

Affiliations

A mechanistic and data-driven reconstruction of the time-varying reproduction number: Application to the COVID-19 epidemic

Bernard Cazelles et al. PLoS Comput Biol. .

Abstract

The effective reproduction number Reff is a critical epidemiological parameter that characterizes the transmissibility of a pathogen. However, this parameter is difficult to estimate in the presence of silent transmission and/or significant temporal variation in case reporting. This variation can occur due to the lack of timely or appropriate testing, public health interventions and/or changes in human behavior during an epidemic. This is exactly the situation we are confronted with during this COVID-19 pandemic. In this work, we propose to estimate Reff for the SARS-CoV-2 (the etiological agent of the COVID-19), based on a model of its propagation considering a time-varying transmission rate. This rate is modeled by a Brownian diffusion process embedded in a stochastic model. The model is then fitted by Bayesian inference (particle Markov Chain Monte Carlo method) using multiple well-documented hospital datasets from several regions in France and in Ireland. This mechanistic modeling framework enables us to reconstruct the temporal evolution of the transmission rate of the COVID-19 based only on the available data. Except for the specific model structure, it is non-specifically assumed that the transmission rate follows a basic stochastic process constrained by the observations. This approach allows us to follow both the course of the COVID-19 epidemic and the temporal evolution of its Reff(t). Besides, it allows to assess and to interpret the evolution of transmission with respect to the mitigation strategies implemented to control the epidemic waves in France and in Ireland. We can thus estimate a reduction of more than 80% for the first wave in all the studied regions but a smaller reduction for the second wave when the epidemic was less active, around 45% in France but just 20% in Ireland. For the third wave in Ireland the reduction was again significant (>70%).


Conflict of interest statement

The authors have declared that no competing interests exist.

Figures

Fig 1
Fig 1. Flow diagram of a generalized SEIR model accounting for asymptomatic transmission and a simplified hospital system (see S2 equations in S1 Text).
The variables are: the susceptibles S, the infected non-infectious E, the infectious symptomatic I, the infectious asymptomatic A, the removed individuals R, and the hospital related variables: the hospitalized individuals H, the individuals in intensive care unit ICU, and the deaths at hospital D. The subscripts 1 and 2 stand for the two stages of the Erlang distribution of the sojourn times in E, A, I, H. The flow from H2 to R represents hospital discharge. Flows in blue are from hospital (Hi) and flow in red from ICU. λ’(t) = β(t).(I1+q1.I2+q2.(A1+A2))/N then the force of infection is λ(t) = λ’(t).S(t) and β(t) is the time-varying transmission rate (1), σ the incubation rate, γ the recovery rate, 1/κ the average hospitalization period, 1/δ the average time spent in ICU, τA the fraction of asymptomatics, τH the fraction of infectious hospitalized, τI the fraction of ICU admission, τD death rate, q1 and q2 the reduction in the transmissibility of I2 and Ai, qI the reduction in the fraction of people admitted in ICU and qD the reduction in the death rate.
Fig 2
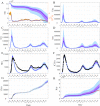
Fig 2. Reconstruction of the observed dynamics of COVID-19 in Ile-de-France, the Paris region.
(A) Time evolution of both β(t) and Reff (t). (B) Simulated and observed incidence. (C-D) New daily admissions to hospital and to ICU. (E) Daily new deaths. (F) Hospital discharges. (G-H) Cases in Hospital and in ICU per day (average of daily data over the current week is used after 01-05-2020). The black points are observations used in the inference process, the white points are the observations not used. The blue lines are the median of the posterior estimates of the simulated trajectories, the purple areas are the 50% Credible Intervals (CI) and the light blue areas the 95% CI. In (A) the orange area is the 50% CI of Reff. The vertical dashed lines show the implementation dates of the main NPI measures and the dot-dashed lines are for cases where only one part of the region has been subjected to these measures. The horizontal dashed-line is the threshold Reff = 1. For (B-H), the corresponding reporting rate is applied to the simulated trajectories for comparison with observations.
Fig 3
Fig 3. Model dynamics of COVID-19 in Ile-de-France, the Paris region.
(A) Time evolution of susceptibles S(t) and Reff (t). (B) Infected non infectious, E(t) = E1(t)+E2(t). (C) Symptomatic infectious I(t) = I1(t)+I2(t). (D) Asymptomatic infectious A(t) = A1(t)+A2(t). (E) Hospitalized individuals H(t) = H1(t)+H2(t)+ICU(t). (F) Individuals in ICU, ICU(t). (G) Cumulative death D(t). (H) Removed individuals R(t). The blue lines are the median of the posterior estimates of the simulated trajectories, the purple areas are the 50% Credible Intervals (CI) and the light blue areas the 95% CI. In (A) the orange area corresponds to the 50% CI of Reff. The black points are observations used in the inference process, the white points are the observations not used. In (H) the red line shows the median of R(t) when the “effectively protected vaccinated people” have been subtracted.
Fig 4
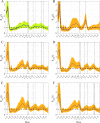
Fig 4. Time varying Reff (t) in five regions of France and in Ireland.
(A) Ile-de-France, (B) Ireland, (C) Provence Alpes Côte d’Azur, (D) Occitanie, (E) Nouvelle Aquitaine (F) Auvergne Rhône Alpes. The blue lines are the median of the posterior estimates of Reff (t) and orange and yellow areas are the 95% CI of Reff. In (A) the orange area corresponds to the case where hospital discharges are included in the inference process, whereas the yellow area corresponds to the model that does not account for them. In (A) and (B) the dashed curves represent the median of Reff for a preceding time period (blue), or computed with lower transmissibility of the asymptomatics, qA = 0.40 (black) or computed with higher transmissibility, qA = 0.70 (red). The vertical black dashed lines correspond to the start dates of the main mitigation measures, the dot-dashed lines are for cases where only one part of the region has been subjected to these measures. The horizontal dashed-line is the threshold Reff = 1.
Fig 5
Fig 5. Comparison between our Reff(t) estimation and those obtained with two other methods based on Irish multiple datasets.
A/ Comparison with the method implemented in EpiEstim R package (http://metrics.covid19-analysis.org/). B/ Comparison with the method proposed by Arroyo-Marioli et al [28] (http://trackingr-env.eba-9muars8y.us-east-2.elasticbeanstalk.com/). Blue lines are the median of the posterior of our estimates of Reff (t) and orange areas are the corresponding 95% CI of our Reff estimates. The black lines represent the median of Reff (t) for the other methods and the black dotted-dashed lines delimit the corresponding 95% CI associated. In B/ the black dashed lines delimited the 65% CI. The vertical black dashed lines correspond to the start dates of the main mitigation measures. The horizontal dashed-line is the threshold Reff = 1.

References

    1. Li Q, Guan X, Wu P, Wang X, Zhou L, Tong Y, et al.. Early Transmission Dynamics in Wuhan, China, of Novel Coronavirus-Infected Pneumonia. N Engl J Med. 2020;382:1199–1207. doi: 10.1056/NEJMoa2001316 - DOI - PMC - PubMed
    1. Heesterbeek JAP, Dietz K. The concept of R0 in epidemic theory. Statistica Neerlandica. 1996:50;89–110. doi: 10.1111/j.1467-9574.1996.tb01482.x - DOI
    1. Diekmann O, Heesterbeek JA, Roberts MG. The construction of next-generation matrices for compartmental epidemic models. J R Soc Interface. 2010;7:873–885. doi: 10.1098/rsif.2009.0386 - DOI - PMC - PubMed
    1. Wallinga J, Lipsitch M. How generation intervals shape the relationship between growth rates and reproductive numbers. Proc R Soc B Biol Sci. 2007; 274(1609):599–604 doi: 10.1098/rspb.2006.3754 - DOI - PMC - PubMed
    1. Lehtinen S, Ashcroft P, Bonhoeffer S. On the relationship between serial interval, infectiousness profile and generation time. J R Soc Interface. 2021;18:20200756. doi: 10.1098/rsif.2020.0756 - DOI - PMC - PubMed

Publication types