. 2021 Jul 26;17(7):e1009206.
doi: 10.1371/journal.pcbi.1009206. eCollection 2021 Jul.

Bridging cell-scale simulations and radiologic images to explain short-time intratumoral oxygen fluctuations

Affiliations

Bridging cell-scale simulations and radiologic images to explain short-time intratumoral oxygen fluctuations

Jessica L Kingsley et al. PLoS Comput Biol. .

Abstract

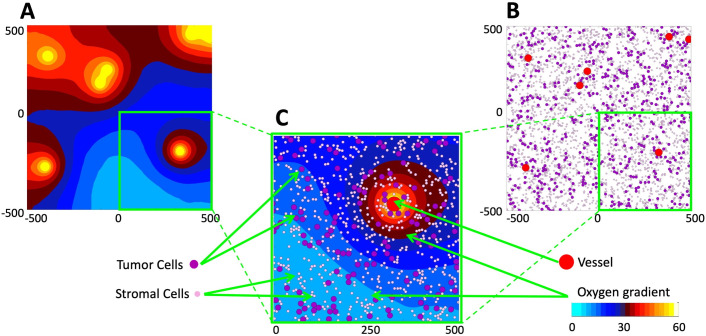
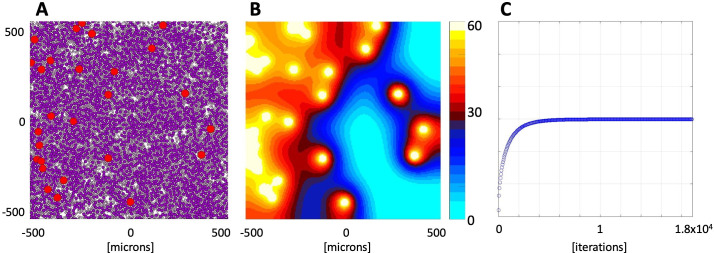
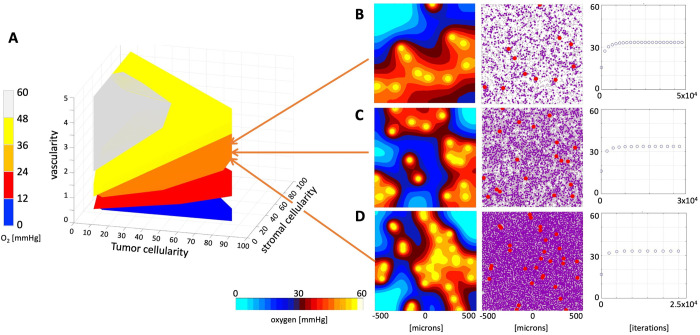
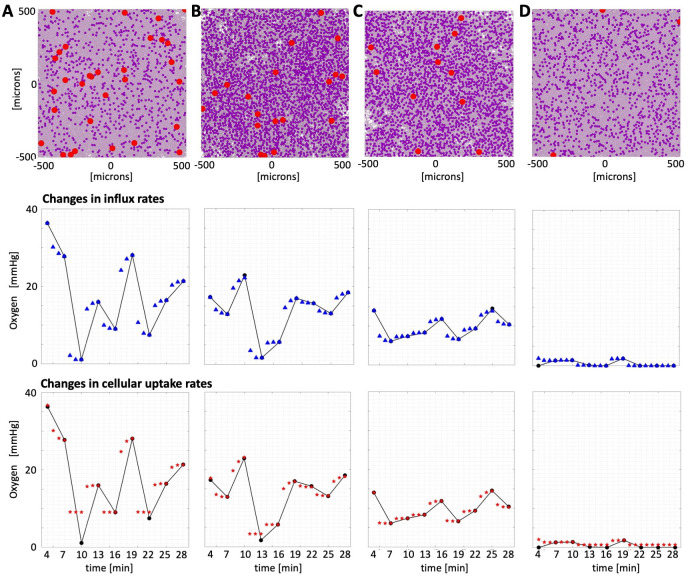
Radiologic images provide a way to monitor tumor development and its response to therapies in a longitudinal and minimally invasive fashion. However, they operate on a macroscopic scale (average value per voxel) and are not able to capture microscopic scale (cell-level) phenomena. Nevertheless, to examine the causes of frequent fast fluctuations in tissue oxygenation, models simulating individual cells' behavior are needed. Here, we provide a link between the average data values recorded for radiologic images and the cellular and vascular architecture of the corresponding tissues. Using hybrid agent-based modeling, we generate a set of tissue morphologies capable of reproducing oxygenation levels observed in radiologic images. We then use these in silico tissues to investigate whether oxygen fluctuations can be explained by changes in vascular oxygen supply or by modulations in cellular oxygen absorption. Our studies show that intravascular changes in oxygen supply reproduce the observed fluctuations in tissue oxygenation in all considered regions of interest. However, larger-magnitude fluctuations cannot be recreated by modifications in cellular absorption of oxygen in a biologically feasible manner. Additionally, we develop a procedure to identify plausible tissue morphologies for a given temporal series of average data from radiology images. In future applications, this approach can be used to generate a set of tissues comparable with radiology images and to simulate tumor responses to various anti-cancer treatments at the tissue-scale level.


Conflict of interest statement

The authors have declared that no competing interests exist.

Figures

Fig 1
Fig 1. Mathematical model of the tumor tissue microenvironment.
A. A contour map of the simulated oxygen distribution. The color scheme corresponds to that used in EPR imaging for the partial pressure of oxygen (cyan: low pO2; white: high pO2). B. Locations of tumor vasculature (red circles), tumor cells (purple circles), and stromal cells (pink circles) within the same computational domain; this is used to define tissue cellularity and vascularity. The color scheme corresponds to typical colors in histology images. C. Magnification of a quarter of the computational domain showing all model components together: the vessels, tumor and stromal cells, and oxygen distribution. All variables are dimensional (length is in μm, oxygen partial pressure in mmHg, as listed in Table 1).
Fig 2
Fig 2. Stabilized oxygen distribution for an exemplary tissue morphology.
A. In silico tissue morphology comprised of 3.5% of vasculature (red circles), 55% of tumor cells (dark purple circles), and 30% of stromal cells (light pink circles). B. The stabilized oxygen distribution color-coded using the EPR imaging color scheme, with high oxygen levels (yellow) near the vessels and low oxygen levels (cyan) in poorly vascularized regions. C. Changes in the average oxygen concentration over time from initial 0 mmHg to the stable level of 29.89 mmHg.
Fig 3
Fig 3. Classification of tissue oxygenation.
A. A parameter space (convex hulls) of tissues characterized by vascularity, tumor cellularity and stromal cellularity classified into five classes with respect to the stabilized average oxygen level. For every tissue characteristic only one tissue morphology was included. B-D. Three examples of tissues with similar oxygen saturation levels: B. A tissue with vascularity 1.5%, tumor cellularity 15%, stromal cellularity 15%, and stable oxygen of 33.43 mmHg. C. A tissue with vascularity 2.5%, tumor cellularity 30%, stromal cellularity 35%, and stable oxygen of 33.53 mmHg. D. A tissue with vascularity 4%, tumor cellularity 75%, stromal cellularity 20%, and stable oxygen of 33.16 mmHg.
Fig 4
Fig 4. Reconstruction of oxygen fluctuations in ROIs #1–4.
Tissue configurations (top row) for which numerically stabilized oxygen distributions matched the maximum average pO2 level in each of the region of interests and the reconstructed pO2 fluctuations when either vascular influx rates (middle row) or cellular uptake rates (bottom row) were varied. Straight lines connect experimental data recorded every 3 minutes. Blue triangles (top, influx) and red stars (bottom, uptake) denote computational data recorded each minute. Tissue characteristics: A. ROI#1 (black): vascularity 4%, tumor cellularity 15%, and stromal cellularity 75%. B. ROI#2 (red): vascularity 2.5%, tumor cellularity 45%, and stromal cellularity 40%. C. ROI#3 (blue): vascularity 1.5%, tumor cellularity 40%, and stromal cellularity 45%. D. ROI#4 (magenta): vascularity 0.5%, tumor cellularity 20%, and stromal cellularity 75%.
Fig 5
Fig 5. Robustness of optimal influx and uptake schedules.
A. Parameter spaces of all tissues with oxygen levels within +/- 3.5 mmHg of the maximum experimental value for each ROI; 3D convex hulls shown in cyan, together with convex hulls for optimal influx schedule (green) and optimal uptake schedule (black) that fit experimental data with normalized L2-norm smaller than 0.2. B. Normalized L2-norms for influx schedule (green dots) and uptake schedule (grey dots) for each tissue from the cyan convex hull. The red dashed line represents the L2-norm value of 0.2. The results are shown from left to right for: ROI#1 (black), ROI#2 (red), ROI#3 (blue), and ROI#4 (magenta).

References

    1. Horsman MR, Mortensen LS, Petersen JB, Busk M, Overgaard J. Imaging hypoxia to improve radiotherapy outcome. Nat Rev Clin Oncol. 2012;9(12):674–87. Epub 2012/11/15. doi: 10.1038/nrclinonc.2012.171 . - DOI - PubMed
    1. Harris LH. Hypoxia-a key to rgulatory factor in tumour growth. Nature Reviews Bacer. 2002;2:38–47. doi: 10.1038/nrc704 - DOI - PubMed
    1. Saxena K, Jolly K. Acute vs. Chrinic vs. Cyclic Hypoxia: Their differentual dynamics, molecular mechanisnsm and effects on tumor progression. Biomolecules. 2019;9:339. - PMC - PubMed
    1. Michiels C, Tellier C, Feron O. Cycling hypoxia: A key feature of the tumor microenvironment. Biochim Biophys Acta. 2016;1866(1):76–86. Epub 2016/06/28. doi: 10.1016/j.bbcan.2016.06.004 . - DOI - PubMed
    1. Dewhirst M, Cao Y, Moeller B. Cycling hypoxia and free radicals regulate angiogenesis and radiotherapy response Nat Rev Cnacer. 2008;8(6):425–37. - PMC - PubMed

Publication types