. 2021 Nov:479:11-22.
doi: 10.1016/j.ydbio.2021.06.010. Epub 2021 Jul 24.

Conserved and context-dependent roles for pdgfrb signaling during zebrafish vascular mural cell development

Affiliations

Conserved and context-dependent roles for pdgfrb signaling during zebrafish vascular mural cell development

Koji Ando et al. Dev Biol. 2021 Nov.

Abstract

Platelet derived growth factor beta and its receptor, Pdgfrb, play essential roles in the development of vascular mural cells, including pericytes and vascular smooth muscle cells. To determine if this role was conserved in zebrafish, we analyzed pdgfb and pdgfrb mutant lines. Similar to mouse, pdgfb and pdgfrb mutant zebrafish lack brain pericytes and exhibit anatomically selective loss of vascular smooth muscle coverage. Despite these defects, pdgfrb mutant zebrafish did not otherwise exhibit circulatory defects at larval stages. However, beginning at juvenile stages, we observed severe cranial hemorrhage and vessel dilation associated with loss of pericytes and vascular smooth muscle cells in pdgfrb mutants. Similar to mouse, pdgfrb mutant zebrafish also displayed structural defects in the glomerulus, but normal development of hepatic stellate cells. We also noted defective mural cell investment on coronary vessels with concomitant defects in their development. Together, our studies support a conserved requirement for Pdgfrb signaling in mural cells. In addition, these zebrafish mutants provide an important model for definitive investigation of mural cells during early embryonic stages without confounding secondary effects from circulatory defects.

Keywords: Mural cells; Pdgfrb; Pericytes; Vascular smooth muscle cells; Zebrafish.


Conflict of interest statement

Declaration of competing interest The authors declare no competing or financial interests.

Figures

Figure 1.
Figure 1.. Pdgfb signaling is essential for brain pericyte development.
(A, B) Confocal micrographs of central arteries in (A) wild type or (B) pdgfrbum148 mutants bearing TgBAC(pdgfrb:egfp)ncv22 (green) and Tg(kdrl:memCherry)s896 (red) transgenes at 5 dpf. Arrows denote selected brain pericytes; metencephalic artery indicated by arrowheads. (C) Pericyte numbers in larvae of indicated genotype. n=13 larvae per genotype across three clutches. (D) Vascular volume in indicated genotype (n=9 for each genotype), data not normally distributed, analysis of variance (P=0.0002), multiple comparisons by Kruskal-Wallis. (E) Pericytes per vessel volume in indicated genotype (n=9 per genotype). (C, E) Data normally distributed; one-way ANOVA, P<0.0001; multiple comparison by Dunnett’s. (C-E) Quantification at 5 dpf. (F, G) Transmission electron microscopy (TEM) sections of cranial blood vessels from (F) wild type and (G) pdgfrbum148 mutant larvae at 5 dpf. (F, G) Scale bar is 2 microns; P – pericyte, E – endothelial cell, RBC – red blood cell. (H) Quantification of pericyte coverage on cranial vessels in TEM sections. Numbers of endothelial cells with or without pericyte coverage are included in the bar graph. Data were obtained from at least 4 sections each from 5 homozygous wild type, 2 pdgfrbum148 heterozygous, and 6 pdgfrbum148 mutant siblings. Fisher’s exact test. (I) Expression of indicated gene in triplicate RNA-seq libraries from indicated cell type at 5dpf. ****adjP<0.0001; see Lawson et al (2020). (J-L) Confocal images of (J) wild type, (K) pdgfbabns139 mutant and (L) pdgfbabns139/bns139;pdgfbbbns207/+ larvae at 4 pdf expressing TgBAC(pdgfrb:egfp)ncv22 (green) and >Tg(kdrl:dsRed2)pd27 (red). Arrows denote selected brain pericytes; metencephalic artery indicated with arrowheads. (M) Quantification of periyctes at 4 dpf of indicated genotype. Numbers of individuals used for quantification are shown. Data not normally distributed, analysis of variance (P=0.0001) and multiple comparisons by Kruskal-Wallis. (C-E, H, M) ****p<0.001, ***p<0.005, **p<0.01, *p<0.05, ns – not statistically significant. (A, B, J-L) Dorsal views, scale bar is 30 μm.
Figure 2.
Figure 2.. Vascular instability in pdgfrb mutant brains.
(A-D) Transmitted light images of 3 month old (A) wild type and (B) pdgfrbum148 mutant zebrafish heads; lateral view, anterior to left and brains dissected from (C) wild type and (D) pdgfrbum148 mutant zebrafish; dorsal view, anterior is up. Arrowheads denote areas of blood accumulation. OT – optic tectum, C – cerebellum. (E) Lateral view of the right hemisphere from a pdgfrbsa16389 mutant brain. Boxed region magnified in (E’). (E”) Boxed region in (E’), endothelial cells visualized with Tg(fli1:myr-mcherry)ncv1 transgene. (E-E”) Arrow denotes blood accumulation in dilated arteriole; arrowheads denote hemorrhages. (F, G) Two-photon micrographs of Tg(fli1a:egfp)y1 (endothelial cells, green) and Tg(acta:mcherry)ca8 (vascular smooth muscle cells [VSMC], magenta) in (F) wild type and (G) pdgfrbum148 mutant blood vessels in OT at 3 months. Arrow denotes right branch of anterior cerebral artery. (H, I) Confocal images of TgBAC(tagln:egfp)ncv25 (VSMC, green) and Tg(fli1:myr-mCherry)ncv1 (magenta) in forebrain vasculature of (H) wild type or (I) pdgfrbsa16389 mutant. Arrows denote arteriole branches, arrowhead is arterial trunk in same anatomical region. Scale bars, 50 μm. (J, K) Confocal images of TgBAC(pdgfrb:egfp)ncv25 (green) and Tg(fli1:myr-mCherry)ncv1 (magenta) in forebrain vasculature of (J) wild type or (K) pdgfrbsa16389 mutant. Boxed areas denote magnified views to the right. Autofluorescence from circulating blood is indicated by asterisks. Scale bars, 100 μm or 20 μm (enlarged view). (A-K) Images are representative of phenotypes observed in at least 5 individuals of indicated genotype. (L) Quantification of forebrain capillary diameter at 3 months in adults of indicated genotype. Error bars are mean with SD of at least 80 capillary diameter measuerments each from 4 animals. Data are not normally distributed; ****p<0.0001 by Mann-Whitney test.
Figure 3.
Figure 3.. Pdgfrb is selectively required for embryonic vascular smooth muscle development.
(A, B, D, E, G, H) Confocal images of Tg(acta2:mcherry)ca8 (red, VSMCs) larvae subjected to microangiography to visualize patent blood vessels (blue). Arrows denote selected VSMCs. (A, B) VSMC on dorsal aorta (da) in (A) wild type and (B) pdgfrbum148 mutants at 5 dpf. pcv – posterior cardinal vein, int – intestine. Lateral view, anterior to left, dorsal is up. (D, E) VSMC on ventral aorta (va) in (D) wild type and (E) pdgfrbum148 mutants at 4 dpf. Ventral view, anterior is up. (G, H) VSMC on Circle of Willis in (G) wild type and (H) pdgfrbum148 mutants at 5 dpf. Dorsal view, anterior is up. (C, F, I) Quantification of VSMCs on (C) da, (F) va, and (I) CoW in larvae of indicated genotype. (C, I) Data not normally distributed. Analysis of variance using Kruskal-Wallis test (not significant for da; p<0.0001 for CoW), multiple comparisons using Dunn’s, ****p<0.0001, ns - not statistically significant. (F) Data normally distributed, no significant differences by one-way ordinary ANOVA (p=0.6873). (J, K) Confocal images of the CoW in (J) wild type and (K) pdgfbabns139/bns139;pdgfbbbn207/+ mutant larvae bearing TgBAC(pdgfrb:egfp)ncv22 (green) and Tg(kdrl:dsred2)pd27 (magenta) at 5 dpf. (L) Quantification of pdgfrb:egfp-positive cells on CoW. Data normally distributed; one-way ANOVA, p=0.0008; Tukey’s multiple comparison test, **p<0.01, ns – not statistically significant.
Figure 4.
Figure 4.. Pdgfra does not compensate for Pdgfrb deficiency during vascular smooth muscle development.
(A-D) Transmitted light images of larvae of the following genotype at 5 dpf: (A, B) pdgfrab1059/b1059;pdgfrb+/+, (C) pdgfra+/b1059;pdgfrbum148/148, (D) pdgfra+/b1059;pdgfrb+/um148. Lateral views, dorsal is up, anterior to left. (A) Arrows denote edema. (B) Arrow indicates jaw. (E) Proportion of larvae of indicated genotype with or without blood circulation. (F) Proportion of larvae of indicated genotype with or without hemorrhage. (E, F) Fisher’s exact test, *p<0.05, **p<0.005, ***p<0.0005, ns – not significant. (G) Transmitted light images of wild type and pdgfrab1059 mutant siblings at 5 dpf. Ventral views, anterior is up. Arrowhead indicates hemorrhage. (H, I, L, M) Confocal images of trunk vessels in (H,I) pdgfrab1059/b1059;pdgfrb+/um148, (L) pdgfra+/b1059;pdgfrb+/um148, and (M) pdgfrab1059/b1059;pdgfrbum148/um1l48 larvae bearing Tg(acta2:mcherry)ca8 (magenta, VSMC) and Tg(fli1a:egfp)y1 (green, endothelial cells). Larvae in (H, L, and M) have normal circulatory flow; larva in (I) has no flow. (H’, I’, L’, M’) Magenta channel showing VSMC coverage on dorsal aorta (da) for each corresponding overlay panel; arrows denote selected VSMCs. pcv – posterior cardinal vein, int – intestine. (J, K) Number of VSMCs per 100 μm da in larvae of indicated genotype. (J) Larvae with or without flow (n=10 individuals for each class). Unpaired t-test, ****p<0.00001. (K) Only embryos with circulation considered. Data not normally distributed. Analysis of variance by Kruskal-Wallis (P=0.1035); no statistically significant comparisons (ns).
Figure 5.
Figure 5.. Trunk vasculature of pdgfrb mutants at 3 months.
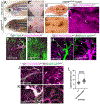
(A-L) Confocal images of trunk vessels in (A, D-F) wild type or (B, C, G-L) pdgfrbsa16389 mutants bearing TgBAC(pdgfrb:egfp)ncv22 (mural cells, green) and Tg(fli1:myr-mCherry)ncv1 (endothelial cells, red) at 3 months from cross-section (300 μm-thick) through caudal region, as depicted at right. Boxed areas (“d-f, “g-l”) magnified to the right. Magenta arrows, MC on caudal artery. Images are representative of those taken from 6 individuals of each genotype (+/+,+/−,−/−). Yellow arrows, MCs on caudal vein. White arrows, MCs on arteriole. Scale bars, 1 mm or 100 μm (enlarged view). (M) Quantification of trunk capillary diameter in wild type or pdgfrbsa16389 mutants at 3 months. Lines and dots indicate average and value of each capillary diameter from 4 animals from each genotype, respectively. More than 80 points of capillary diameter were randomly measured in individual zebrafish. Unpaired t-test, ***p<0.001.
Figure 6.
Figure 6.. Mesangial cells in pdgfrb mutants.
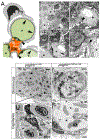
(A) Schematic of glomerular tuft. Fenestrated ECs (E) lining capillary lumen (*) and mesangial cells (Me) found within the mesangium (ms) shown on blood side of glomerular basement membrane (GBM; black line). Podocytes (Po) and their foot processes are on urinary side of GBM. (B-E) Electron micrographs of transverse sections of 4 dpf zebrafish pronephric glomerulus. Mesangial cells (Me) are identified on the blood side of the GBM. Arrowheads in A, C, and E show mesangial processes that embed between the glomerular ECs on one side and the GBM. Arrows in A and D show the fenestrated ECs of the glomerular tuft. (F, G) TEM micrographs of transverse sections of mesonephric glomeruli from adult (F) pdgfrbum148/+ and (G) pdgfrbum148 mutant fish. Ultra-structurally, mutants exhibit large aneurysmal capillaries (*) and absence of mesangial cells (Me). (F’, G’) Higher magnification images of areas denoted in (F, G).
Figure 7.
Figure 7.. Coronary vessel defects in pdgfrb mutants.
(A-F) Confocal images of coronary vessels on ventricular wall showing TgBAC(pdgfrb:egfp)ncv22 expression in (A, C, D) wild type and (B, E, F) pdgfrbsa16389 mutant siblings at (A, B) 2 months and (C-F) 4 months. (A’-F’) Overlay of images from pdgfrb:egfp (MCs, green) and Tg(fli1:myr-mCherry)ncv1 (endothelial cells, magenta). Scale bars are (A, B) 100 μm, (C, E) 40 μm, or (D, F) 20 μm. Coronary vessels on ventricular wall facing (C, E) atrium or (D, F) opposite wall. White dotted lines in pdgfrbsa16389 mutant depict ventricle shape. Boxes indicate magnified areas. AVC, atrioventricular canal. BA, bulbus arteriosus. Scale bars, 100 μm (left and center) or 20 μm (enlarged view). (G, H) Confocal images of coronary vessel endothelial cells on ventricular wall facing pericardial cavity in (G) wild type or (H) pdgfrbsa16389 mutants with Tg(fli1a:egfp)y1 at 8 months. Boxed areas are magnified to left or right of original images. Scale bars, 200 μm or 50 μm (enlarged view). Images are representative of observations made from 6 individuals of each genotype.. (I) Coronary vascular area in 5 wild type and 9 mutant individuals. Unpaired t-test, **p<0.01. Bars and circles indicate average and value of each vascular area in ventricular wall facing pericardial cavity, respectively.
Figure 8.
Figure 8.. Hepatic stellate cells in pdgfrb mutants.
(A) Confocal images of liver sinusoidal endothelial cells in wild type, heterozygous or homozygous pdgfrbsa16389 mutant with TgBAC(pdgfrb:egfp)ncv22;Tg(fli1:myr-mCherry)ncv1 background at 2 months. Most right column shows sinusoid of heterozygote with Tg(fli1:myr-mCherry)ncv1 but without TgBAC(pdgfrb:egfp)ncv2 background. Scale bar, 40 μm. Images are representative of observations made from 6 individuals of each genotype. (B) Quantification of pdgfrb:egfp-positive cell number divided by the volume of 3D images of the randomly observed sinusoid. The graph shows mean ± s.e.m. (n≥ 3); one-way analysis of variance with Turkey’s test for multiple comparisons, no statistically significant differences.

References

    1. Ando K, Fukuhara S, Izumi N, Nakajima H, Fukui H, Kelsh RN, Mochizuki N, 2016a. Clarification of mural cell coverage of vascular endothelial cells by live imaging of zebrafish. Development 143, 1328–1339. - PMC - PubMed
    1. Ando K, Fukuhara S, Izumi N, Nakajima H, Fukui H, Kelsh RN, Mochizuki N, 2016b. Clarification of mural cell coverage of vascular endothelial cells by live imaging of zebrafish. Development 143, 1328–1339. - PMC - PubMed
    1. Ando K, Wang W, Peng D, Chiba A, Lagendijk AK, Barske L, Crump JG, Stainier DYR, Lendahl U, Koltowska K, Hogan BM, Fukuhara S, Mochizuki N, Betsholtz C, 2019a. Peri-arterial specification of vascular mural cells from naive mesenchyme requires Notch signaling. Development 146. - PMC - PubMed
    1. Ando K, Wang W, Peng D, Chiba A, Lagendijk AK, Barske L, Crump JG, Stainier DYR, Lendahl U, Koltowska K, Hogan BM, Fukuhara S, Mochizuki N, Betsholtz C, 2019b. Peri-arterial specification of vascular mural cells from naïve mesenchyme requires Notch signaling. Development 146, dev165589. - PMC - PubMed
    1. Andrae J, Gallini R, Betsholtz C, 2008. Role of platelet-derived growth factors in physiology and medicine. Genes Dev 22, 1276–1312. - PMC - PubMed

Publication types

MeSH terms

Substances