. 2021;12(5):1743-1759.
doi: 10.1016/j.jcmgh.2021.07.007. Epub 2021 Jul 24.

IκB Kinase-β Regulates Neutrophil Recruitment Through Activation of STAT3 Signaling in the Esophagus

Affiliations

IκB Kinase-β Regulates Neutrophil Recruitment Through Activation of STAT3 Signaling in the Esophagus

Kelsey Nicole Wiles et al. Cell Mol Gastroenterol Hepatol. 2021.

Abstract

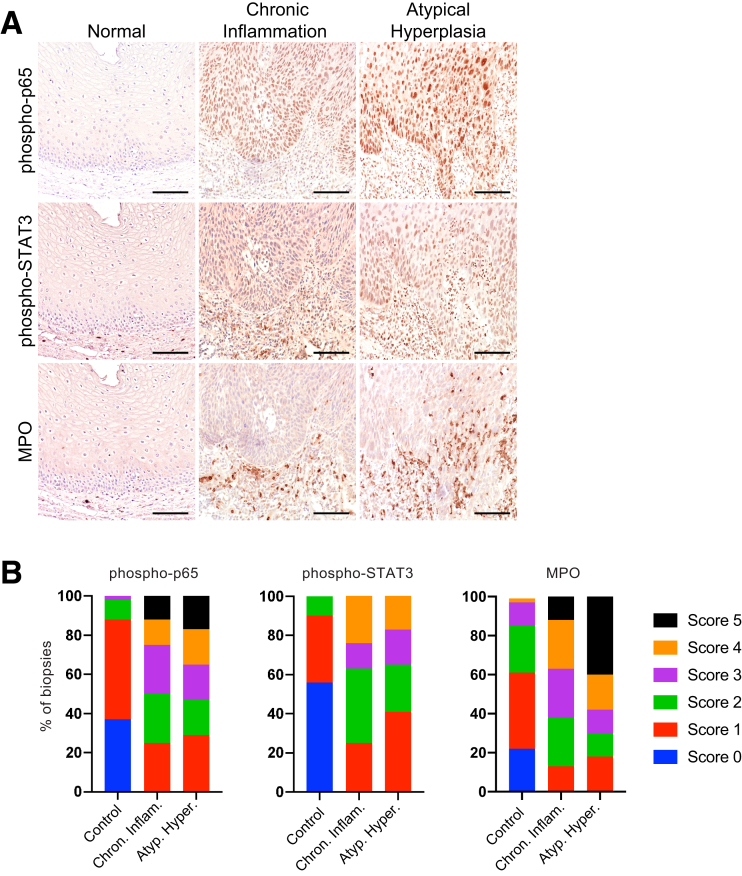
Background & aims: The epithelial barrier is the host's first line of defense against damage to the underlying tissue. Upon injury, the epithelium plays a critical role in inflammation. The IκB kinase β (IKKβ)/nuclear factor-κB pathway was shown to be active in the esophageal epithelium of patients with esophageal disease. However, the complex mechanisms by which IKKβ signaling regulates esophageal disease pathogenesis remain unknown. Our prior work has shown that expression of a constitutively active form of IKKβ specifically in esophageal epithelia of mice (IkkβcaEsophageal Epithelial Cell-Knockin (EEC-KI)) is sufficient to cause esophagitis.

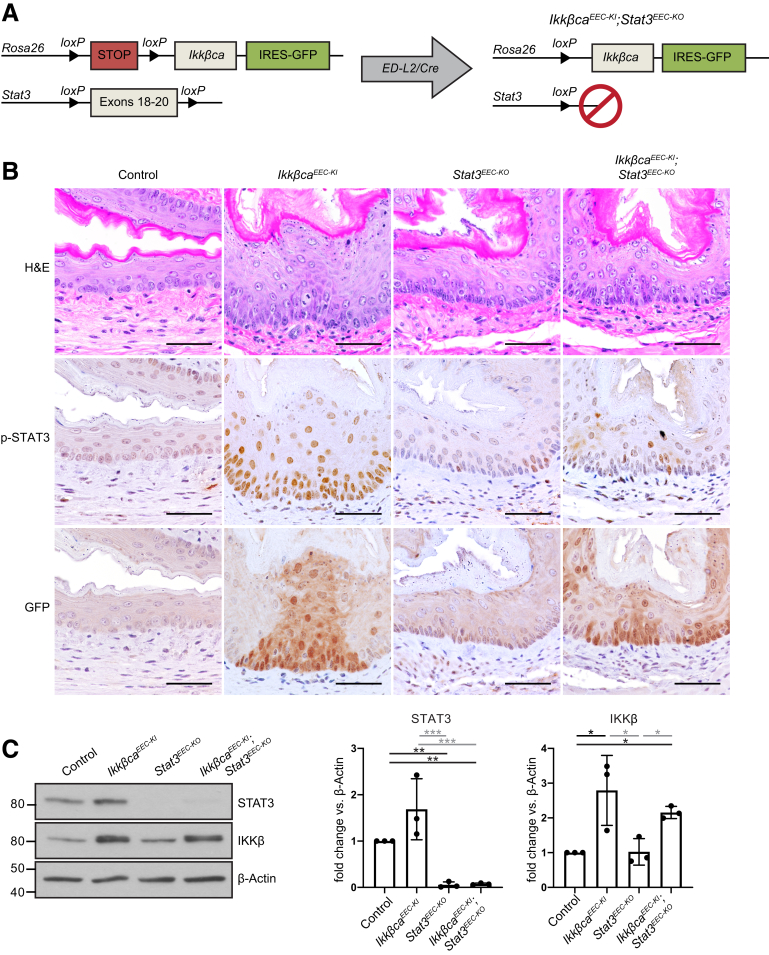
Methods: We generated ED-L2/Cre;Rosa26-Ikkβca+/L;Stat3L/L (IkkβcaEEC-KI;Stat3Esophageal Epithelial Cell Knockout (EEC-KO)) mice, in which the ED-L2 promoter activates Cre recombinase in the esophageal epithelium, leading to constitutive activation of IKKβ and loss of Stat3. Esophageal epithelial tissues were collected and analyzed by immunostaining, RNA sequencing, quantitative real-time polymerase chain reaction assays, flow cytometry, and Western blot. IkkβcaEEC-KI mice were treated with neutralizing antibodies against interleukin (IL)23p19 and IL12p40.

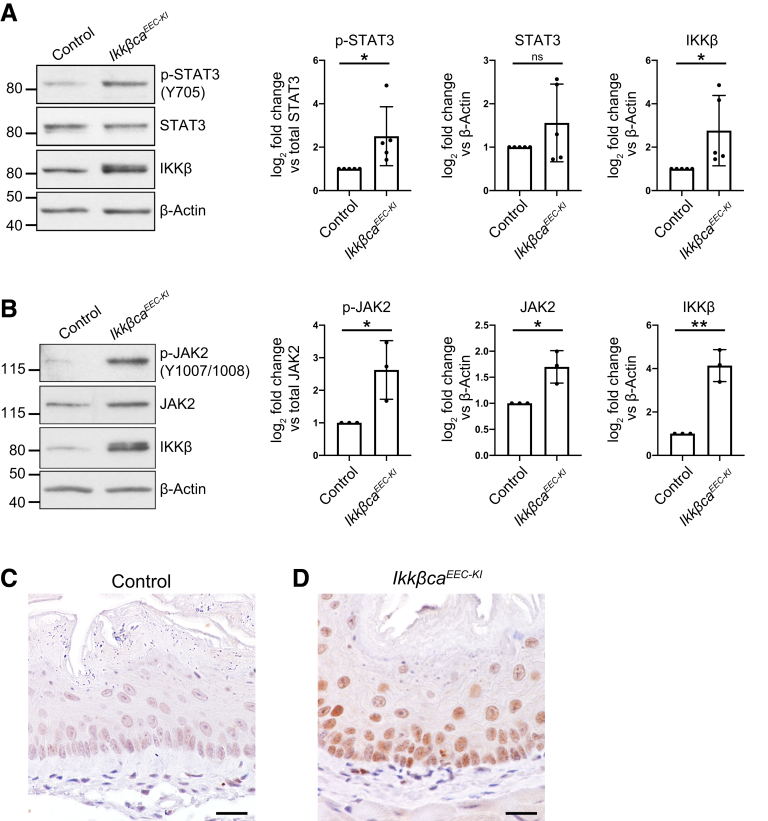
Results: Here, we report that IkkβcaEEC-KI mice have increased activation of epithelial Janus kinase 2/STAT3 signaling. Stat3 deletion in IkkβcaEEC-KI mice attenuated the neutrophil infiltration observed in IkkβcaEEC-KI mice and resulted in decreased expression of genes related to immune cell recruitment and activity. Blocking experiments in IkkβcaEEC-KI mice showed that STAT3 activation and subsequent neutrophil recruitment are dependent on IL23 secretion.

Conclusions: Our study establishes a novel interplay between IKKβ and STAT3 signaling in epithelial cells of the esophagus, where IKKβ/IL23/STAT3 signaling controls neutrophil recruitment during the onset of inflammation. GEO accession number: GSE154129.

Keywords: Gene Regulation; Immune Regulation; Inflammation; Transcription Factor.


Figures

None
Graphical abstract
Figure 1
Figure 1
Activation of epithelial IKKβ signaling leads to increased epithelial STAT3 activation in mouse esophagus. (A and B) Western blot determining (A) STAT3 or (B) JAK2 phosphorylation levels in esophageal epithelia of mice with constitutive IKKβ activation. IkkβcaEEC-KI mice have increased levels of (A) p-STAT3 (Y705), (B) phospho-JAK2 (Y1007/8), and (A and B) IKKβ compared with littermate controls. β-actin was used as a loading control. (A and B) Right: Densitometric analysis of Western blot. p-STAT3 and phospho-JAK2 values were normalized to total protein expression, and total protein values were normalized to loading control. Fold change was calculated based on experimental control. (A) n = 5 mice per experimental group, ∗P < .05. (B) n = 3 mice per experimental group, ∗P < .05, ∗∗P < .01. Bar graphs represent means ± SD. All statistics were determined by a 2-tailed Student t test. (C and D) Immunohistochemical staining for p-STAT3 (Y705) in esophageal sections of (C) control and (D) IkkβcaEEC-KI mice. Immunostaining shows increased nuclear expression of p-STAT3 (Y705) in esophageal epithelial cells from (D) IkkβcaEEC-KI mice compared with (C) controls. n = 6 mice per experimental group. Scale bar: 50 μm.
Figure 2
Figure 2
Loss of epithelial Stat3 attenuates the phenotype of IkkβcaEEC-KImice. (A) Schematic representation of the generation of IkkβcaEEC-KI;Stat3EEC-KO mice. ED-L2/Cre mice were crossed with Rosa26-STOPFL-Ikkβca-EGFP mice and with Stat3 floxed mice. (B) H&E staining of esophageal sections show that basal cell hyperplasia and immune cell infiltration are attenuated in IkkβcaEEC-KI;Stat3EEC-KO mice when compared with IkkβcaEEC-KI mice. Stat3EEC-KO mice show no significant histologic changes compared with controls. Serial sections were used to confirm expression of GFP and p-STAT3 (Y705), along with H&E staining. Immunostaining shows GFP expression in esophageal epithelial cells of IkkβcaEEC-KI and IkkβcaEEC-KI;Stat3EEC-KO mice compared with control and Stat3EEC-KO mice with no GFP expression. Increased nuclear expression of p-STAT3 (Y705) is seen in esophageal epithelial cells from IkkβcaEEC-KI mice compared with controls, IkkβcaEEC-KI;Stat3EEC-KO and Stat3EEC-KI mice. n = 6 mice per experimental group. Scale bar: 100 μm. (C) Expression levels of IKKβ and STAT3 in protein lysates enriched for esophageal epithelial cells by immunoblot. Immunoblot analyses confirm increased IKKβ expression levels in IkkβcaEEC-KI and IkkβcaEEC-KI;Stat3EEC-KO mice and decreased STAT3 expression in Stat3EEC-KO and IkkβcaEEC-KI;Stat3EEC-KO mice. β-actin is used as a loading control. Right: Densitometric analysis of Western blot. All values were normalized to loading control. Fold change was calculated based on experimental control. n = 3 mice per experimental group. ∗P < .05, ∗∗P < .01, and ∗∗∗P < .001. Bar graphs represent means ± SD. All statistics were determined by 1-way analysis of variance (ANOVA) with the post hoc Tukey multiple comparison test. IRES, Internal Ribosome Entry Site; loxP, locus of X-over P1.
Figure 3
Figure 3
Transcriptomic analysis identifies pathways differentially regulated by STAT3 downstream of activation of IKKβ. (A) RNA sequencing was performed on samples enriched for esophageal epithelial cells from mice. The number of differentially expressed genes (DEGs) from IkkβcaEEC-KI, Stat3EEC-KO, and IkkβcaEEC-KI;Stat3EEC-KO mice as compared with control are shown. n = 3 mice per experimental group. (B) Venn diagrams showing overlap of DEGs from each comparison. (C) Heat map representing the log2 fold change for all DEGs identified from RNA sequencing across all comparisons. (D) DEGs from each comparison were used to identify enrichment of functional pathways by Gene Ontology analysis. A heatmap of the top enriched pathways is shown. Ctrl, control; ERK, extracellular signal-regulated kinase; FDR, false-discovery rate, log2FC, log2 fold change.
Figure 4
Figure 4
Loss of epithelial Stat3 reduces the recruitment of neutrophils in the esophagus of IKKβcaEEC-KImice. (A and B) Flow cytometry was used to quantify immune cells isolated from mouse esophagi. (A) Live CD45+/CD11b+/Ly6Ghi cells were identified as neutrophils, as seen by representative contour plots. (B) The percentage of CD11b+/Ly6Ghi neutrophils per total CD45+ cells show that loss of Stat3 significantly diminishes the presence of neutrophils in the esophagus of IkkβcaEEC-KI mice. n = 6 mice per experimental group. ∗∗∗P < .001, ∗∗∗∗P < .0001. Bar graphs represent means ± SD. Statistics were determined by 1-way analysis of variance with the post hoc Tukey multiple comparison test. (C) Representative immunofluorescence staining for MPO is shown in mouse esophageal sections. Infiltration of MPO-positive cells into the esophagus is diminished in IkkβcaEEC-KI;Stat3EEC-KO mice compared with IkkβcaEEC-KI mice. Serial sections were used to examine MPO, GFP, and p-STAT3 expression. Dotted white line indicates the location of the basement membrane. n = 3 mice per experimental group. Scale bars: 100 μm. (D and E) Bar graphs showing the fraction of neutrophils per total CD45+ cells isolated from mouse (D) peripheral blood and (E) spleen. n = 6 mice per experimental group. Bar graphs represent means ± SD. Statistics were determined by 1-way analysis of variance with the post hoc Tukey multiple comparison test. ∗P < .05, ∗∗P < .01, and ∗∗∗∗P < .0001. (F–H) Using quantitative PCR, mRNA expression levels of the neutrophil-expressed genes (F) Lcn2 and (G) S100a8, and of the neutrophil chemoattractant gene (H) Cxcl5 in enriched mouse esophageal epithelia were decreased in IkkβcaEEC-KI;Stat3EEC-KO mice compared with IkkβcaEEC-KI mice. Bar graphs represent means ± SD. Statistics were determined by 1-way analysis of variance with the post hoc Tukey multiple comparison test. (F) n = 3 mice per experimental group, ∗P < .05, ∗∗P < .01, and ∗∗∗∗P < .0001. (G) n = 3 mice per experimental group, ∗∗∗P < .001 and ∗∗∗∗P < .0001. (H) n = 4 mice per experimental group, ∗P < .05, ∗∗∗P < .001, and ∗∗∗∗P < .0001. DAPI, 4’,6-diamidino-2-phenylindole.
Figure 5
Figure 5
Increased IL23 expression/secretion regulates epithelial STAT3 activation and the recruitment of neutrophils to the esophagus. (A–D) Immunohistochemical staining for (A and B) GFP or (C and D) p-STAT3 (Y705) in esophageal serial sections of (A and C) control and (B and D) IKKβcaEEC-KI mice. Immunostaining shows GFP expression (dotted lines) specifically in esophageal epithelial cells of (B) IkkβcaEEC-KI mice, compared with (A) control mice with no GFP expression. Increased nuclear expression of p-STAT3 (Y705) is seen in esophageal epithelial cells from (D) IkkβcaEEC-KI mice compared with (C) controls. (D) In addition, increased intensity of epithelial p-STAT3 is seen outside of GFP-positive regions (black arrowheads) in IkkβcaEEC-KI mice. n = 4 mice per experimental group. Scale bar: 50 μm. (E) Heat map representing the log2 fold change for the JAK-STAT pathway–associated differentially expressed genes from RNA sequencing. (F) Table summarizing the log2 fold change for Il23a expression levels from RNA sequencing. (G) By quantitative PCR, mRNA expression levels of the cytokine Il23a in mouse esophageal mucosa are increased in IkkβcaEEC-KI and IkkβcaEEC-KI;Stat3EEC-KO mice compared with control mice. n = 3 mice per experimental group. Bar graphs represent means ± SD. Statistics were determined by 1-way analysis of variance with the post hoc Tukey multiple comparison test. ∗∗P < .01 and ∗∗∗P < .001. (H) IkkβcaEEC-KI and control mice were treated with either an IgG1 control or an IL23p19 neutralizing antibody every Monday and Thursday for 2 weeks and analyzed by immunoblot for p-STAT3 (Y705) levels. Blocking IL23p19 decreases p-STAT3 (Y705) levels in Ikkβca mice compared with IgG treatment. Increased IKKβ expression was observed in IkkβcaEEC-KI mice compared with controls, and GAPDH was used as a loading control. Right: Densitometric analysis of Western blot. p-STAT3 values were normalized to total protein expression, and total protein values were normalized to loading control. Fold change was calculated based on experimental control. n = 3 mice per experimental group. ∗P < .05, ∗∗P < .01, ∗∗∗P < .001, and ∗∗∗∗P < .0001. Bar graphs represent means ± SD. All statistics were determined by 1-way analysis of variance with the post hoc Tukey multiple comparison test. (I) IkkβcaEEC-KI and control mice were treated with either an IgG2a control or an IL12p40 neutralizing antibody every Monday and Thursday for 2 weeks and analyzed by immunoblot for p-STAT3 (Y705) levels. Blocking IL12p40 decreases p-STAT3 (Y705) levels in Ikkβca mice compared with IgG treatment. Increased IKKβ expression was observed in IkkβcaEEC-KI mice compared with controls, and GAPDH was used as a loading control. Right: Densitometric analysis of Western blot. p-STAT3 values were normalized to total protein expression, and total protein values were normalized to loading control. Fold change was calculated based on experimental control. n = 3 mice per experimental group. ∗P < .05, ∗∗P < .01, ∗∗∗P < .001, and ∗∗∗∗P < .0001. Bar graphs represent means ± SD. All statistics were determined by 1-way analysis of variance with the post hoc Tukey multiple comparison test. (J and K) Flow cytometry was used to quantify neutrophils isolated from mouse esophagi. (J) Live CD45+/CD11b+/Ly6Ghi cells were identified as neutrophils, as seen by representative contour plots. (K) The total counts of CD11b+/Ly6Ghi neutrophils show that IL23 p19 neutralization significantly diminishes the presence of neutrophils in the esophagus of IkkβcaEEC-KI mice. Because the cell counts were not normally distributed, these were log-transformed for statistical analyses. n = 5 mice per experimental group. Bar graphs represent means ± SD. Statistics were determined by 1-way analysis of variance with the Sidak multiple comparison test. ∗P < .05, ∗∗P < .01. Ctrl, control; FDR, false-discovery rate; log2FC, log2 fold change.
Figure 6
Figure 6
P-p65 NF-κB, p-STAT3, and MPO expression increases during progression from normal esophagus to chronic inflammation to epithelial hyperplasia in human patients. (A) Representative immunohistochemistry panels from normal esophagus, chronic inflammation, and atypical hyperplasia. Expression of P-p65 NF-κB, p-STAT3, and MPO increased in chronic inflammation and atypical hyperplasia compared with normal esophagus. Scale bar: 100 μm. (B) 100% stacked bar chart indicates the scoring of P-p65 NF-κB, p-STAT3, and MPO levels by pathologic diagnosis for human patients with normal esophagus, chronic inflammation, and hyperplasia, on a scale from 0 to 5. Normal esophagus, n = 41; chronic inflammation, n = 8; hyperplasia, n = 17. Atyp. Hyper., atypical hyperplasia; Chron. Inflam., chronic inflammation.

References

    1. Peery A.F., Crockett S.D., Murphy C.C., Lund J.L., Dellon E.S., Williams J.L., Jensen E.T., Shaheen N.J., Barritt A.S., Lieber S.R., Kochar B., Barnes E.L., Fan Y.C., Pate V., Galanko J., Baron T.H., Sandler R.S. Burden and cost of gastrointestinal, liver, and pancreatic diseases in the United States: update 2018. Gastroenterology. 2019;156:254–272.e11. - PMC - PubMed
    1. Bellizzi A.M., Nardone G., Compare D., Bor S., Capanoglu D., Farré R., Neumann H., Neurath M.F., Vieth M., Chen H., Chen X. Tissue resistance in the normal and diseased esophagus. Ann N Y Acad Sci. 2013;1300:200–212. - PubMed
    1. Dunbar K.B., Agoston A.T., Odze R.D., Huo X., Pham T.H., Cipher D.J., Castell D.O., Genta R.M., Souza R.F., Spechler S.J. Association of acute gastroesophageal reflux disease with esophageal histologic changes. JAMA. 2016;315:2104–2112. - PMC - PubMed
    1. Lee H.J., Park J.M., Han Y.M., Gil H.K., Kim J., Chang J.Y., Jeong M., Go E.J., Hahm K.B. The role of chronic inflammation in the development of gastrointestinal cancers: reviewing cancer prevention with natural anti-inflammatory intervention. Expert Rev Gastroenterol Hepatol. 2016;10:129–139. - PubMed
    1. Chen X.X., Zhong Q., Liu Y., Yan S.M., Chen Z.H., Jin S.Z., Xia T.L., Li R.Y., Zhou A.J., Su Z., Huang Y.H., Huang Q.T., Huang L.Y., Zhang X., Zhao Y.N., Yun J.P., Wu Q.L., Lin D.X., Bai F., Zeng M.S. Genomic comparison of esophageal squamous cell carcinoma and its precursor lesions by multi-region whole-exome sequencing. Nat Commun. 2017;8:524. - PMC - PubMed

Publication types

LinkOut - more resources