. 2021 Jul 26;22(1):214.
doi: 10.1186/s13059-021-02419-7.

STRONG: metagenomics strain resolution on assembly graphs

Affiliations

STRONG: metagenomics strain resolution on assembly graphs

Christopher Quince et al. Genome Biol. .

Abstract

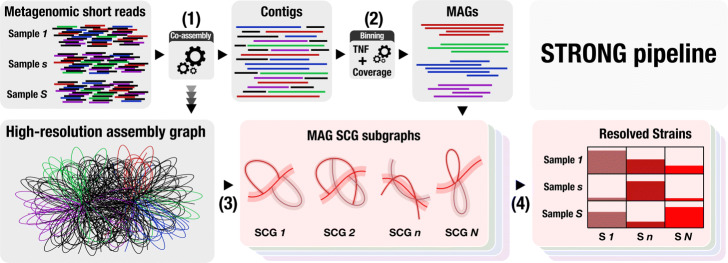
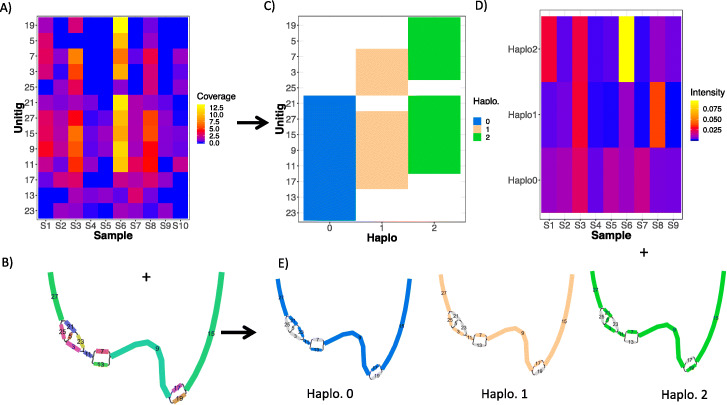
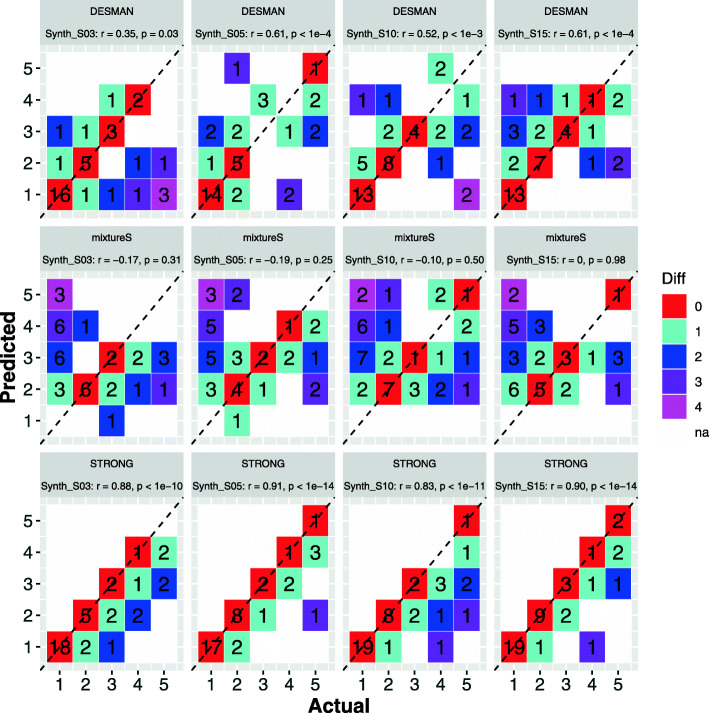
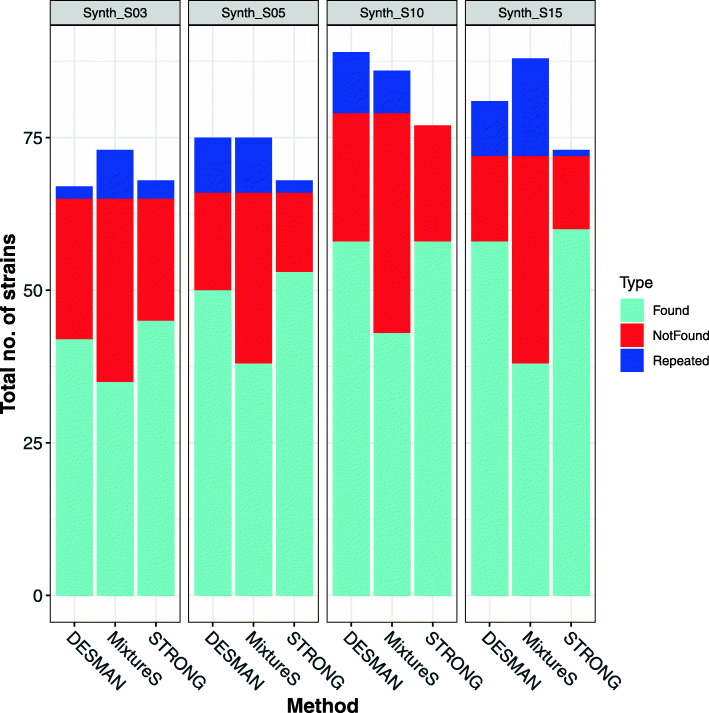
We introduce STrain Resolution ON assembly Graphs (STRONG), which identifies strains de novo, from multiple metagenome samples. STRONG performs coassembly, and binning into metagenome assembled genomes (MAGs), and stores the coassembly graph prior to variant simplification. This enables the subgraphs and their unitig per-sample coverages, for individual single-copy core genes (SCGs) in each MAG, to be extracted. A Bayesian algorithm, BayesPaths, determines the number of strains present, their haplotypes or sequences on the SCGs, and abundances. STRONG is validated using synthetic communities and for a real anaerobic digestor time series generates haplotypes that match those observed from long Nanopore reads.

Keywords: Assembly graph; Bayesian; Metagenome; Microbial community; Microbiome; Strains.


Conflict of interest statement

Aaron Darling is a cofounder of Longas Technologies Pty Ltd, a company that is developing synthetic long read sequencing technologies.

Figures

Fig. 1
Fig. 1
STRONG pipeline. This figure illustrates the principal steps in the STRONG pipeline (see “Methods - STRONG pipeline” section). Step 1) Co-assembly with metaSPAdes and storage of a high-resolution graph (HRG). Step 2) Contig binning with CONCOCT or Metabat2 and annotation of single-copy core genes (SCGs). Step 3) Mapping of SCGs onto the HRG and extraction of individual SCG assembly graphs together with per-sample unitig coverages. Step 4) Joint solution of SCG assembly graphs from each MAG with BayesPaths to determine strain number, haplotypes and per-sample coverages
Fig. 2
Fig. 2
BayesPaths algorithm. This illustrates the BayesPaths algorithm for a single COG0532 from one MAG, Bin_55 of the ten sample synthetic data set. The algorithm predicted 3 strains. We show the input to the algorithm: A the unitig coverages across samples plus B the unitig graph without strain assignments. The outputs of the algorithm are shown in C the assignments of haplotypes to each unitig, D the strain intensities across samples, effectively coverage divided by read length (see “Methods - BayesPaths” section), and E unitig graphs for each haplotype with their most likely paths. This algorithm is explained in detail in the “Methods - BayesPaths” section
Fig. 3
Fig. 3
Actual versus predicted strain number for the synthetic community data sets. For each MAG we compare the actual number of strains against the predicted number. The number in each tile gives the total no. of MAGs observed with those values. The colour of a tile the divergence between true and predicted strain numbers. Results are shown for all four data sets Synth_S03, Synth_S05, Synth_S10 and Synth_S15 with increasing sample number and three algorithms, DESMAN, STRONG, and mixtureS. The results of Pearson’s correlations are given in the title texts
Fig. 4
Fig. 4
No. of strains resolved by STRONG, DESMAN and mixtureS algorithms in the synthetic community data sets. For MAGs with two or more strains we mapped haplotypes to the references and assigned each predicted haplotype to its best matching reference. The best such match was denoted ‘Found’. If multiple haplotypes matched to the same reference all but the best matching were denoted as ‘Repeated’. If a reference had no predicted haplotypes matched to it, it was denoted as ‘Not found’. The bars give the total numbers in each category summed over MAGs for the three methods (DESMAN, STRONG and mixtureS) and the panels results for the four different data sets with increasing number of samples (Synth_S03, Synth_S05, Synth_S10 and Synth_S15)
Fig. 5
Fig. 5
Error rates for ‘Found’ strains against coverage depth for STRONG, DESMAN and mixtureS algorithms in the synthetic community data sets. For the ‘Found’ strains we computed per base error rate to the matched reference, this is shown on the y-axis, against strain total coverage depth summed across samples on the x-axis, both axes are log transformed. The results are separated across methods (DESMAN, STRONG and mixtureS) and sample number in the synthetic community
Fig. 6
Fig. 6
Strain numbers resolved by STRONG in the high strain diversity synthetic community data sets. A For each MAG we compare the actual number of strains against the predicted number. The number in each tile gives the total no. of MAGs observed with those values. The colour of a tile the divergence between true and predicted strain numbers. Results are shown for all four high strain diversity data sets: Synth_M10_S03, Synth_M10_S05, Synth_M10_S10 and Synth_M10_S15 for the STRONG algorithm only. The results of Pearson’s correlations between actual and predicted strain number were for Synth_M10_S03 (r = 0.62, p = 0.04), Synth_M10_S05 (r = 0.57, p = 0.11), Synth_M10_S10 (r = 0.59, p = 0.05), and Synth_M10_S15 (r = 0.52, p = 0.10). B The same data are shown but now for each tile we give the mean fraction of predicted strains that were ‘Found’ i.e. mapped uniquely onto a reference strain
Fig. 7
Fig. 7
Number of strains resolved by STRONG against MAG coverage depth for the AD time series. Pearson’s correlation between coverage depth and number of strains (r=0.36,p=1.004e−10). The curve indicates a LOESS smoothing
Fig. 8
Fig. 8
MAG summary for anaerobic digester time series. For the 114 MAGs with aggregate coverage >20 we give their phylogeny constructed using concatenated marker genes together with their normalised coverages in the ten samples. We also indicate which MAGs significantly increased (SigUp) or decreased (SigDown) in total abundance (adjusted p<0.05), their GTDB phylum assignment, no. of strains resolved by STRONG and whether the strain abundances changed significantly over time (adjusted p<0.05) using permutation ANOVA (SigStrainChange)
Fig. 9
Fig. 9
Comparison of Nanopore reads to STRONG prediction for COG0532 from Bin_72. Non-metric multidimensional scaling of Nanopore reads that mapped to COG0532 from Bin_72 of the anaerobic digester time series (red) together with the three haplotypes reconstructed from short reads by STRONG (black 0, 1 and 2). Haplotypes 0 and 2 were identical for COG0532. Distances were calculated as fractional Hamming distances (see text) on short read variant positions (see “Methods - Nanopore sequence analysis” section). Blue dashed lines indicate read density contours

References

    1. Ahn T-H, Chai J, Pan C. Sigma: strain-level inference of genomes from metagenomic analysis for biosurveillance. Bioinformatics. 2014;31(2):170–7. doi: 10.1093/bioinformatics/btu641. - DOI - PMC - PubMed
    1. Albertsen M, Hugenholtz P, Skarshewski A, Nielsen KL, Tyson GW, Nielsen PH. Genome sequences of rare, uncultured bacteria obtained by differential coverage binning of multiple metagenomes. Nat Biotechnol. 2013;31:533. doi: 10.1038/nbt.2579. - DOI - PubMed
    1. Alneberg J, Bjarnason BS, de Bruijn I, Schirmer M, Quick J, Ijaz UZ, Lahti L, Loman NJ, Andersson AF, Quince C. Binning metagenomic contigs by coverage and composition. Nat Methods. 2014;11(11):1144–6. doi: 10.1038/nmeth.3103. - DOI - PubMed
    1. Baaijens JA, Van der Roest, Köster J, Stougie L, Schönhuth A. Full-length de novo viral quasispecies assembly through variation graph construction. Bioinformatics. 2019;35(24):5086–94. doi: 10.1093/bioinformatics/btz443. - DOI - PubMed
    1. Bernard E, Jacob L, Mairal J, Vert J-P. Efficient RNA isoform identification and quantification from RNA-Seq data with network flows. Bioinformatics. 2014;30(17):2447–55. doi: 10.1093/bioinformatics/btu317. - DOI - PMC - PubMed

Publication types