. 2021 Nov;19(11):1840-1853.
doi: 10.1158/1541-7786.MCR-21-0220. Epub 2021 Jul 26.

Heterogeneity and Cancer-Related Features in Lymphangioleiomyomatosis Cells and Tissue

Affiliations

Heterogeneity and Cancer-Related Features in Lymphangioleiomyomatosis Cells and Tissue

Roderic Espín et al. Mol Cancer Res. 2021 Nov.

Abstract

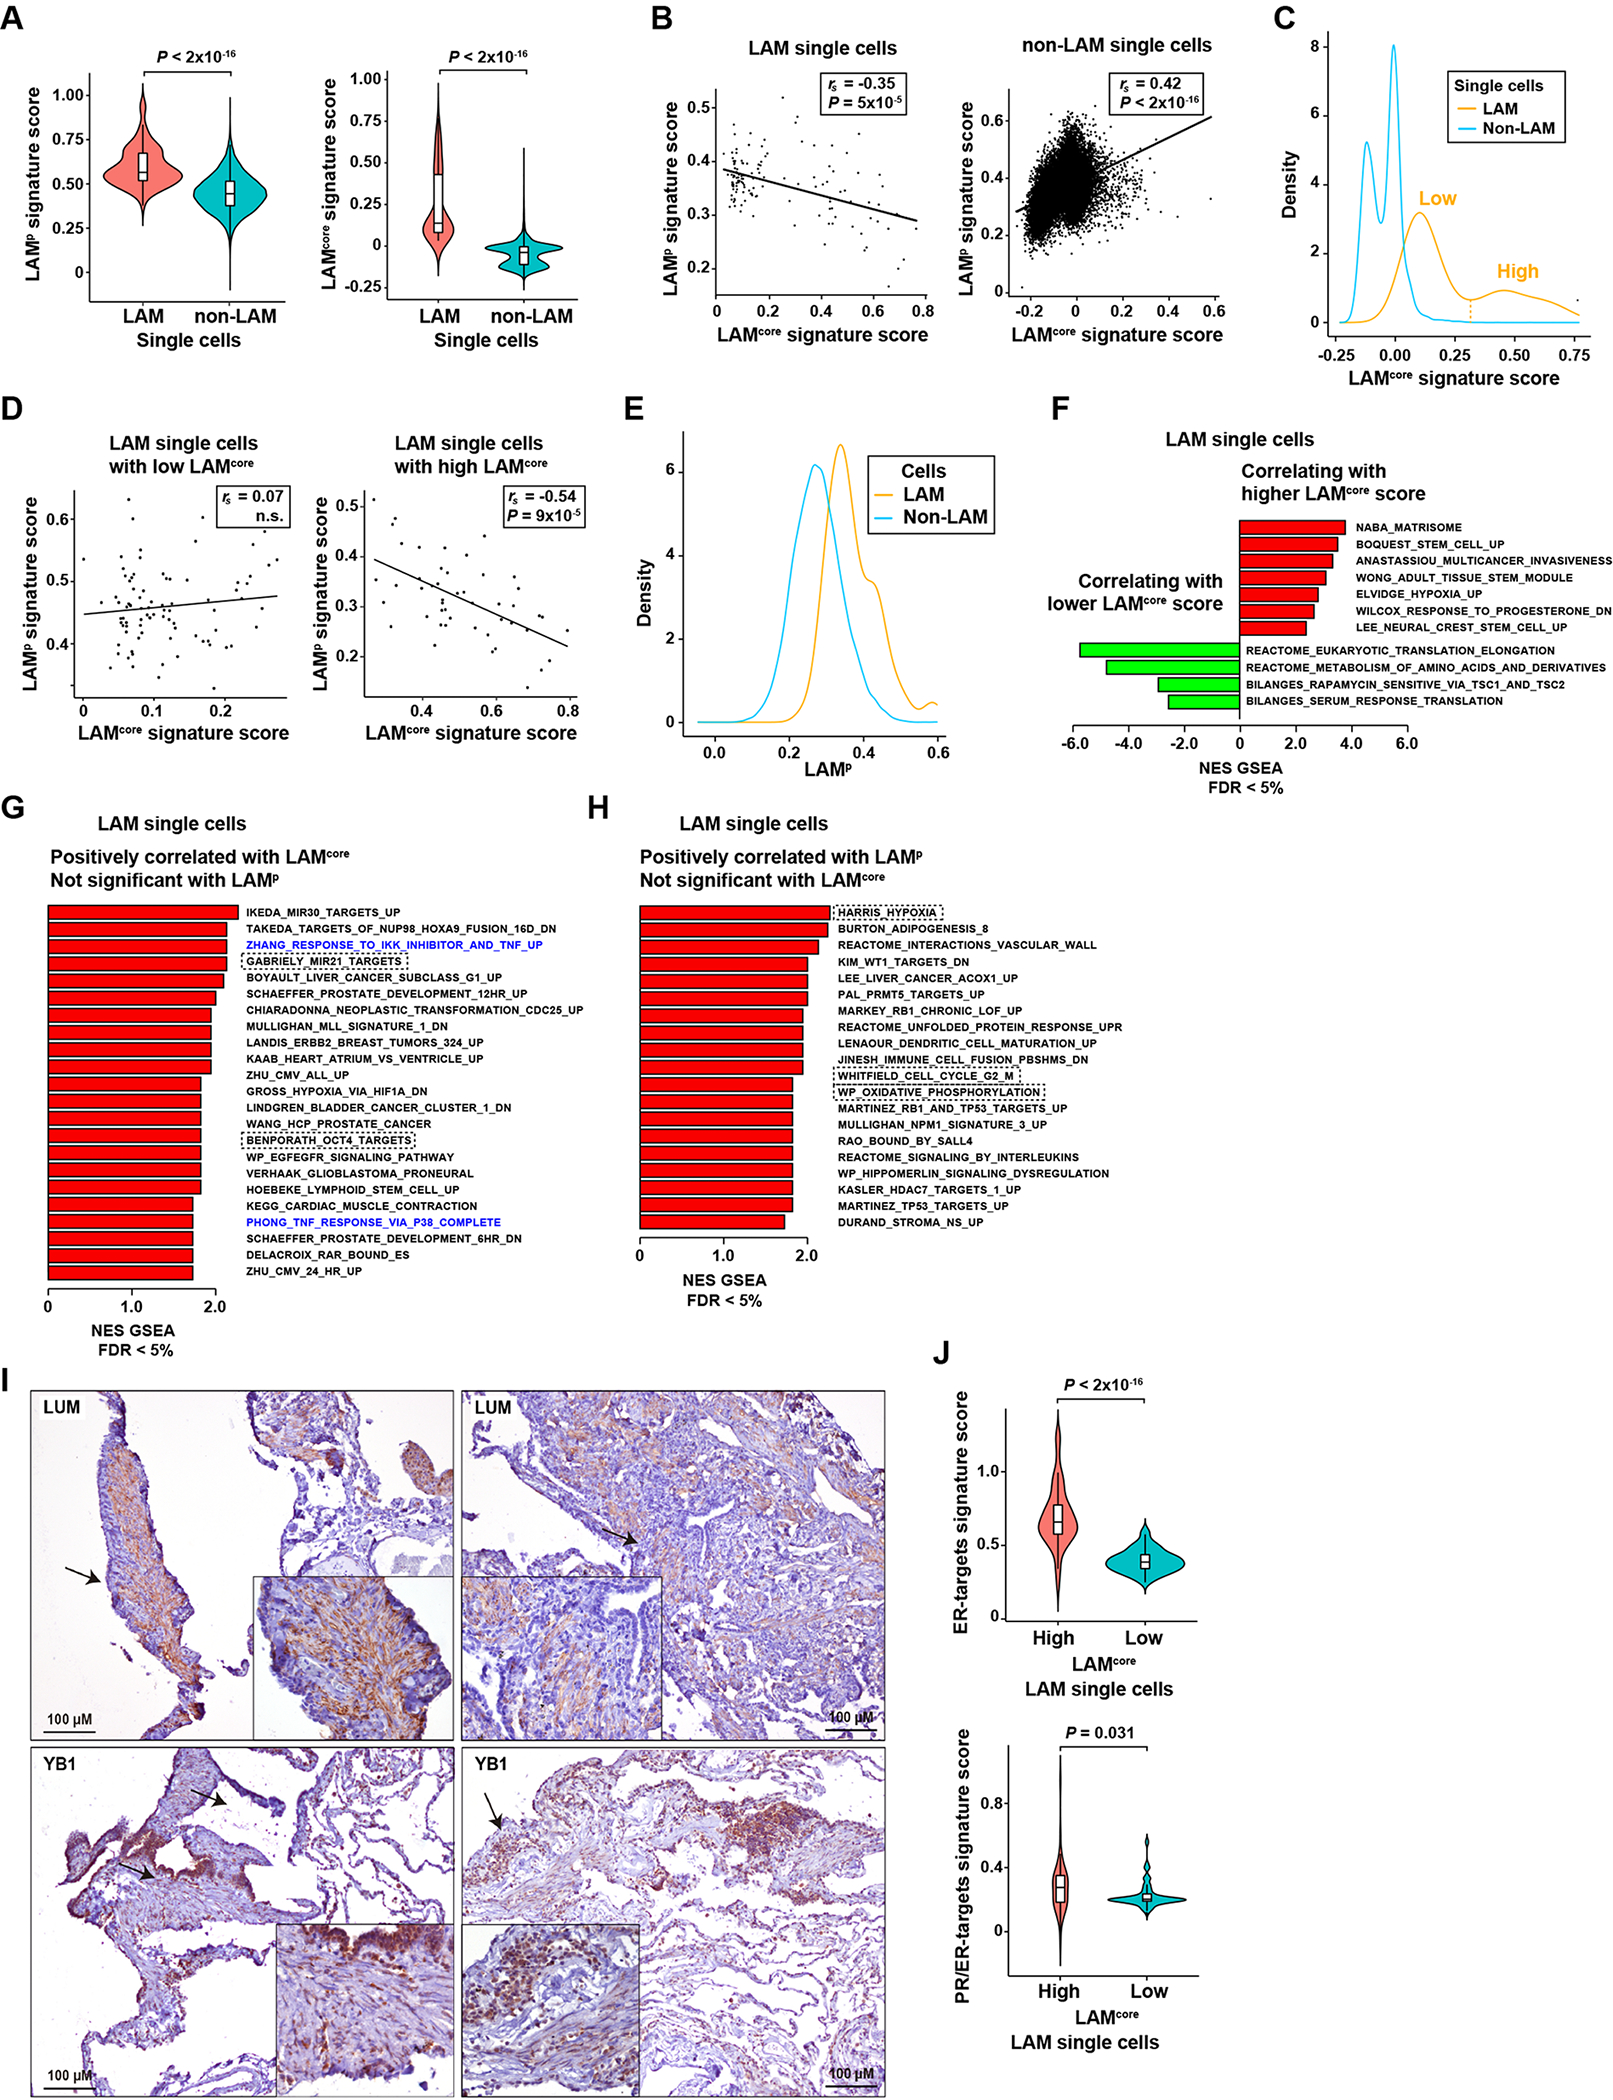
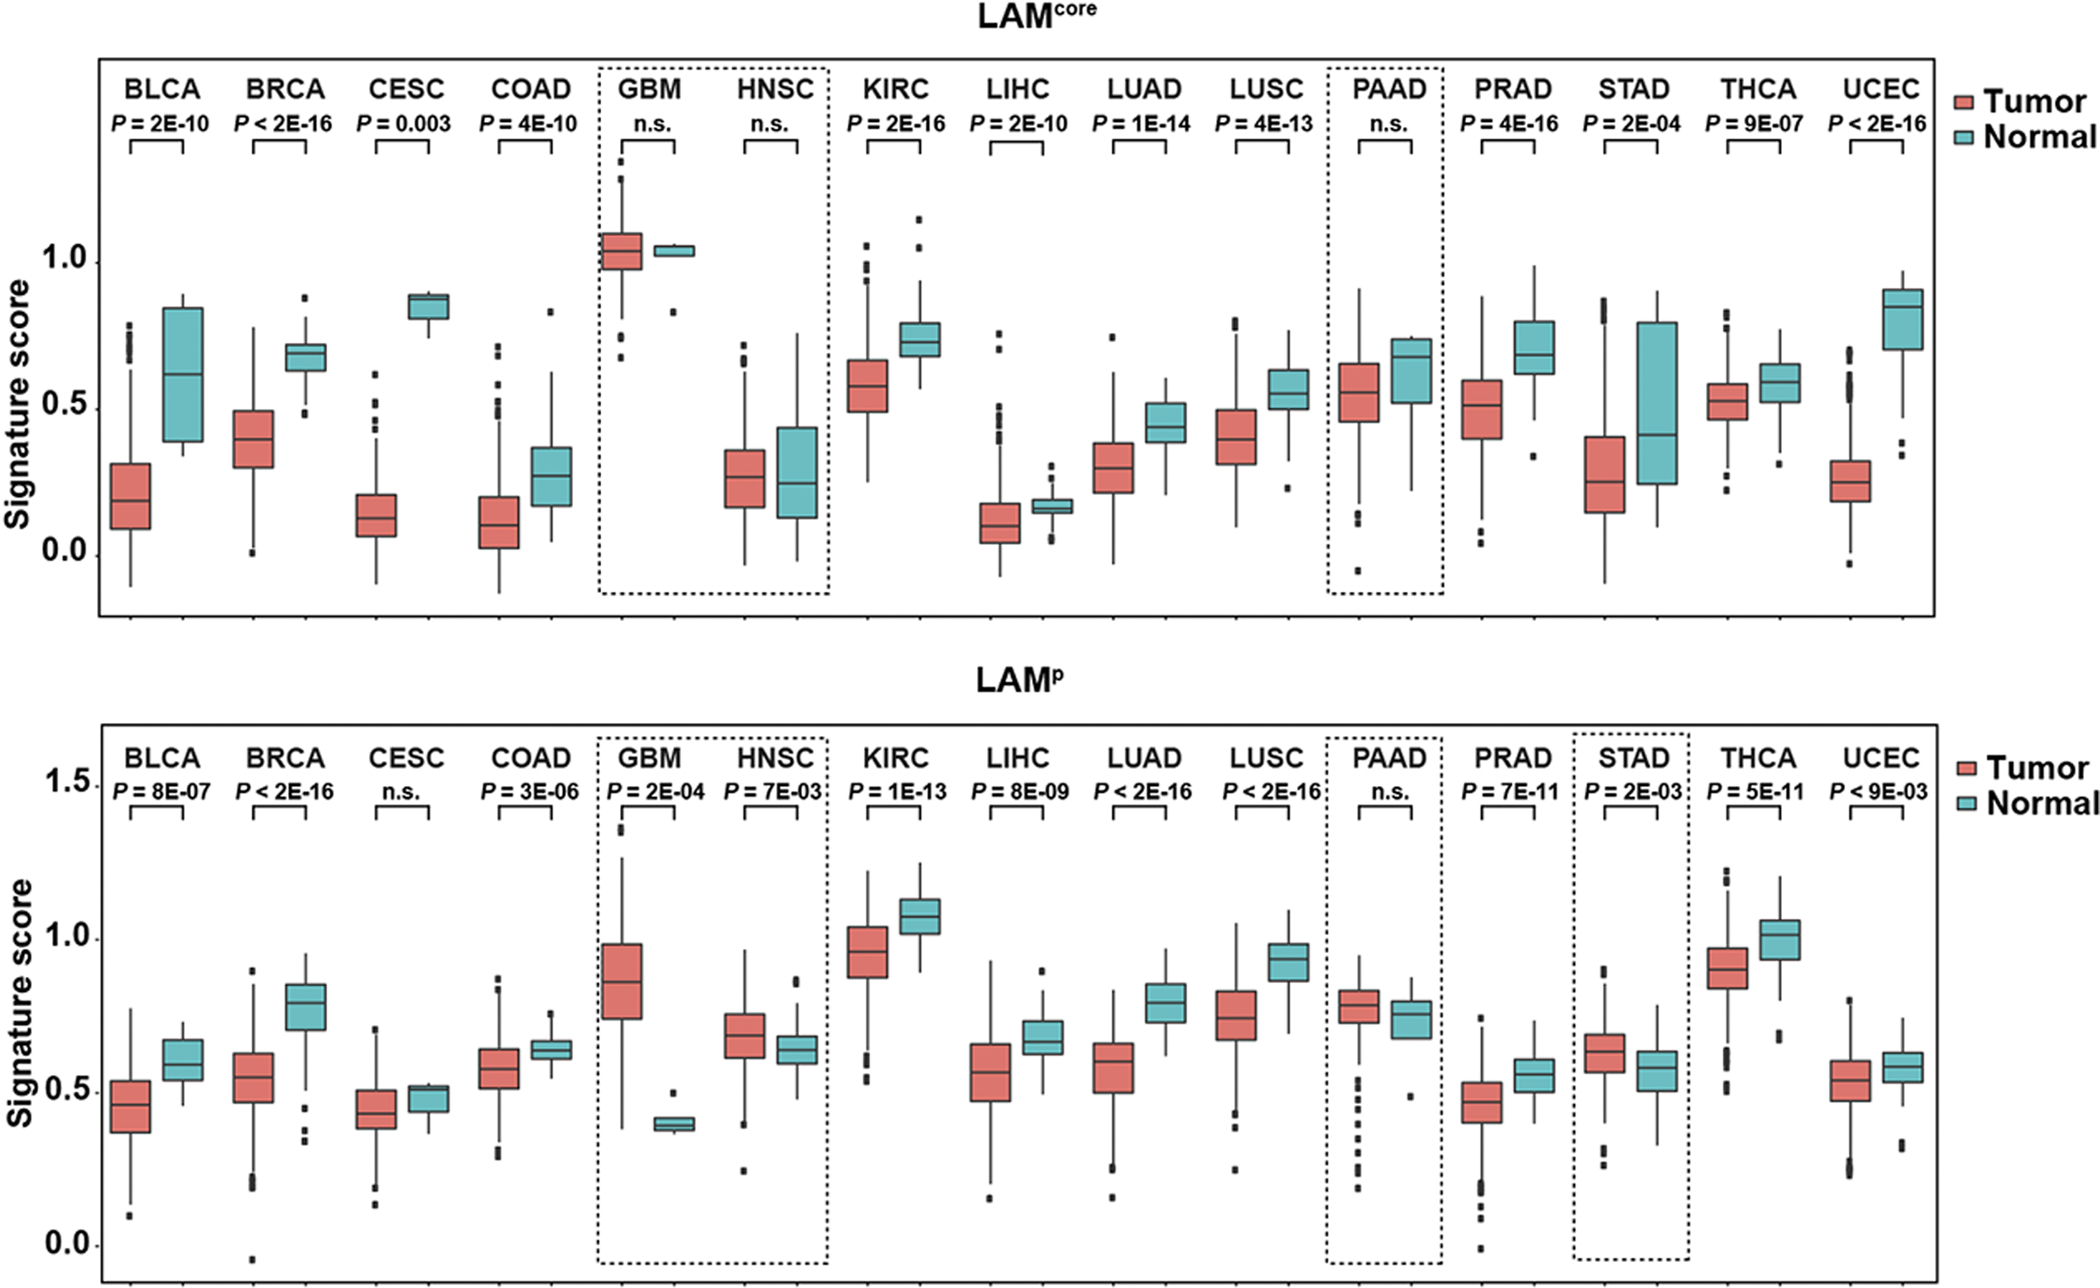
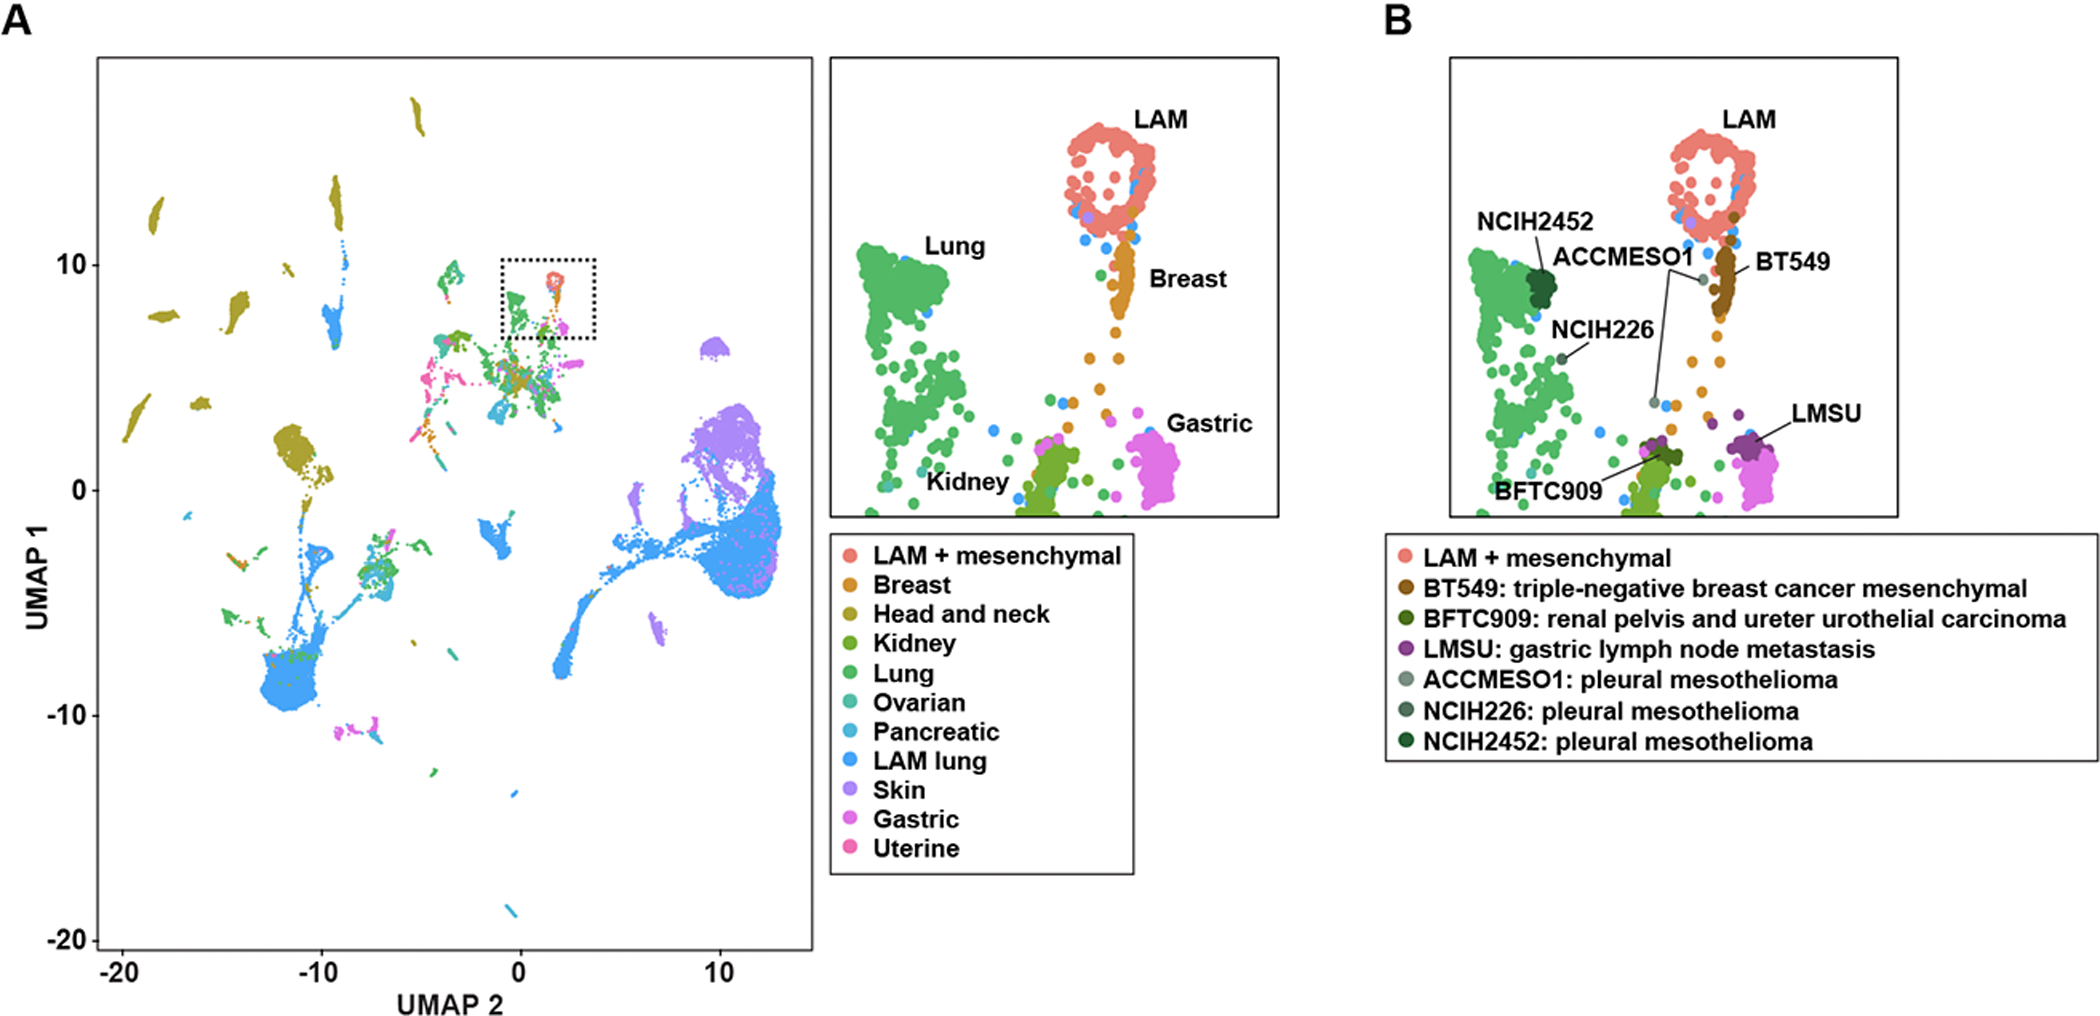
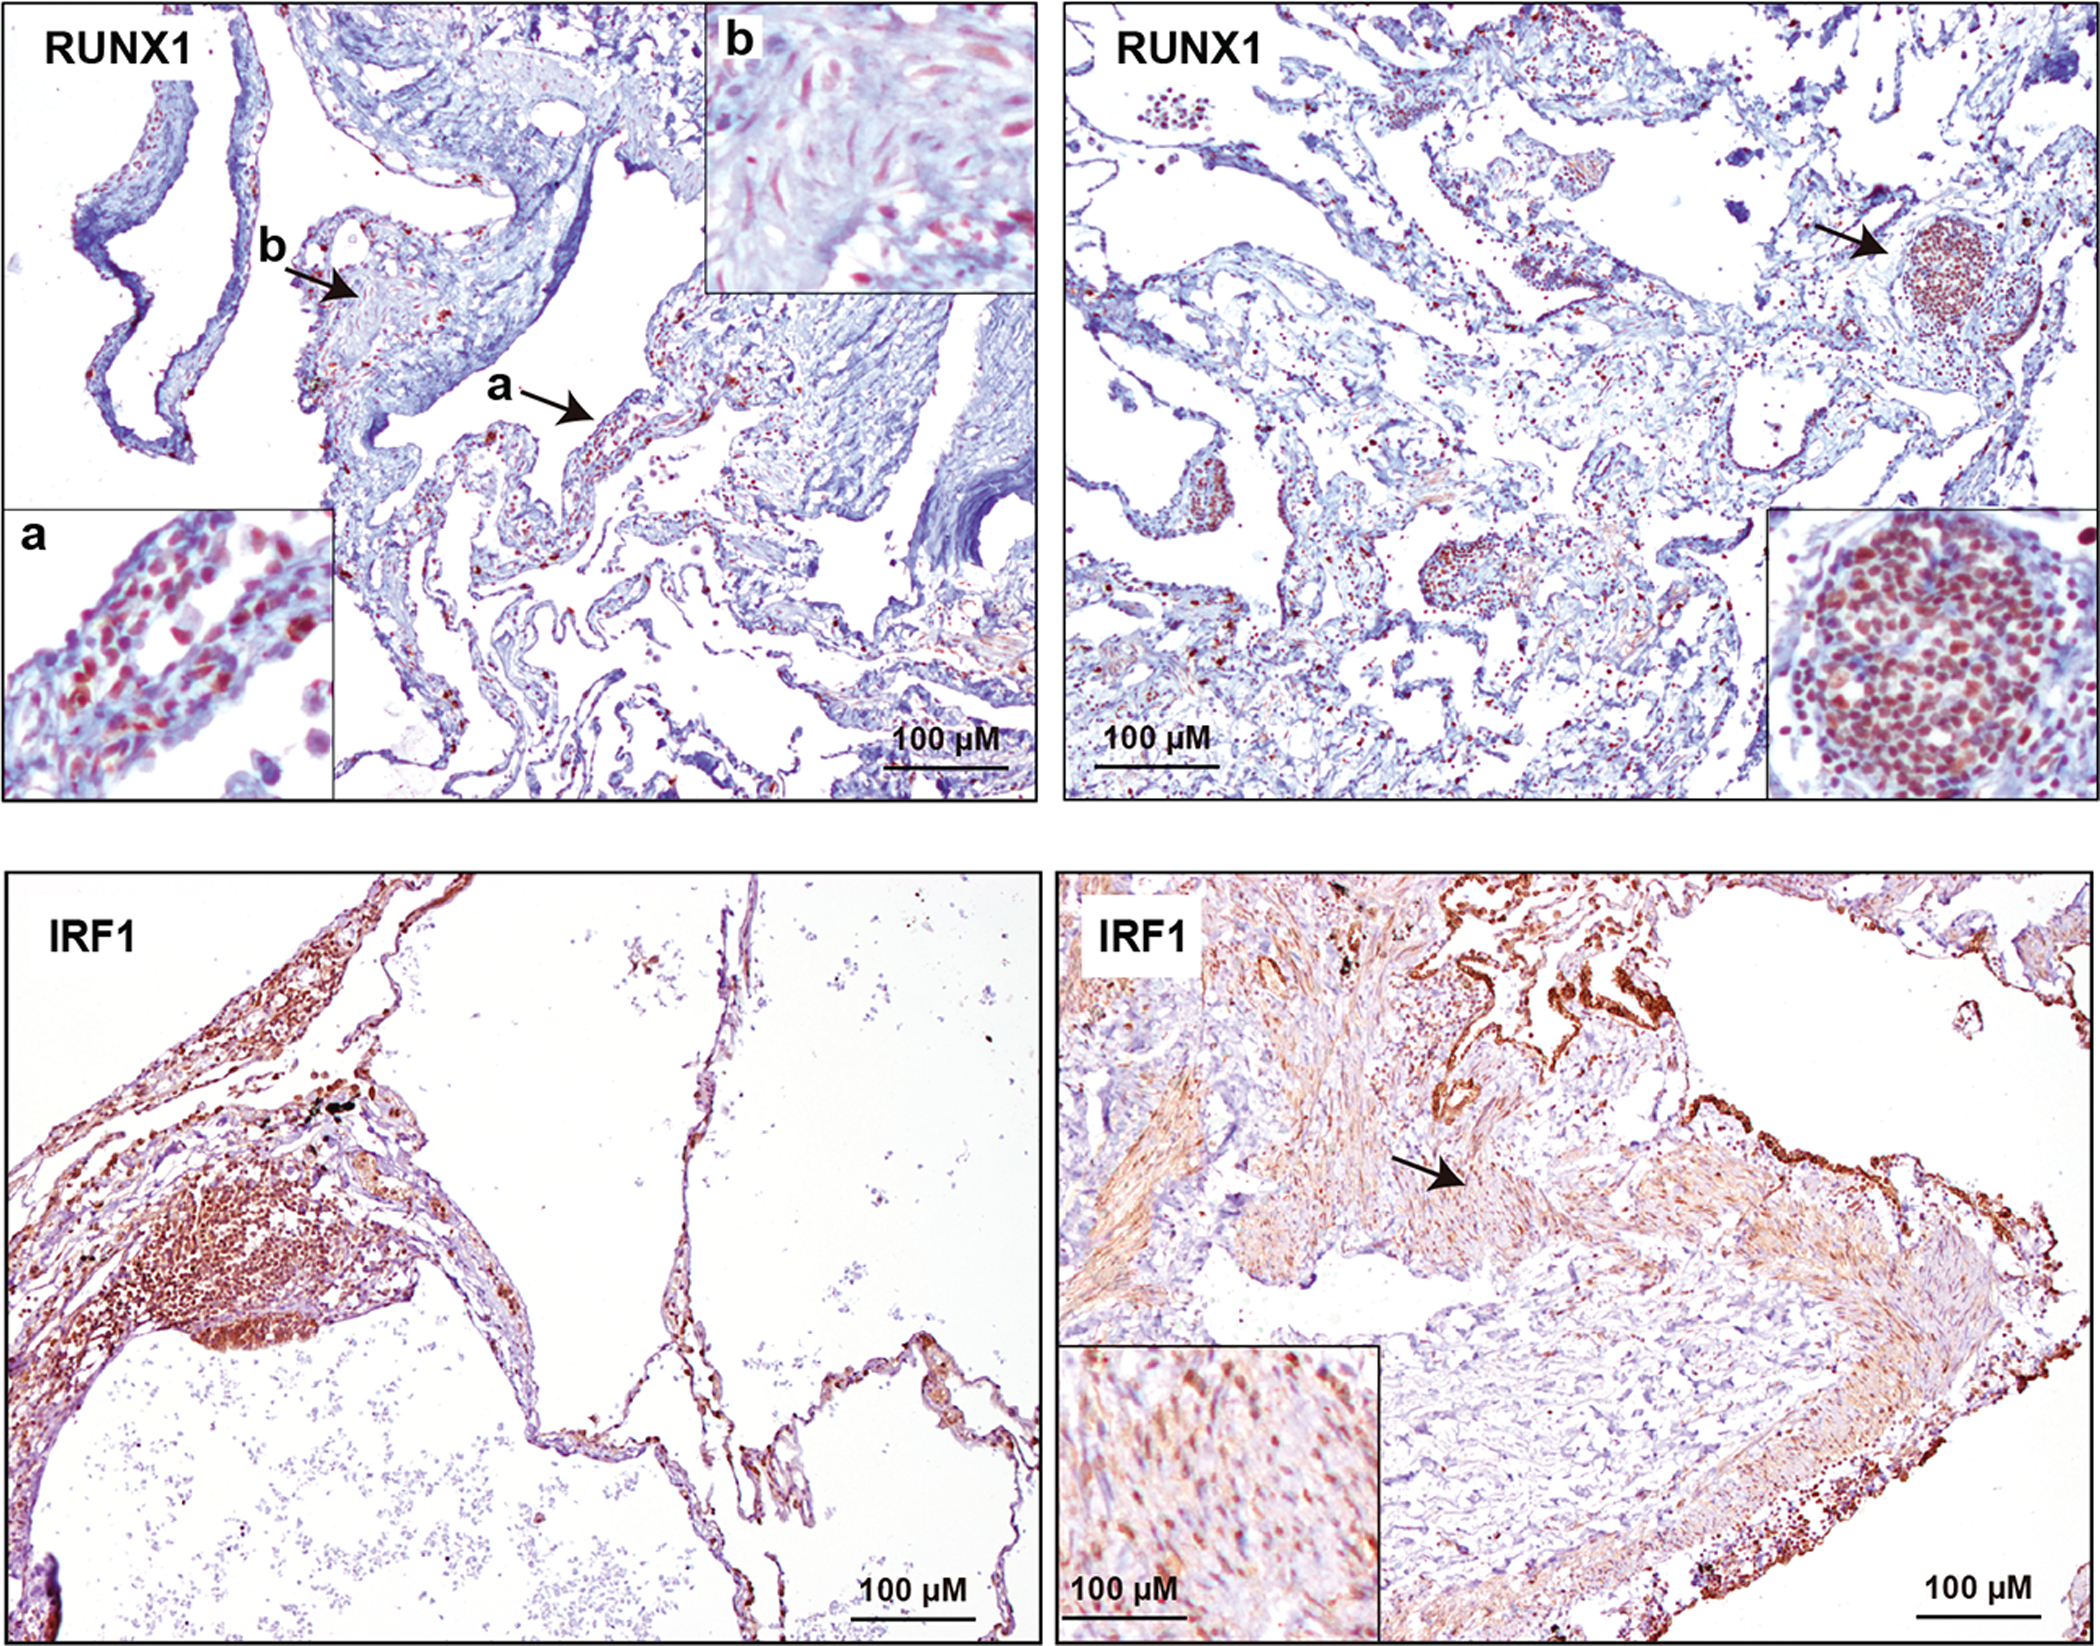
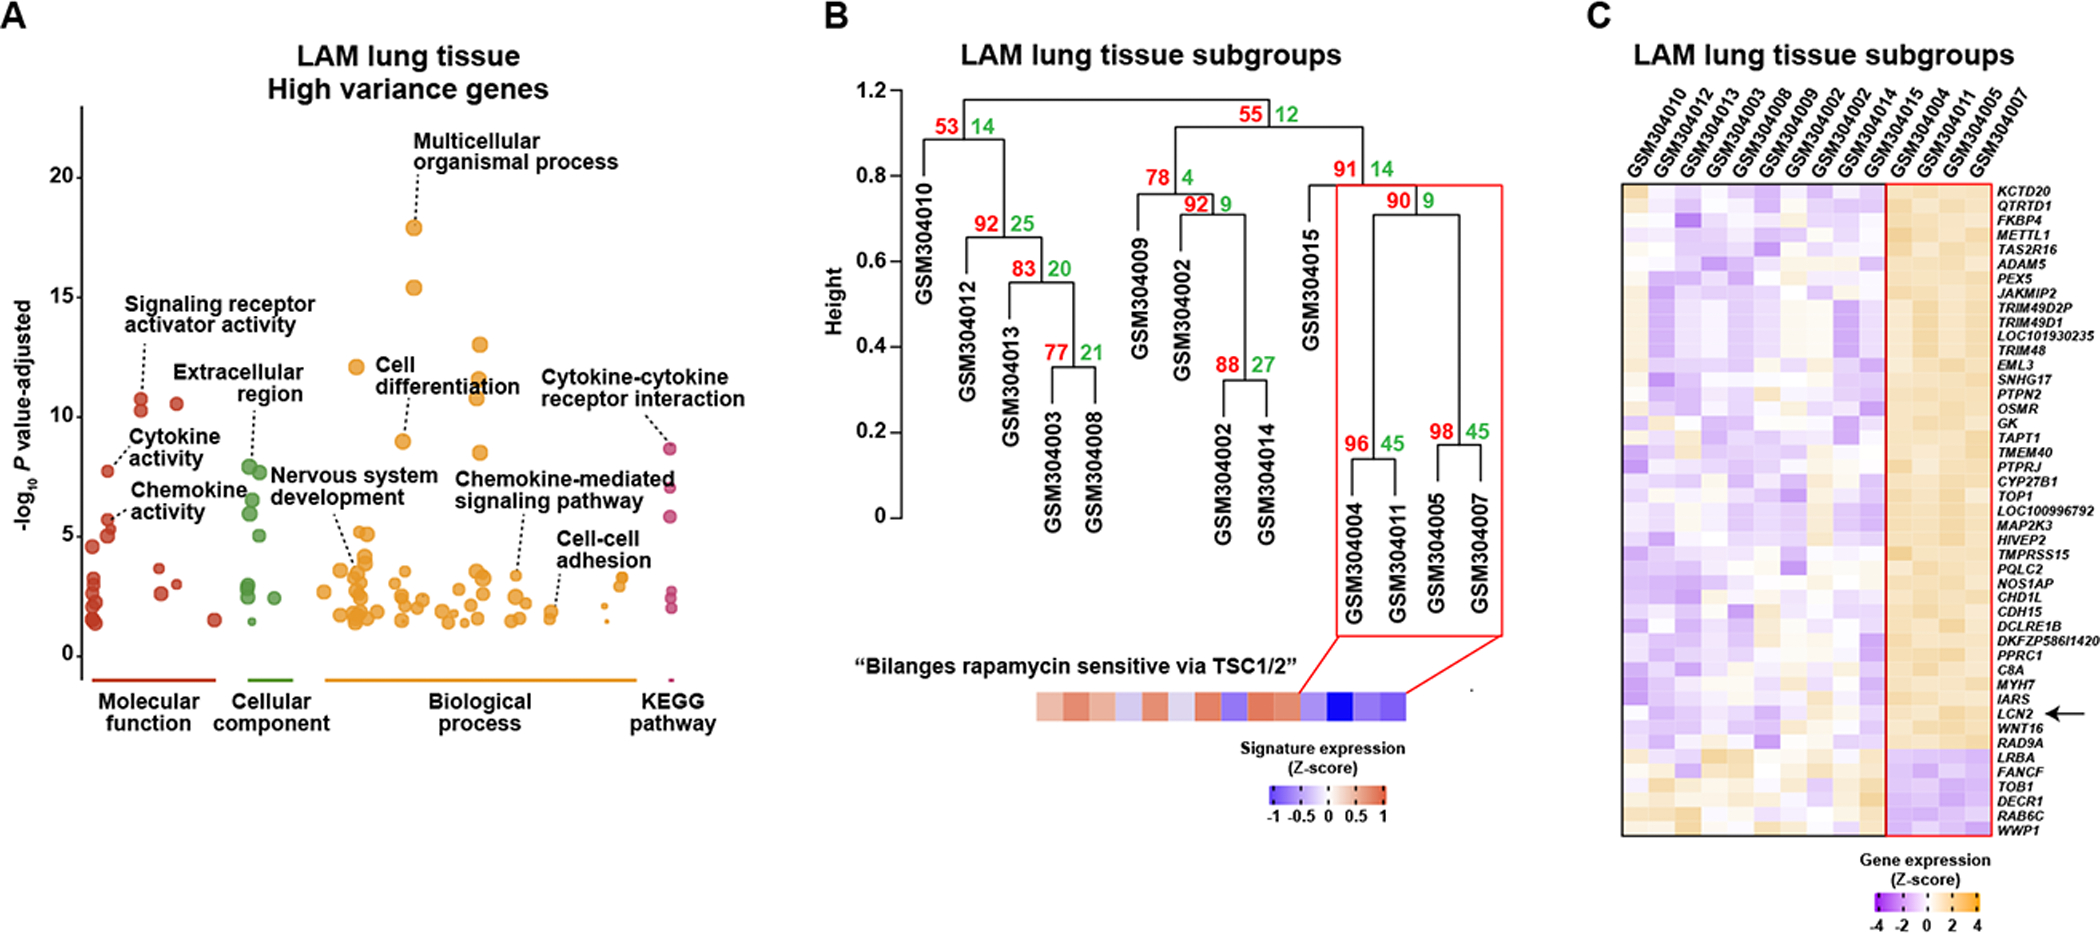
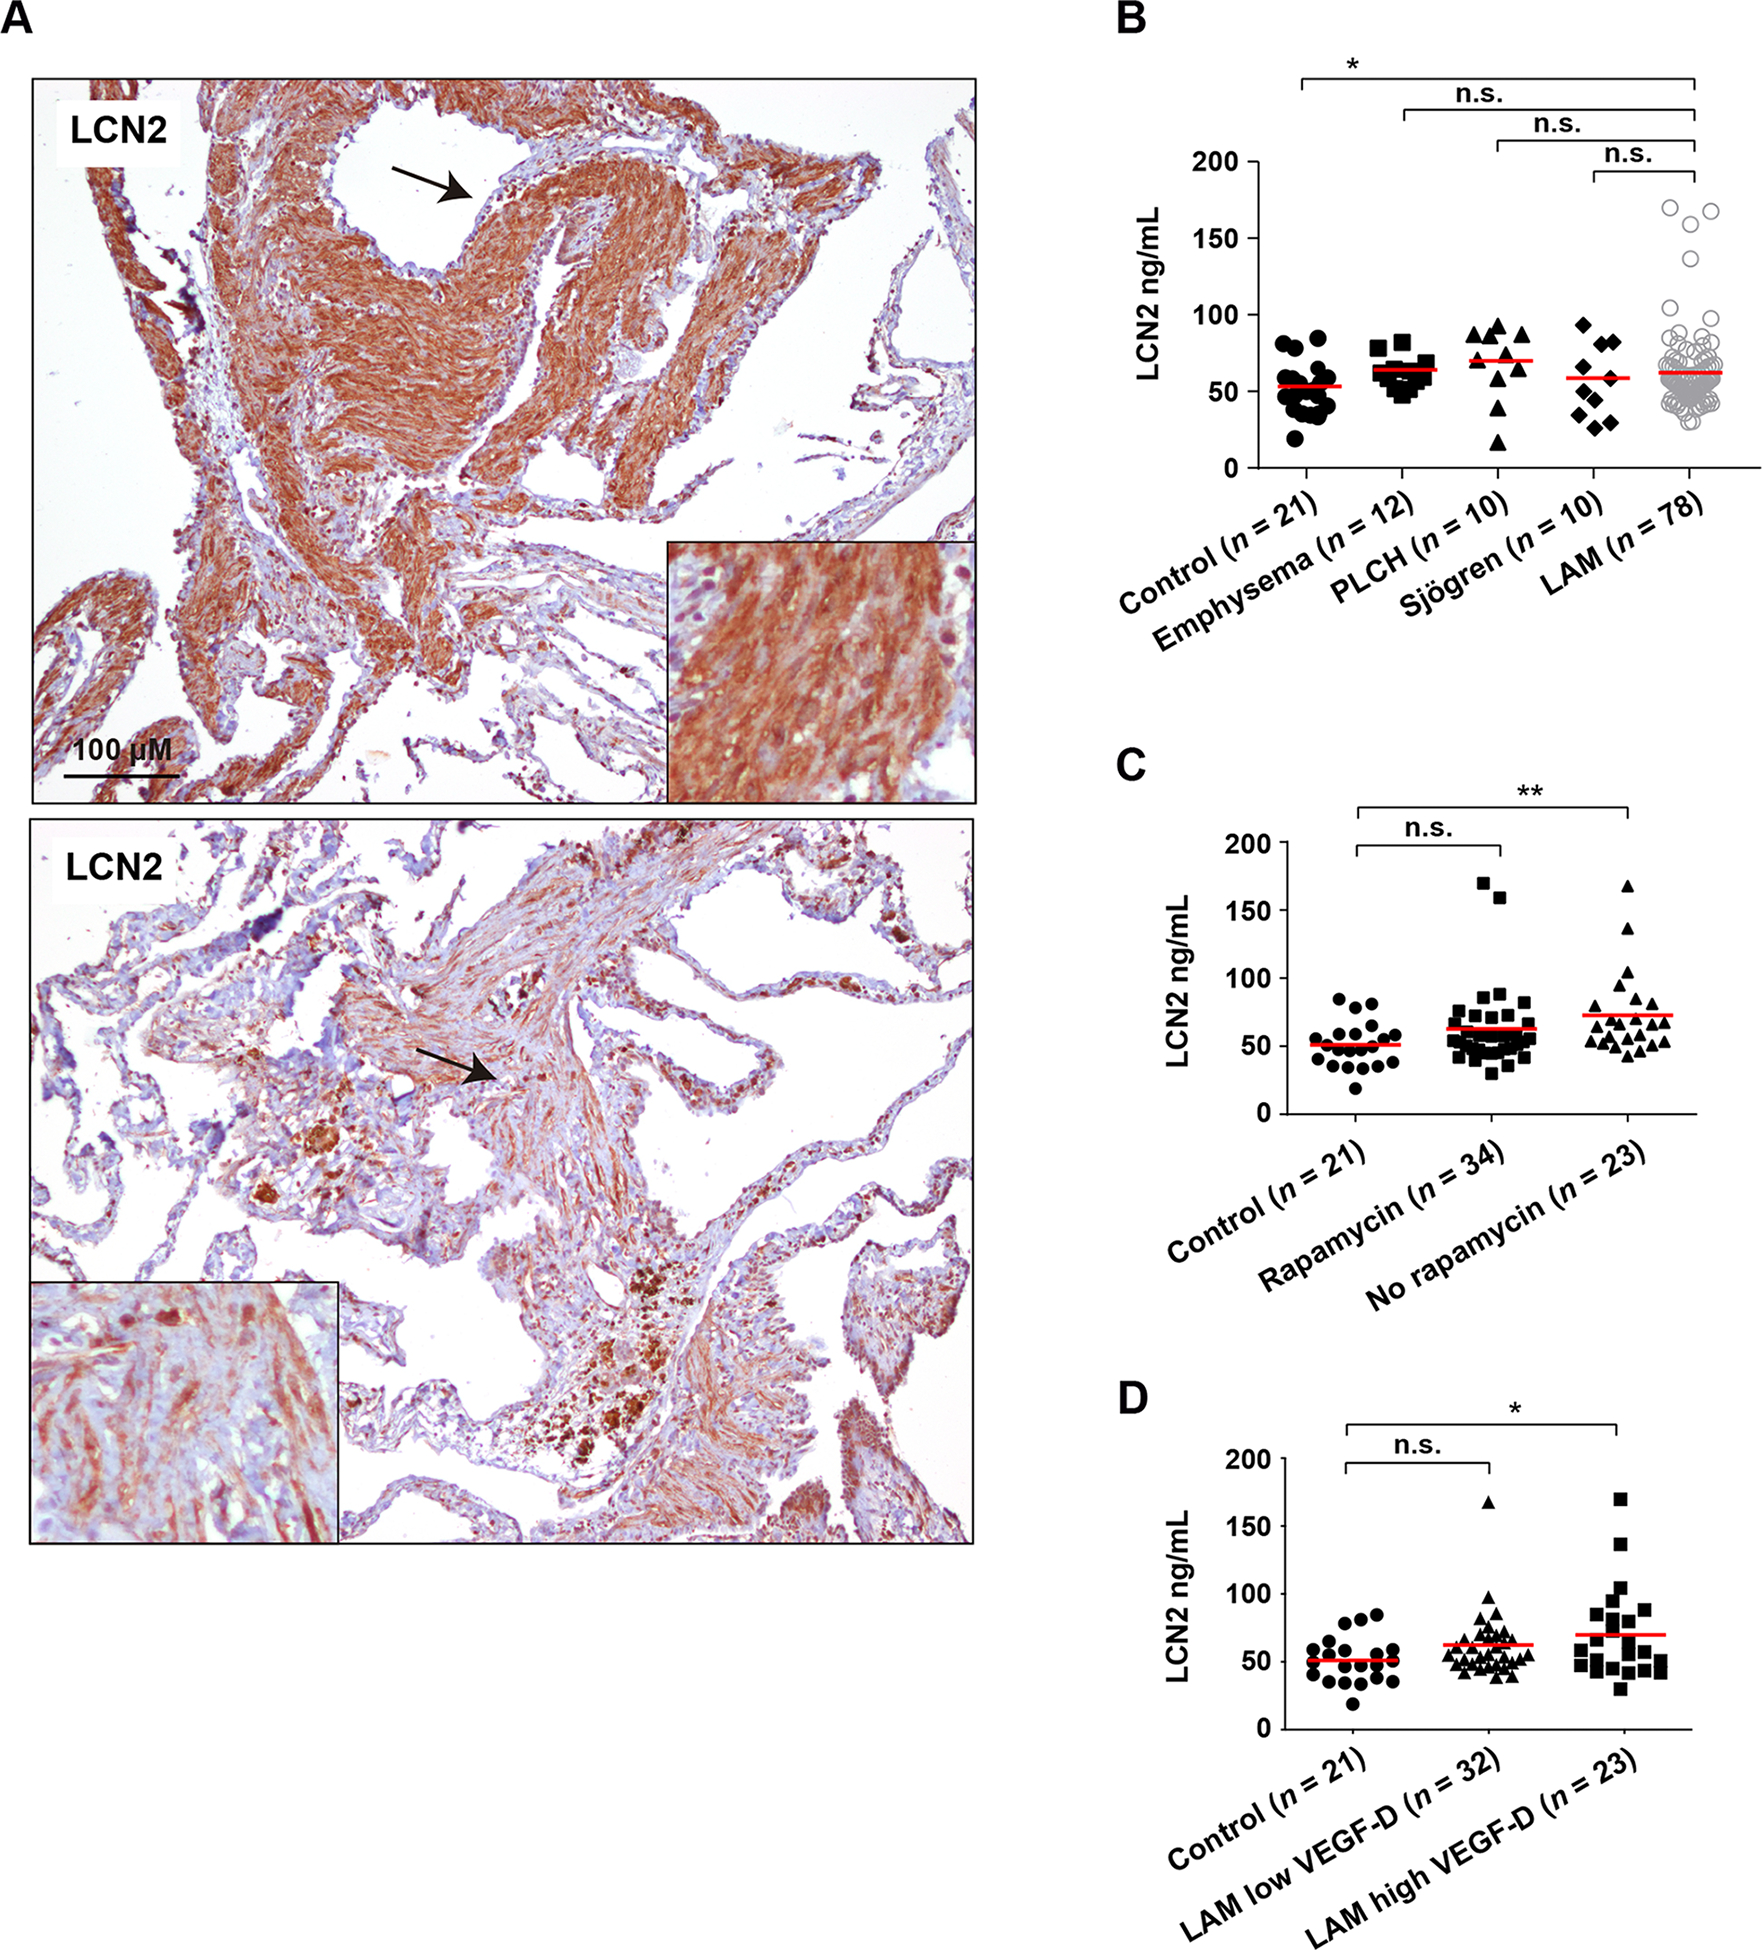
Lymphangioleiomyomatosis (LAM) is a rare, low-grade metastasizing disease characterized by cystic lung destruction. LAM can exhibit extensive heterogeneity at the molecular, cellular, and tissue levels. However, the molecular similarities and differences among LAM cells and tissue, and their connection to cancer features are not fully understood. By integrating complementary gene and protein LAM signatures, and single-cell and bulk tissue transcriptome profiles, we show sources of disease heterogeneity, and how they correspond to cancer molecular portraits. Subsets of LAM diseased cells differ with respect to gene expression profiles related to hormones, metabolism, proliferation, and stemness. Phenotypic diseased cell differences are identified by evaluating lumican (LUM) proteoglycan and YB1 transcription factor expression in LAM lung lesions. The RUNX1 and IRF1 transcription factors are predicted to regulate LAM cell signatures, and both regulators are expressed in LAM lung lesions, with differences between spindle-like and epithelioid LAM cells. The cancer single-cell transcriptome profiles most similar to those of LAM cells include a breast cancer mesenchymal cell model and lines derived from pleural mesotheliomas. Heterogeneity is also found in LAM lung tissue, where it is mainly determined by immune system factors. Variable expression of the multifunctional innate immunity protein LCN2 is linked to disease heterogeneity. This protein is found to be more abundant in blood plasma from LAM patients than from healthy women. IMPLICATIONS: This study identifies LAM molecular and cellular features, master regulators, cancer similarities, and potential causes of disease heterogeneity.


Conflict of interest statement

Conflicts of Interest Statement: B. Saez reports personal fees from MSD, Janssen, and Chiesi outside the submitted work. C. Valenzuela reports personal fees from Boehringer Ingelheim, F. Hoffmann-La Roche, Ltd., and BMS outside the submitted work. M. Molina- Molina reports grants from Roche and Boehringer Ing, grants and personal fees from Esteve-Teijin, and personal fees from Origo Pharma outside the submitted work. No disclosures were reported by the other authors.

Figures

Figure 1.
Figure 1.. LAM signatures and potential diseased-cell heterogeneity.
A, Violin plots showing higher LAMp and LAMcore signature scores in LAM cells than in non-LAM cells (scRNA-seq data from four LAM lung tissue (6)). Significance is indicated by Mann–Whitney test P values. The Y-axis scores show the combined expression value of the genes included in the corresponding signatures, computed using the ssGSEA algorithm (Methods). B, Scatter plots showing negative and positive LAMp-LAMcore score correlations in LAM (left panel) and non-LAM (right panel) cells, respectively. Spearman correlation coefficients (rs) and P values are indicated. The Y- and X-axis scores show the combined expression value of the genes included in the corresponding signatures, computed using the ssGSEA algorithm (Methods). C, Density plot showing the bimodal distribution of LAMcore in LAM and non-LAM cells. The threshold distinguishing high and low LAMcore in LAM cells (n = 48 and n = 85, respectively) is indicated. D, Scatter plots showing the LAMp-LAMcore correlation in LAM cells with defined low (left panel) or high (right panel) LAMcore, using the threshold depicted in panel C. E, Density plot showing the distribution LAMp scores in LAM and non-LAM cells. F, Histogram depicting Gene Set Expression Analysis (GSEA) C2-curated gene sets positively (red) or negatively (green) correlated (FDR < 5%) with LAMcore (excluding LAMp) in LAM cells. The X-axis depicts the normalized enrichment score (NES) of the GSEA. The complete lists of correlated gene sets are provided in Supplementary Table S2C (positive correlations) and 2D (negative correlations). G, Histogram depicting GSEA C2-curated gene sets positively correlated (FDR < 5%) with the LAMcore score, but not the LAMp score, in LAM cells. The gene sets reported in the Results are indicated by dashed rectangles; TNF-target gene sets are denoted in blue. H, Histogram depicting GSEA C2-curated gene sets positively correlated (FDR5 < 5%) with the LAMp score, but not the LAMcore score, in LAM cells. The gene sets reported in the Results are indicated by dashed rectangles. I, Top panels, LUM cytoplasmic expression in spindle-like cells in LAM lung. The arrows indicate the areas magnified in the insets. Bottom panels, YB1 nuclear expression in LAM epithelioid and spindle-like cells. LAM patients n = 7. The positive controls for the assays are shown in Supplementary Figure S2. J, Violin plots showing higher levels of expression of hormone-related signatures (ER-positively regulated genes (43) and progesterone-induced genes in ER-positive breast cancer (44)) in LAM cells with high LAMcore scores. Significance is indicated by Mann–Whitney test P values.
Figure 2.
Figure 2.. LAM signatures commonly show higher levels of expression in normal-adjacent tissue relative to primary-tumor tissue, with exceptions linked to stromal content and/or mesenchymal features.
Whisker plots showing signature scores (LAMcore, top panel; and LAMp, bottom panel) in normal-adjacent tissue and primary tumors of 15 solid cancer types analyzed in TCGA (study acronyms are depicted). Score differences between normal and tumor tissue in each setting were assessed with the Mann–Whitney test. The dashed rectangles in the LAMcore panel indicate cancer types with no differences between normal and tumor tissue (GBM, HNSC, and PAAD); levels of expression were significantly higher in normal tissue than in all the other cancer types. The dashed rectangles in the LAMp analysis indicate cancer types with higher levels of expression in tumors relative to normal tissue (GBM, HNSC, and STAD) or with no difference between the two (PAAD).
Figure 3.
Figure 3.. Cancer cell lines similar to LAM cells.
A, UMAP projection of LAM and cancer cell scRNA-seq data: global view, left panel; and zoom-in to LAM cells (plus lung mesenchymal cells, as originally annotated (6)) and closely positioned cancer cell lines, top right panel. The tissue of origin of the cancer cell lines is depicted in the inset. B, UMAP zoom-in projection indicating the six cancer cell lines (inset) positioned close to LAM cells.
Figure 4.
Figure 4.. Expression of RUNX1 and IRF1 transcription factor in LAM lung lesions.
Top panels, positive RUNX1 expression in LAM epithelioid cells (left panel a) and weaker expression in LAM spindle cells (left panel b). The arrows indicate the areas magnified in the insets. Right panel, positive RUNX1 expression in a LAM lung nodule. The alveolar epithelium also appears positive. Bottom panels, positive IRF1 expression in LAM spindle cells (right panel). The arrow indicates the area magnified in the inset. Left panel, positive IRF1 expression in a LAM lung nodule. The alveolar epithelium also appears positive. LAM patients n = 7. The positive controls for the assays are shown in Supplementary Figure S2.
Figure 5.
Figure 5.. Molecular features of LAM tissue heterogeneity and identification of a subgroup.
A, Overrepresented GO and KEGG annotations in the gene decile with most variable expression among 14 LAM lung nodules (GEO GSE12027); complete results are presented in Supplementary Table S2J. B, Unsupervised hierarchical clustering of LAM lung nodules based on the nine principal components derived from the variable genes (accounting for 76% of the variation). The numbers in red and green show the approximately unbiased (AU) P value (x100) and the bootstrap probability (BP x100) of the Pvclust algorithm. The immune-related cluster considered significant is marked by a red rectangle. GEO samples are detailed (GSM numbers). The bottom panel shows the expression of the signature of “Bilanges rapamycin sensitive via TSC1/2” gene set, which is significantly underexpressed (Mann–Whitney test P = 0.01) in the depicted LAM subgroup. C, Expression profiles of genes differentially expressed (FDR < 5%) between the two LAM subgroups (panel B). LCN2 is identified by an arrow.
Figure 6.
Figure 6.. LCN2 as a LAM tissue and plasma marker.
A, Detection of LCN2 expression in LAM lung lesions. Variation of expression is appreciable between the top and bottom lung tissue lesions. The arrows indicate the areas magnified in the insets. LAM patients n = 7. B, LCN2 plasma levels are significantly higher in LAM patients than in healthy women. The asterisk indicates statistical significance using a two-tailed Mann–Whitney test (*P < 0.05). LCN2 plasma levels are not significantly (n.s.) different in LAM patients relative to patients with related pulmonary diseases. The horizontal red lines indicate average values. C, LCN2 plasma levels are higher in LAM patients not treated with rapamycin, relative to healthy women. The asterisks indicate statistical significance using a two-tailed Mann–Whitney test (*P < 0.01). D, LCN2 plasma levels are higher in LAM patients with high VEGF-D levels (> 800 pg/ml), relative to healthy women. The asterisk indicates statistical significance using a two-tailed Mann–Whitney test (*P < 0.05).

References

    1. Johnson SR, Cordier JF, Lazor R, Cottin V, Costabel U, Harari S, et al. European Respiratory Society guidelines for the diagnosis and management of lymphangioleiomyomatosis. Eur Respir J 2010;35:14–26. - PubMed
    1. McCormack FX, Gupta N, Finlay GR, Young LR, Taveira-DaSilva AM, Glasgow CG, et al. Official American Thoracic Society/Japanese Respiratory Society Clinical Practice guidelines: Lymphangioleiomyomatosis diagnosis and management. Am J Respir Crit Care Med 2016;194:748–61. - PMC - PubMed
    1. Henske EP, McCormack FX. Lymphangioleiomyomatosis - A wolf in sheep’s clothing. J Clin Invest 2012;122:3807–16. - PMC - PubMed
    1. Krymskaya VP, McCormack FX. Lymphangioleiomyomatosis: A monogenic model of malignancy. Annu Rev Med 2017;68:69–83. - PMC - PubMed
    1. McCormack FX, Travis WD, Colby TV, Henske EP, Moss J. Lymphangioleiomyomatosis: calling it what it is: a low-grade, destructive, metastasizing neoplasm. Am J Respir Crit Care Med 2012;186:1210–2. - PMC - PubMed

Publication types

Substances