

Heterogeneous Expression of Nuclear Encoded Mitochondrial Genes Distinguishes Inhibitory and Excitatory Neurons
- PMID: 34312306
- PMCID: PMC8387155
- DOI: 10.1523/ENEURO.0232-21.2021
Heterogeneous Expression of Nuclear Encoded Mitochondrial Genes Distinguishes Inhibitory and Excitatory Neurons
Abstract
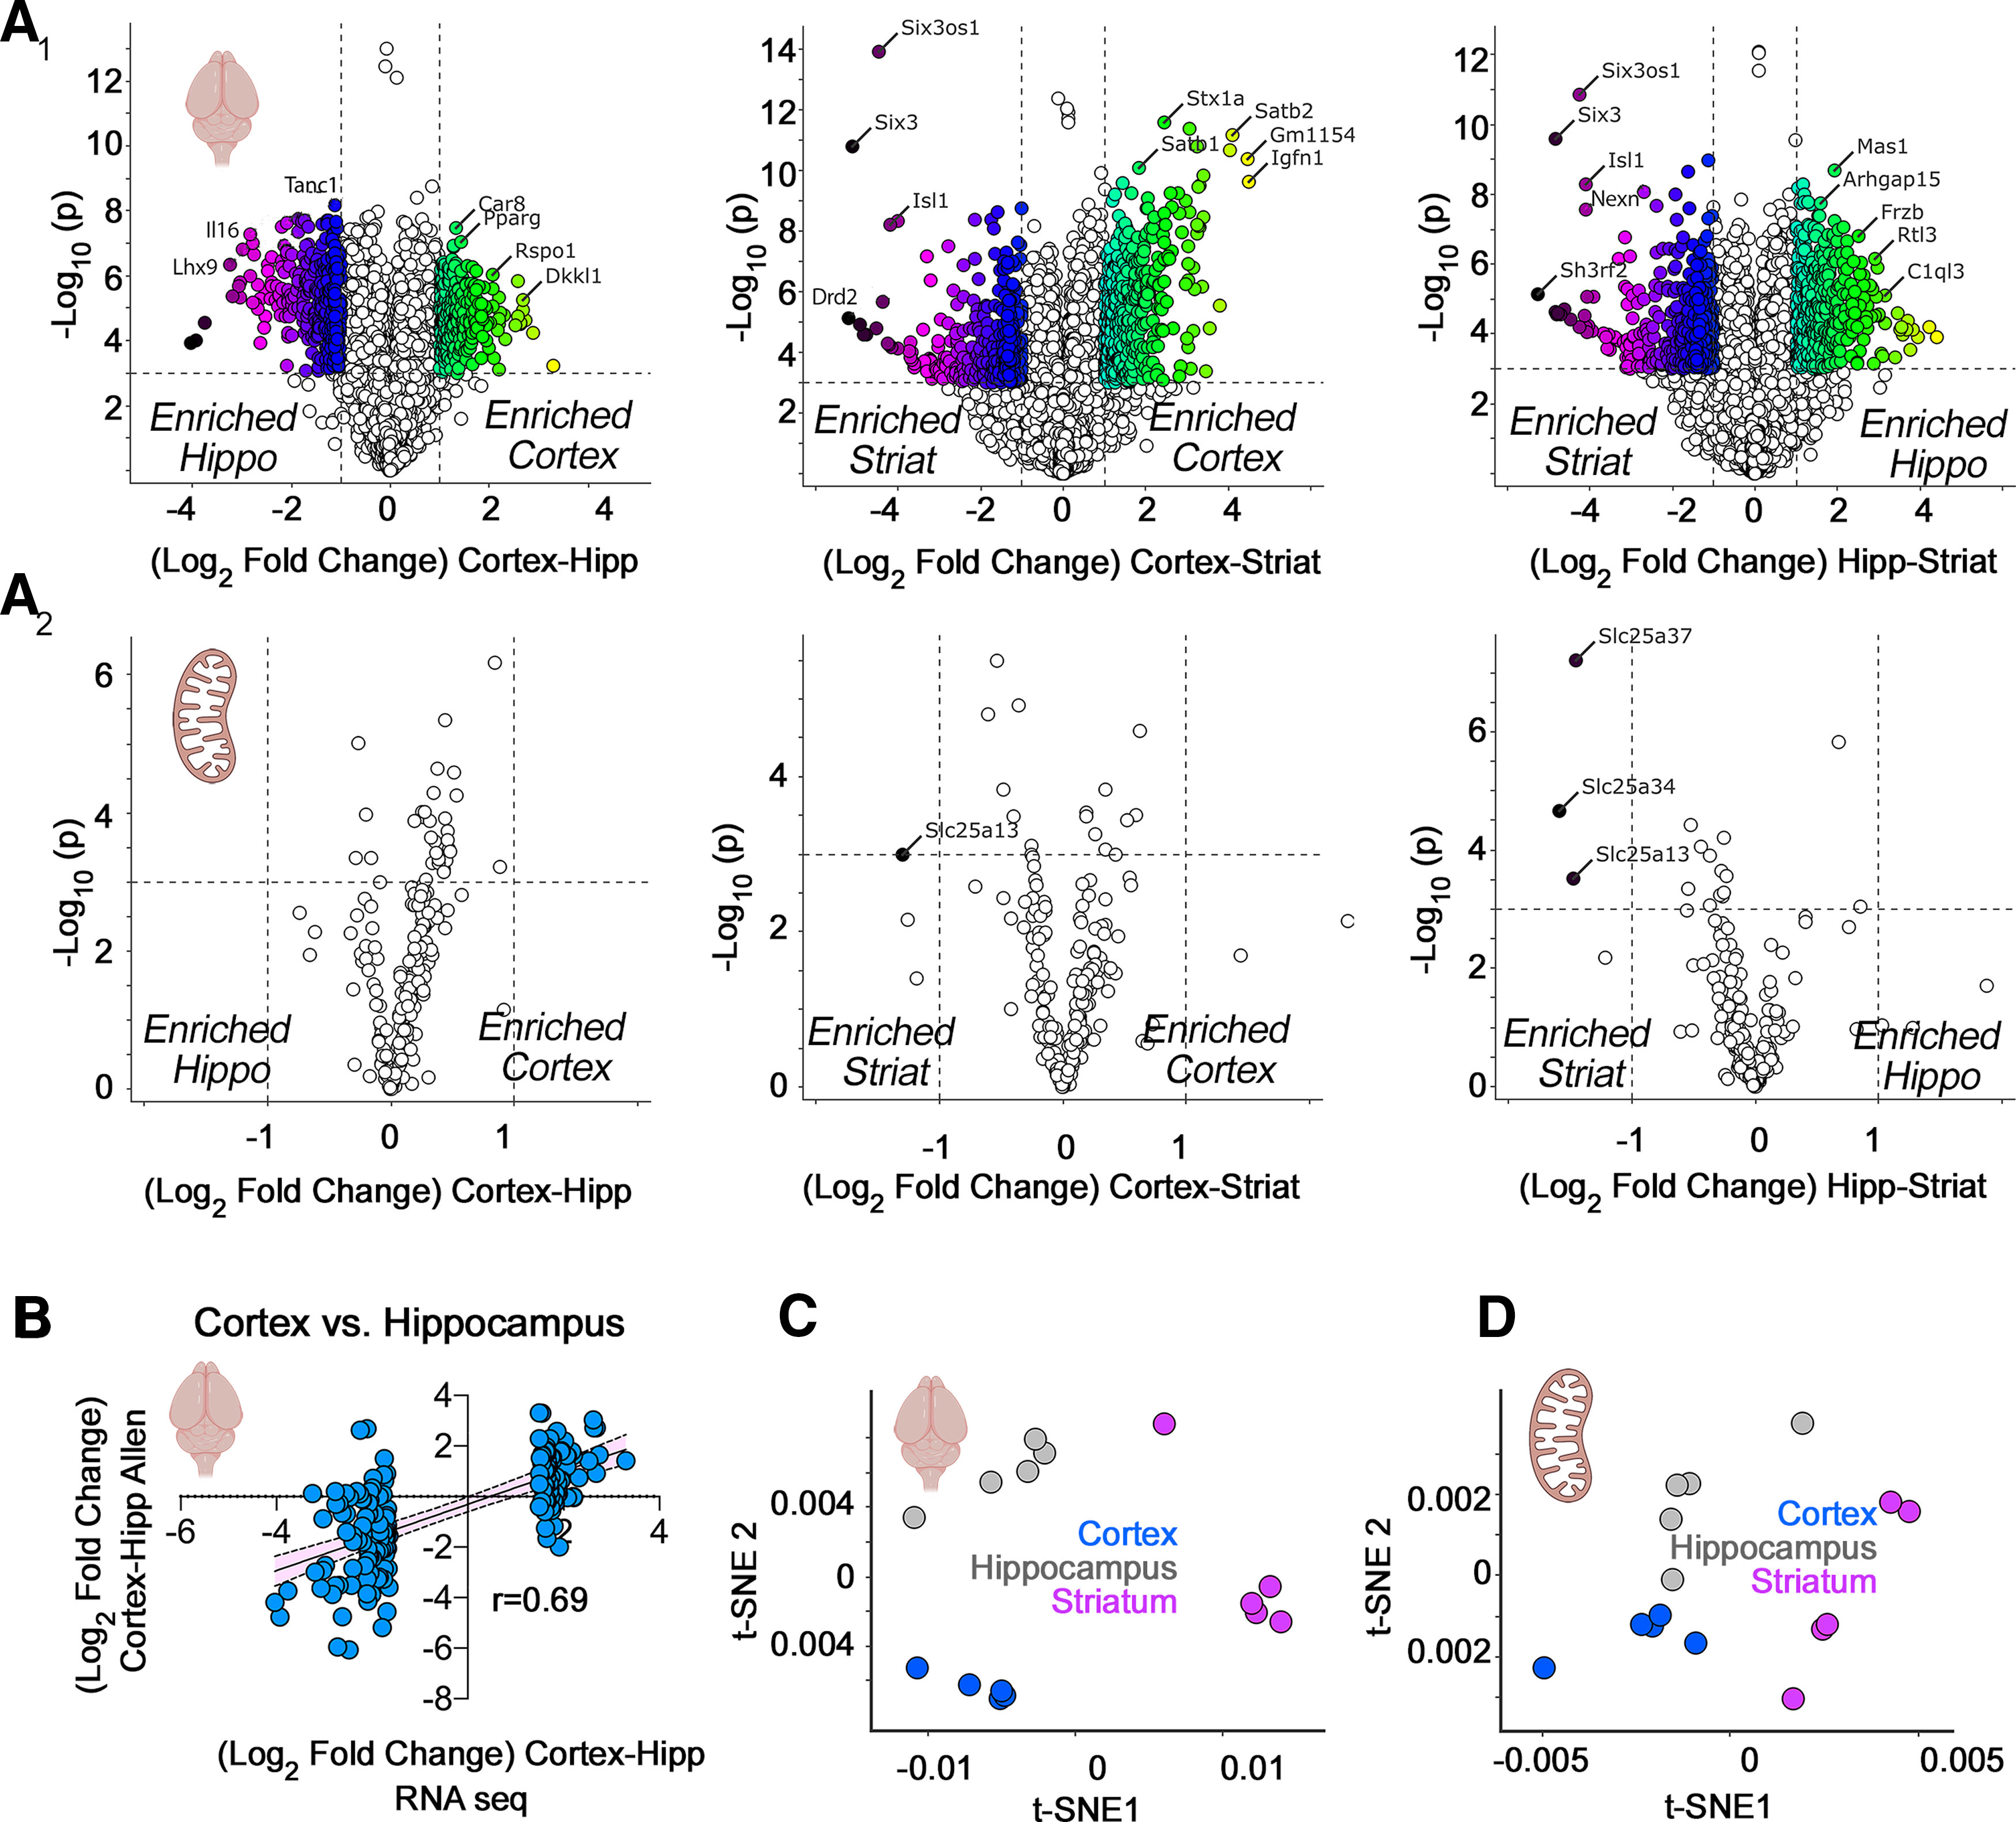
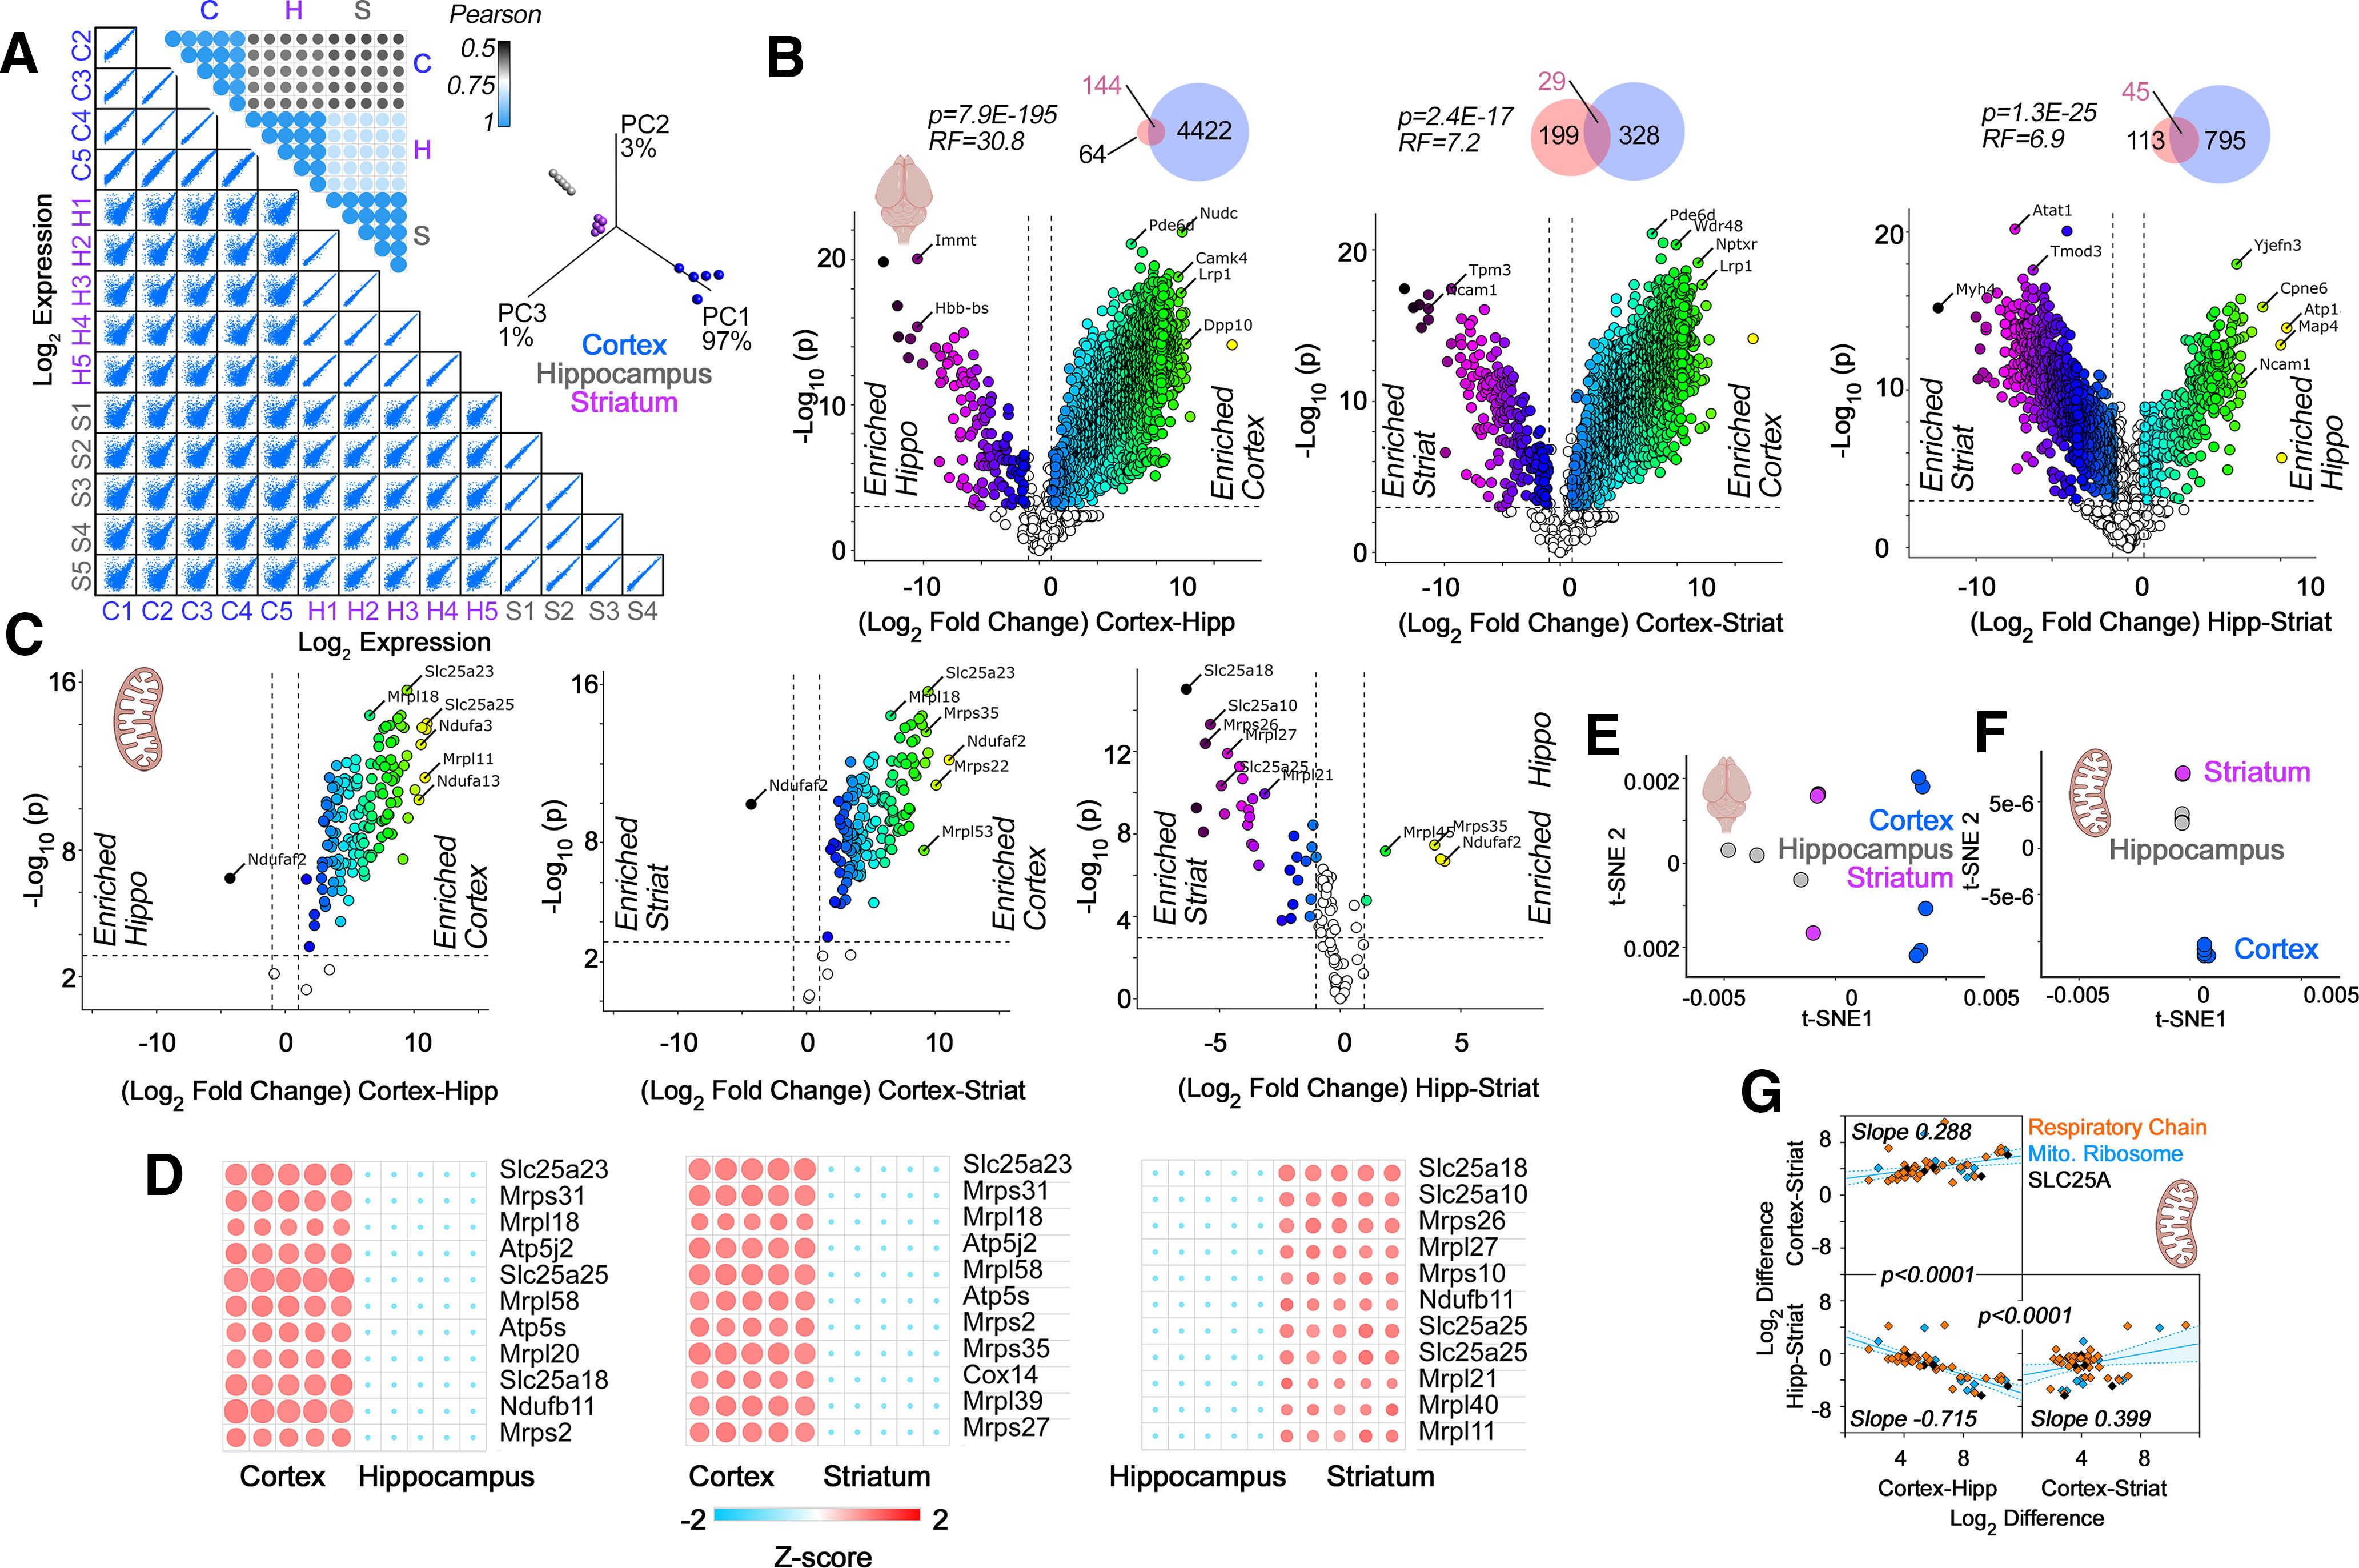
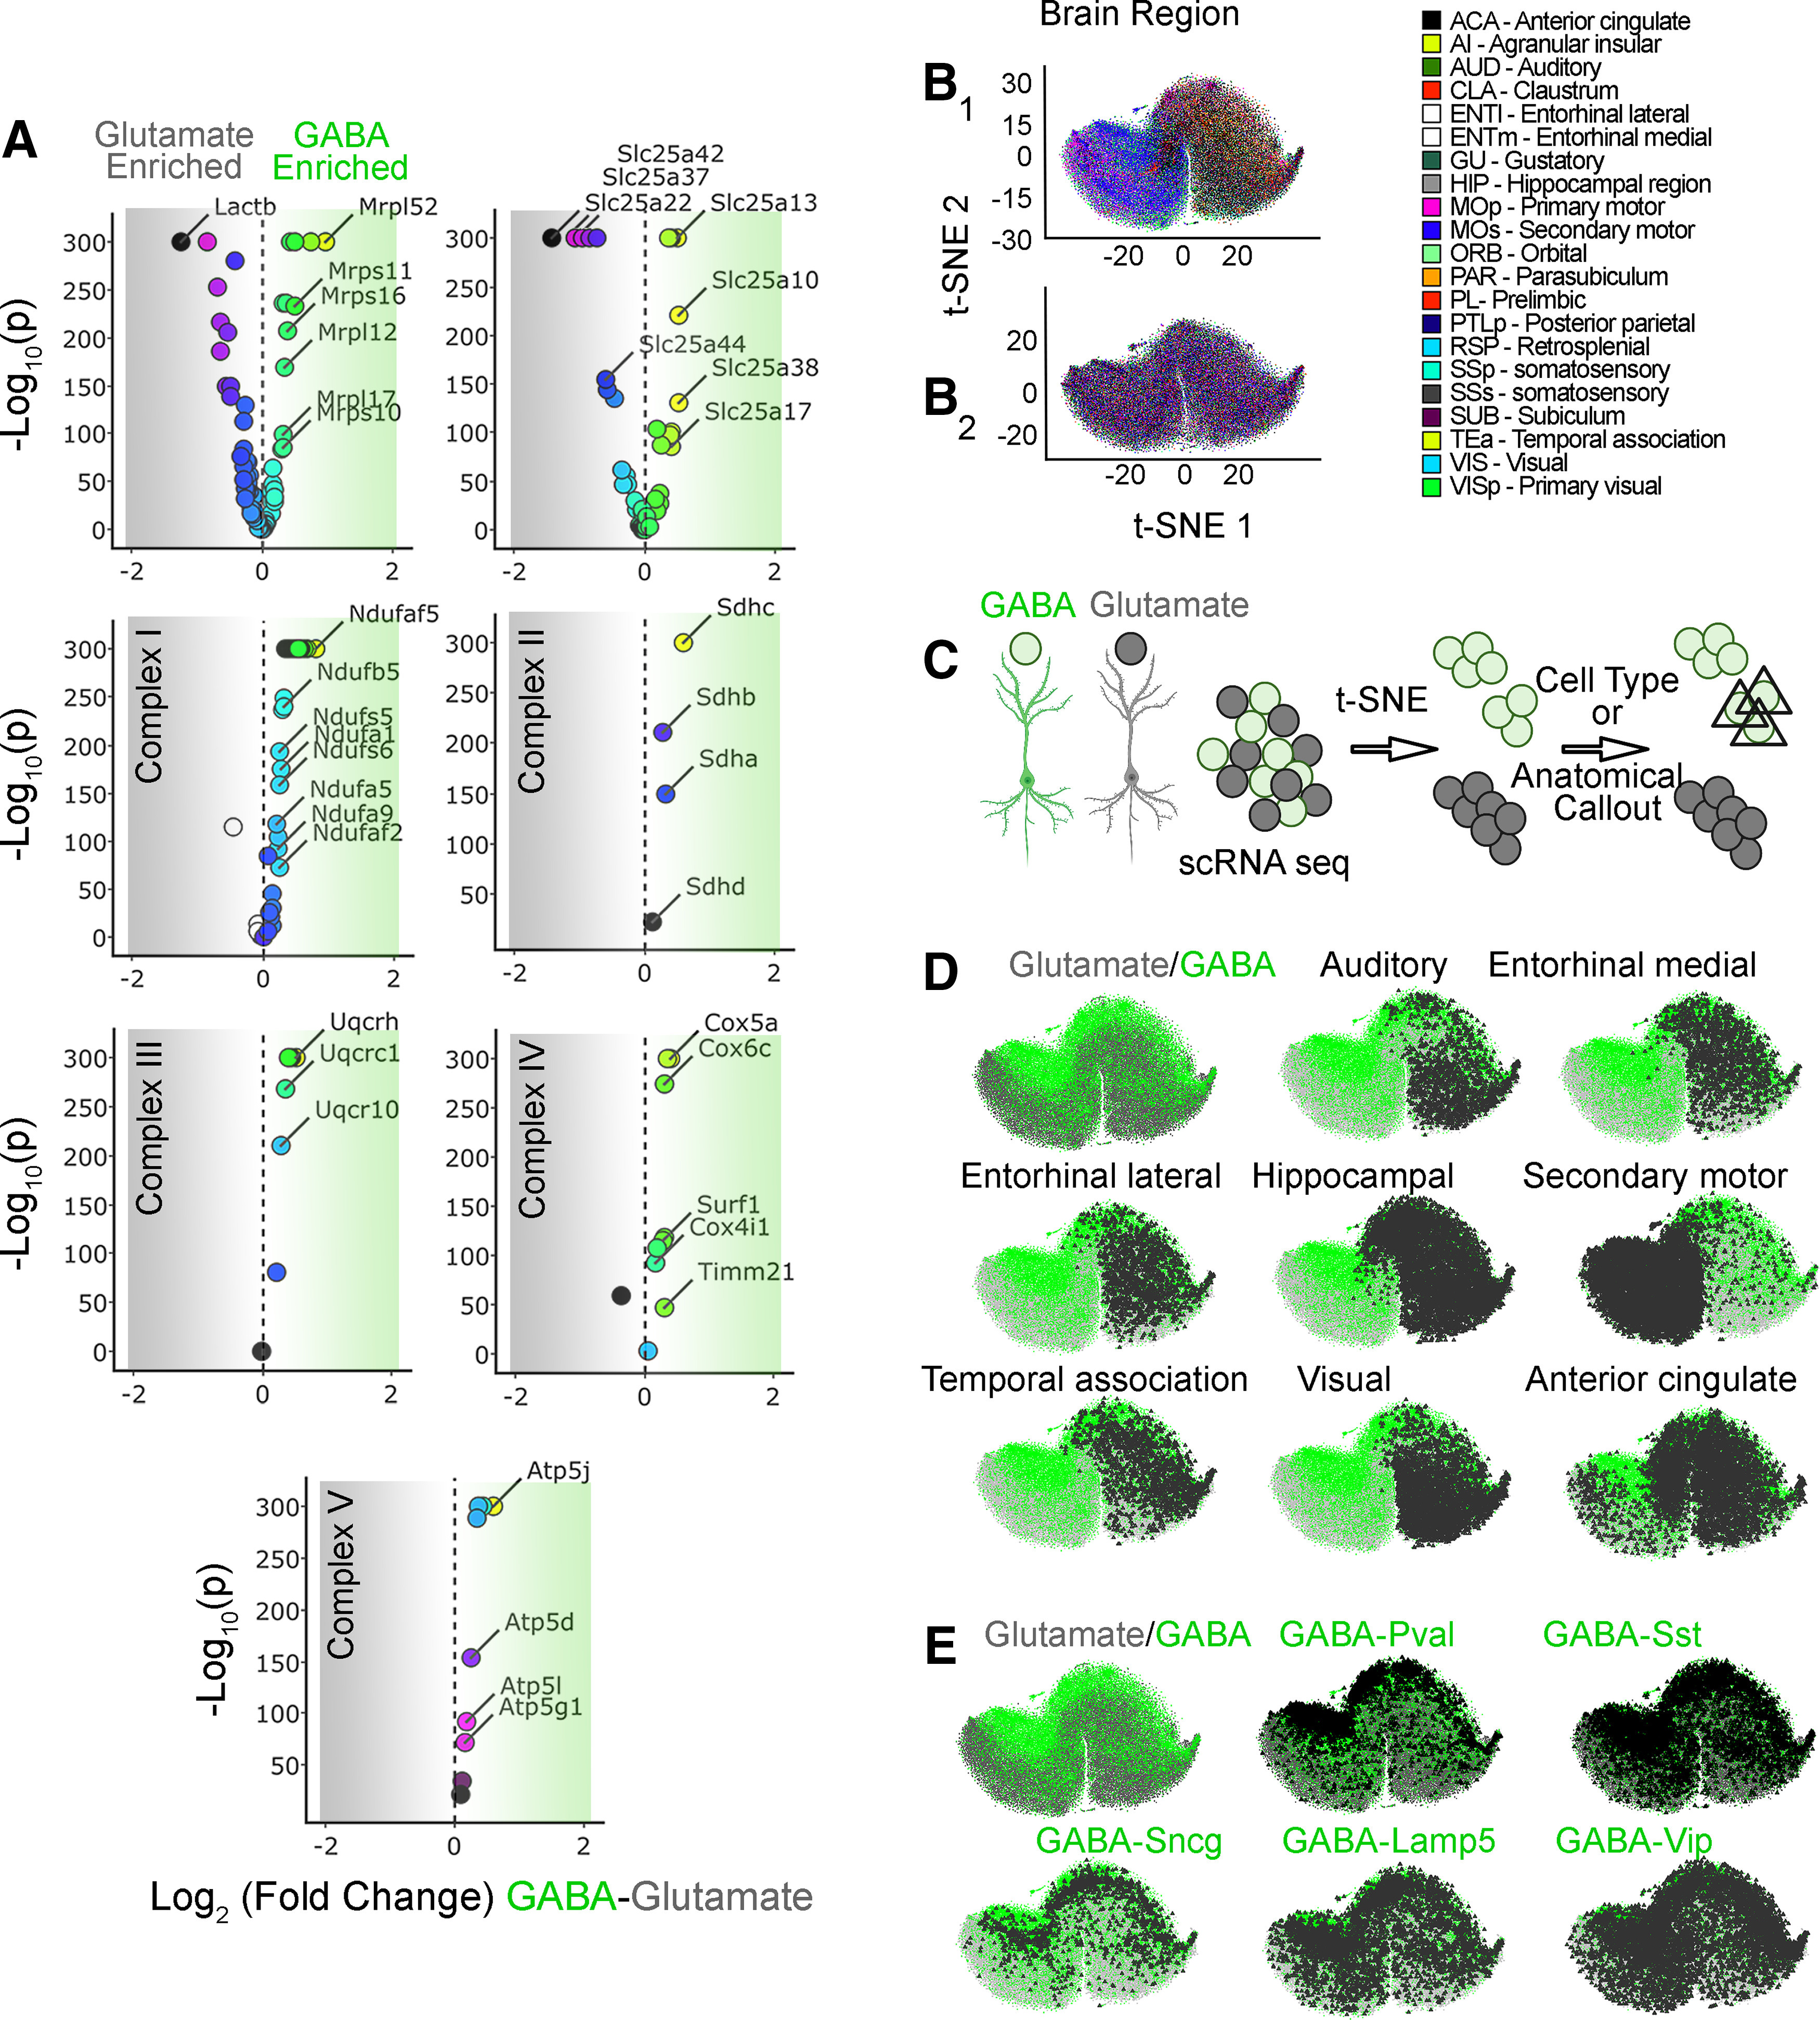
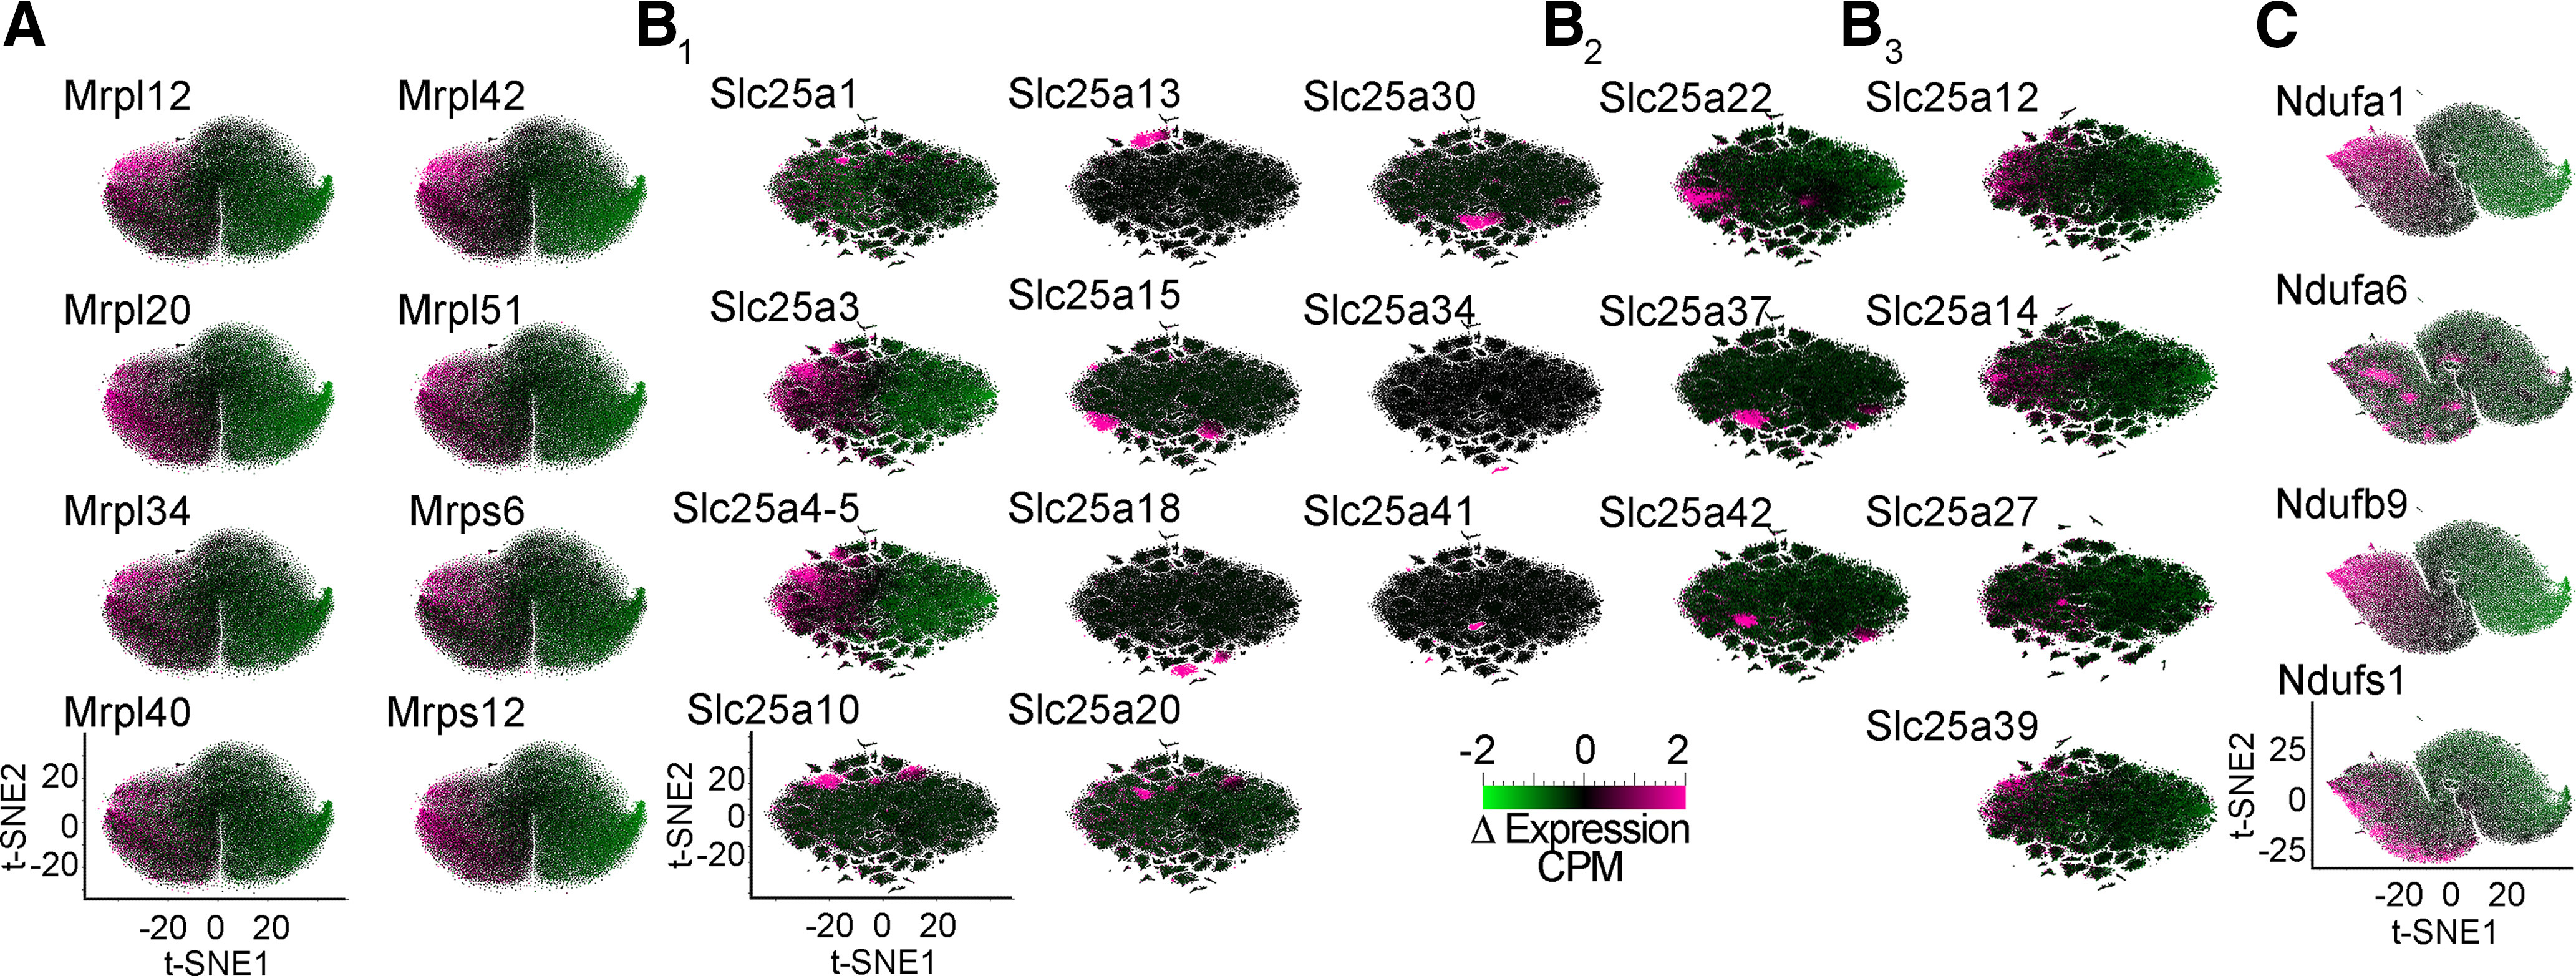
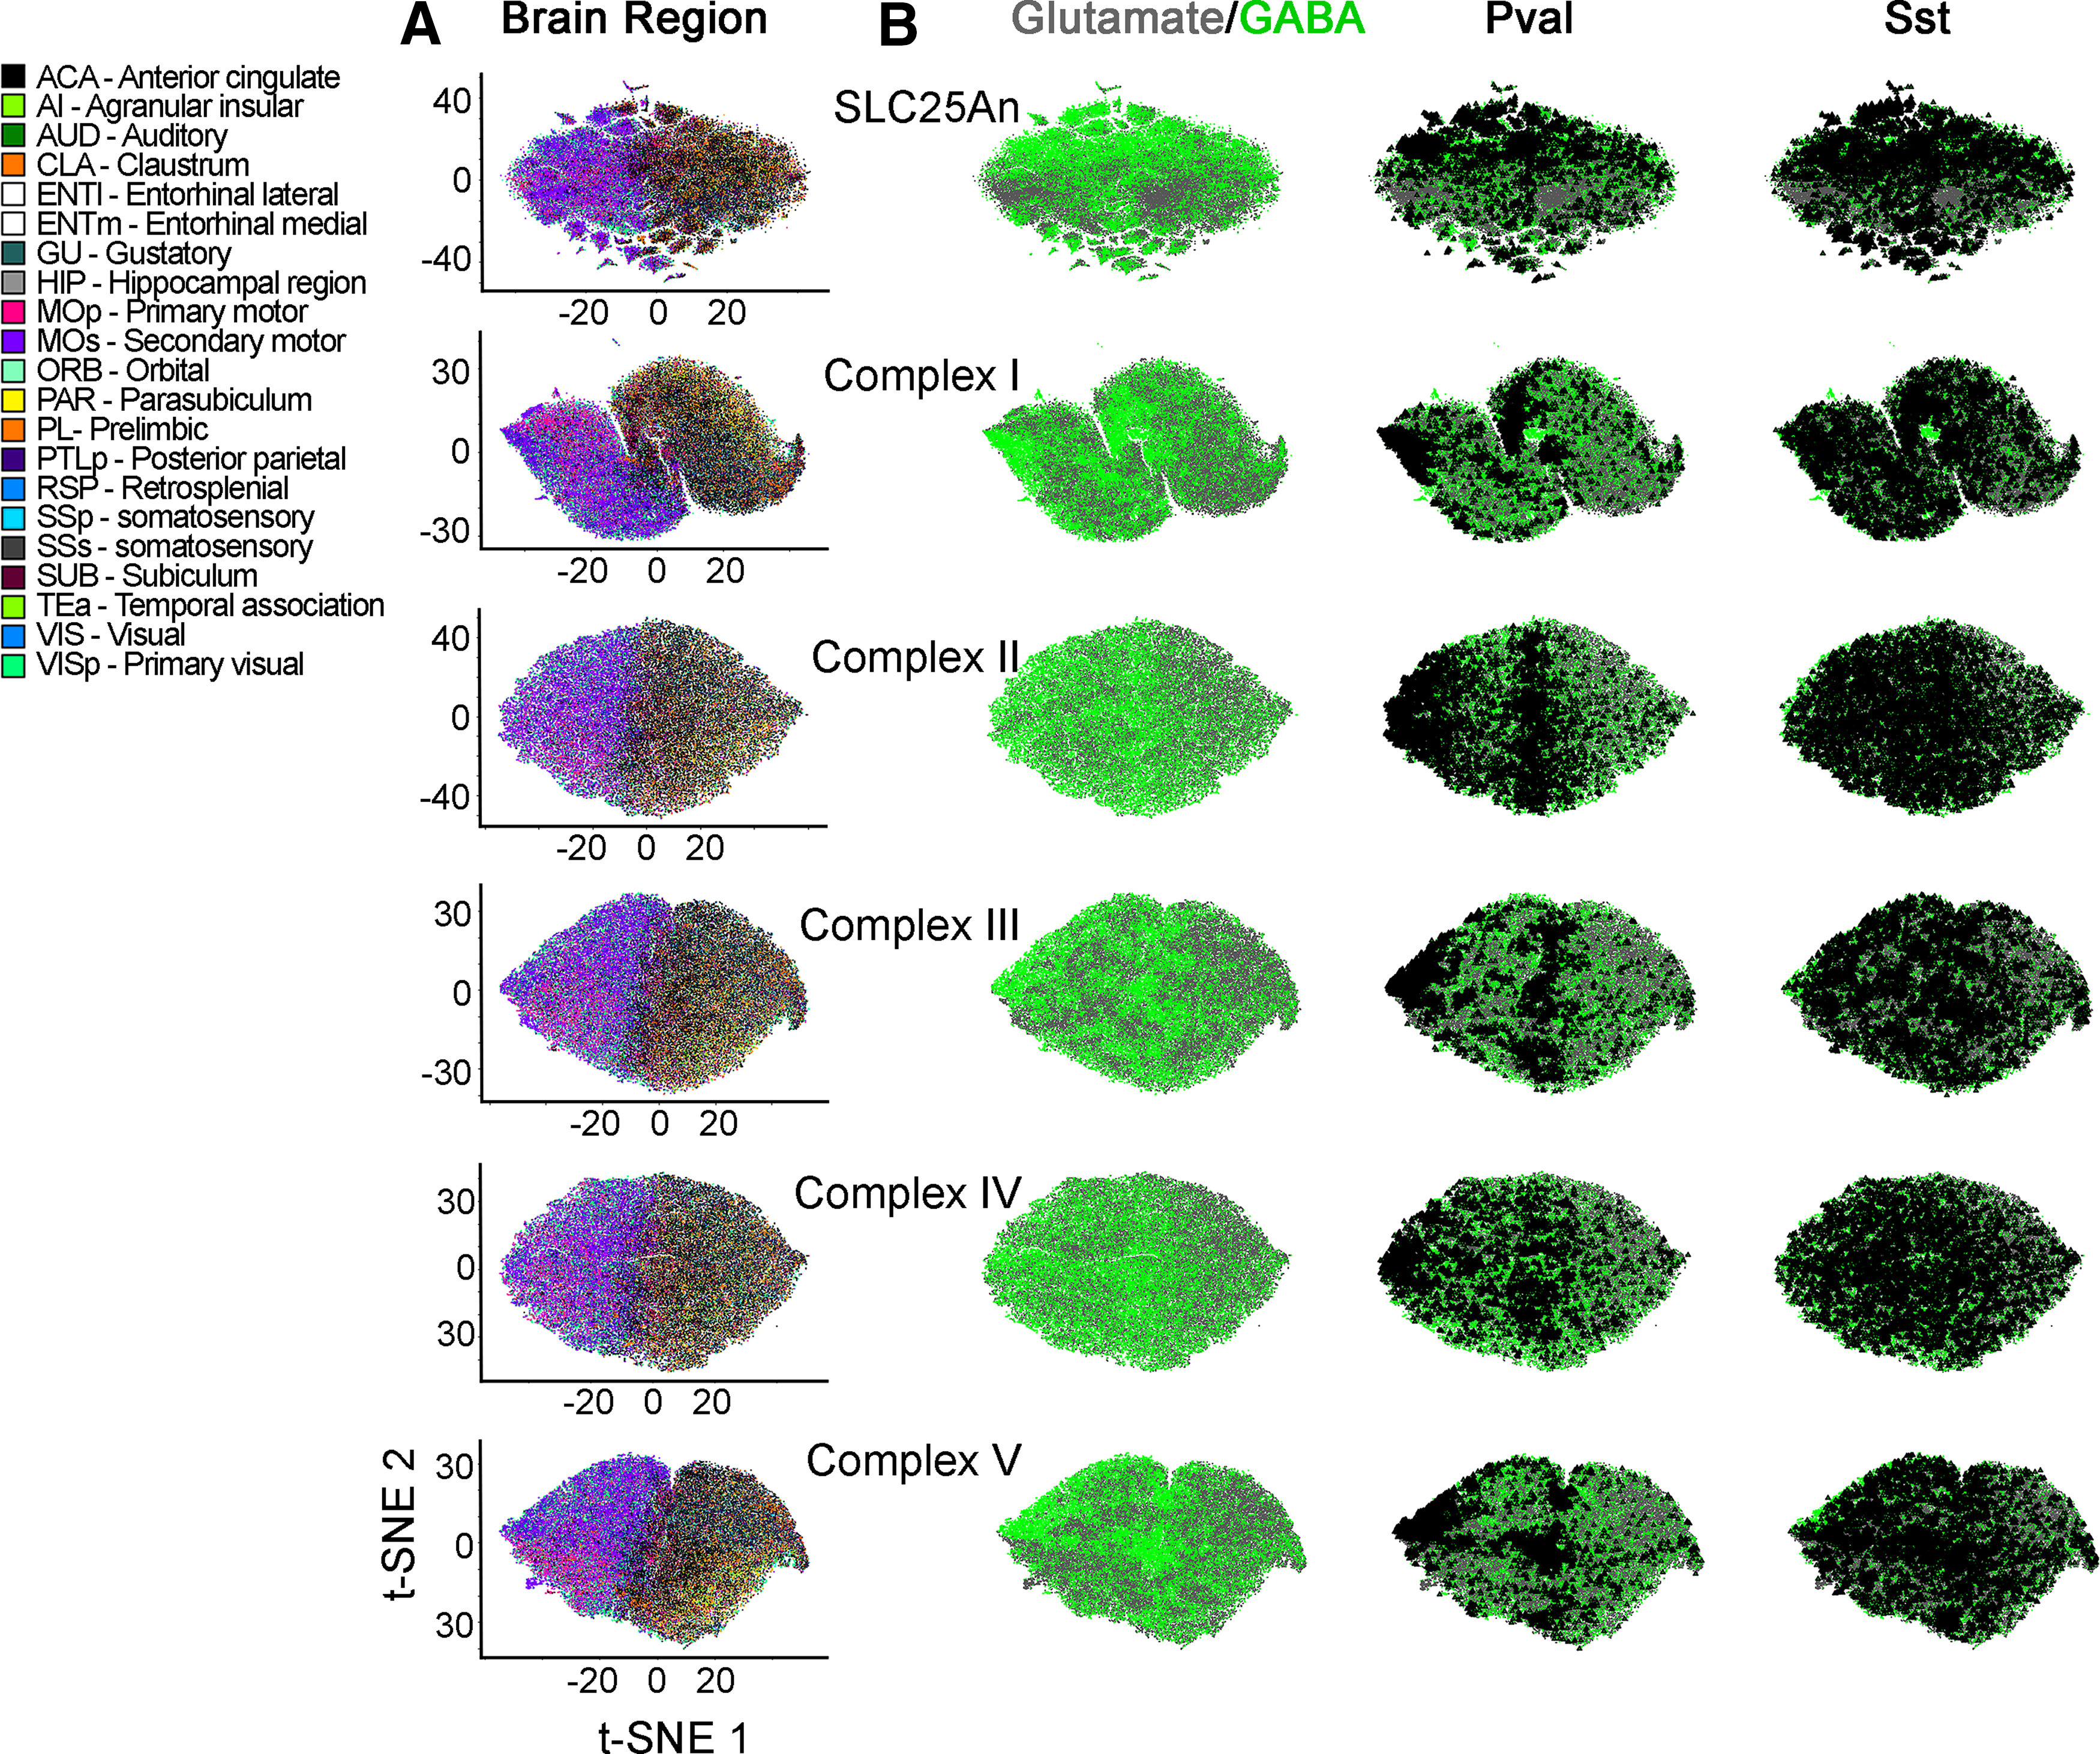
Mitochondrial composition varies by organ and their constituent cell types. This mitochondrial diversity likely determines variations in mitochondrial function. However, the heterogeneity of mitochondria in the brain remains underexplored despite the large diversity of cell types in neuronal tissue. Here, we used molecular systems biology tools to address whether mitochondrial composition varies by brain region and neuronal cell type in mice. We reasoned that proteomics and transcriptomics of microdissected brain regions combined with analysis of single-cell mRNA sequencing (scRNAseq) could reveal the extent of mitochondrial compositional diversity. We selected nuclear encoded gene products forming complexes of fixed stoichiometry, such as the respiratory chain complexes and the mitochondrial ribosome, as well as molecules likely to perform their function as monomers, such as the family of SLC25 transporters. We found that the proteome encompassing these nuclear-encoded mitochondrial genes and obtained from microdissected brain tissue segregated the hippocampus, striatum, and cortex from each other. Nuclear-encoded mitochondrial transcripts could only segregate cell types and brain regions when the analysis was performed at the single-cell level. In fact, single-cell mitochondrial transcriptomes were able to distinguish glutamatergic and distinct types of GABAergic neurons from one another. Within these cell categories, unique SLC25A transporters were able to identify distinct cell subpopulations. Our results demonstrate heterogeneous mitochondrial composition across brain regions and cell types. We postulate that mitochondrial heterogeneity influences regional and cell type-specific mechanisms in health and disease.
Keywords: GABA; glutamate; mitochondria; mitochondrial ribosome; respiratory chain; solute transporter.
Copyright © 2021 Wynne et al.
Figures
Similar articles
-
Unveiling the tissue-specific landscape of nuclear-encoded mitochondrial genes involved in amino acid metabolism in buffalo.Amino Acids. 2025 Feb 28;57(1):17. doi: 10.1007/s00726-025-03447-4. Amino Acids. 2025. PMID: 40019559 Free PMC article.
-
DNA methylation status of nuclear-encoded mitochondrial genes underlies the tissue-dependent mitochondrial functions.BMC Genomics. 2010 Aug 19;11:481. doi: 10.1186/1471-2164-11-481. BMC Genomics. 2010. PMID: 20723256 Free PMC article.
-
Nuclear genetic regulation of the human mitochondrial transcriptome.Elife. 2019 Feb 18;8:e41927. doi: 10.7554/eLife.41927. Elife. 2019. PMID: 30775970 Free PMC article.
-
Mitochondrial SLC25 Carriers: Novel Targets for Cancer Therapy.Molecules. 2020 May 22;25(10):2417. doi: 10.3390/molecules25102417. Molecules. 2020. PMID: 32455902 Free PMC article. Review.
-
Nature and cause of mitochondrial dysfunction in Huntington's disease: focusing on huntingtin and the striatum.J Neurochem. 2010 Jul;114(1):1-12. doi: 10.1111/j.1471-4159.2010.06741.x. Epub 2010 Apr 9. J Neurochem. 2010. PMID: 20403078 Review.
Cited by
-
Characterization of β-Hydroxybutyrate as a Cell Autonomous Fuel for Active Excitatory and Inhibitory Neurons: β-Hydroxybutyrate as a Fuel for Active Neurons.bioRxiv [Preprint]. 2024 Jun 9:2024.06.08.598077. doi: 10.1101/2024.06.08.598077. bioRxiv. 2024. PMID: 38895313 Free PMC article. Preprint.
-
Adaptive protein synthesis in genetic models of copper deficiency and childhood neurodegeneration.Mol Biol Cell. 2025 Mar 1;36(3):ar33. doi: 10.1091/mbc.E24-11-0512. Epub 2025 Jan 29. Mol Biol Cell. 2025. PMID: 39878654 Free PMC article.
-
Mitochondrial protein synthesis and the bioenergetic cost of neurodevelopment.iScience. 2022 Aug 13;25(9):104920. doi: 10.1016/j.isci.2022.104920. eCollection 2022 Sep 16. iScience. 2022. PMID: 36060058 Free PMC article. Review.
-
Hippocampal transcriptome-wide association study and pathway analysis of mitochondrial solute carriers in Alzheimer's disease.Transl Psychiatry. 2024 Jun 10;14(1):250. doi: 10.1038/s41398-024-02958-0. Transl Psychiatry. 2024. PMID: 38858380 Free PMC article.
-
A Comprehensive Prognostic Model for Colon Adenocarcinoma Depending on Nuclear-Mitochondrial-Related Genes.Technol Cancer Res Treat. 2024 Jan-Dec;23:15330338241258570. doi: 10.1177/15330338241258570. Technol Cancer Res Treat. 2024. PMID: 38832431 Free PMC article.
References
-
- Afgan E, Baker D, Batut B, van den Beek M, Bouvier D, Cech M, Chilton J, Clements D, Coraor N, Grüning BA, Guerler A, Hillman-Jackson J, Hiltemann S, Jalili V, Rasche H, Soranzo N, Goecks J, Taylor J, Nekrutenko A, Blankenberg D (2018) The Galaxy platform for accessible, reproducible and collaborative biomedical analyses: 2018 update. Nucleic Acids Res 46:W537–W544. 10.1093/nar/gky379 - DOI - PMC - PubMed
-
- Andrews S (2010) FastQC: a quality control tool for high throughput sequence data. Available at http://www.bioinformatics.babraham.ac.uk/projects/fastqc/.
-
- Anitha A, Nakamura K, Thanseem I, Yamada K, Iwayama Y, Toyota T, Matsuzaki H, Miyachi T, Yamada S, Tsujii M, Tsuchiya KJ, Matsumoto K, Iwata Y, Suzuki K, Ichikawa H, Sugiyama T, Yoshikawa T, Mori N (2012) Brain region-specific altered expression and association of mitochondria-related genes in autism. Mol Autism 3:12. 10.1186/2040-2392-3-12 - DOI - PMC - PubMed
Publication types
MeSH terms
Grants and funding
LinkOut - more resources
Full Text Sources
Molecular Biology Databases