. 2021 Jul 26;11(1):15149.
doi: 10.1038/s41598-021-94474-0.

Proteomics reveals disturbances in the immune response and energy metabolism of monocytes from patients with septic shock

Affiliations

Proteomics reveals disturbances in the immune response and energy metabolism of monocytes from patients with septic shock

Pedro Mendes de Azambuja Rodrigues et al. Sci Rep. .

Abstract

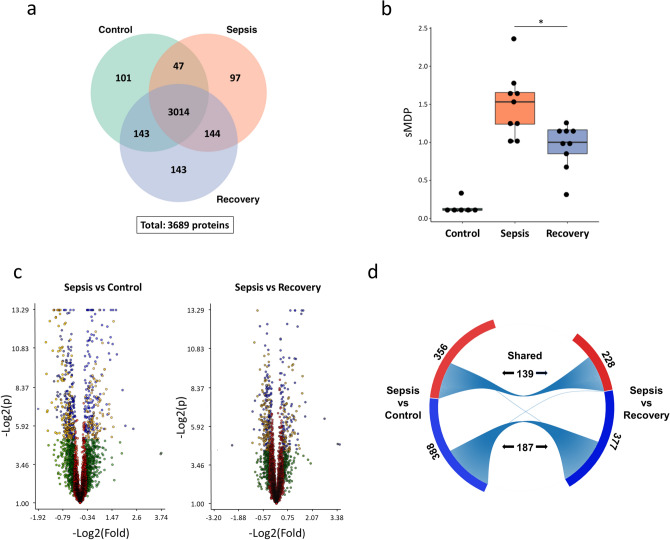
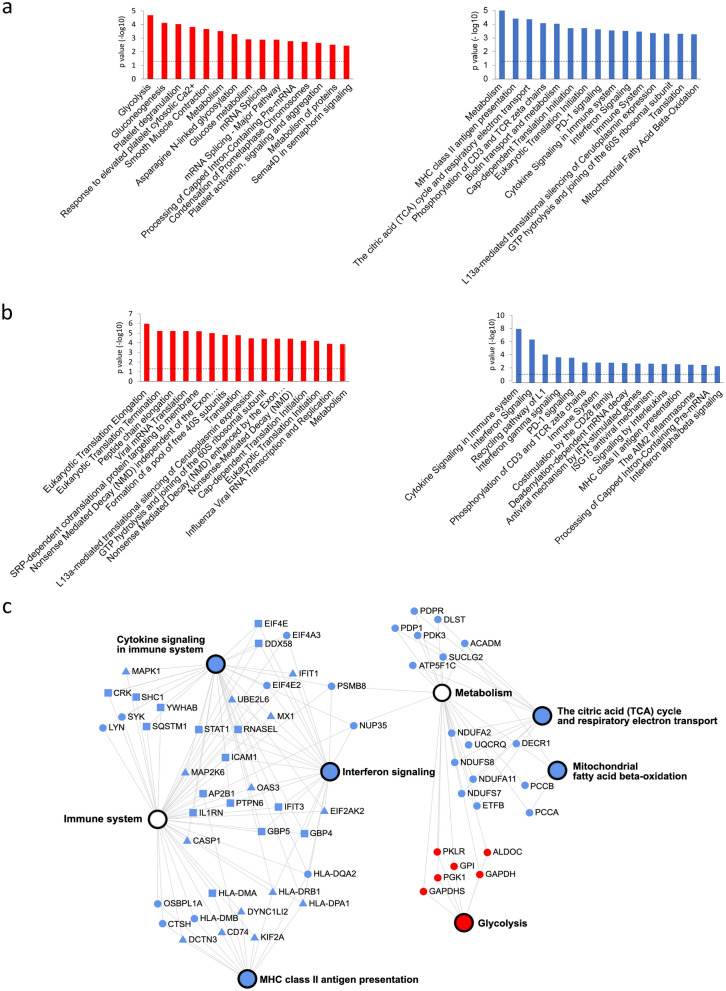
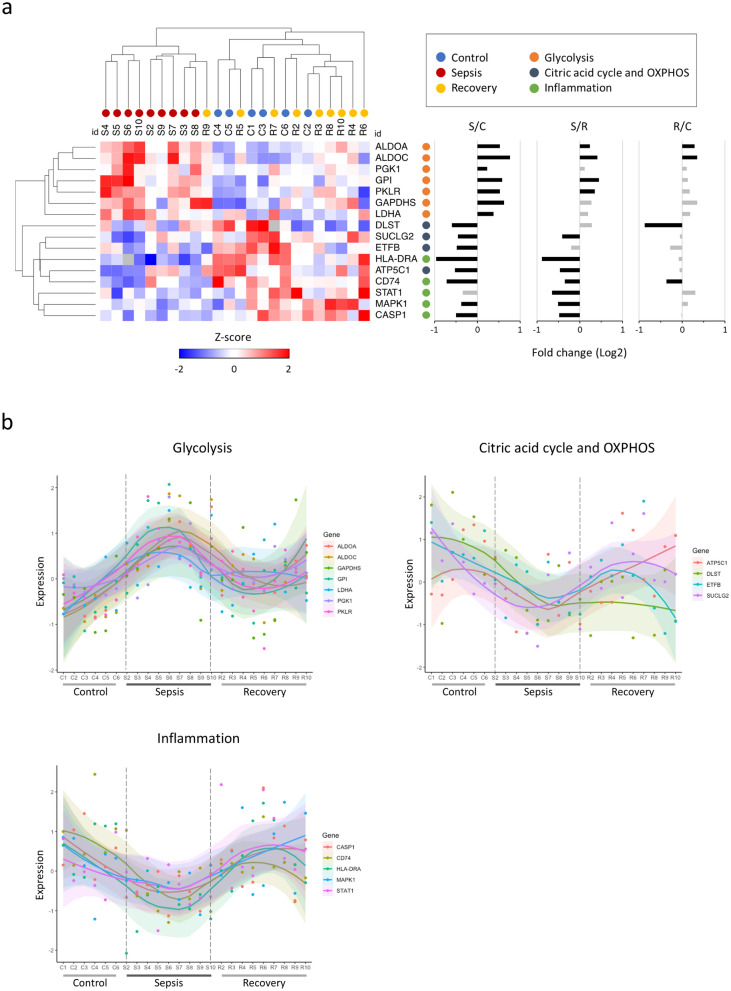
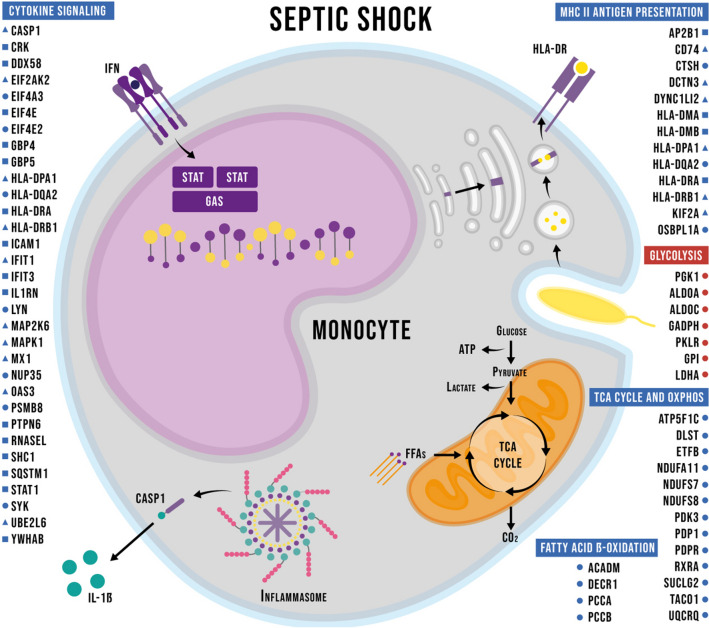
Sepsis results from a dyshomeostatic response to infection, which may lead to hyper or hypoimmune states. Monocytes are central regulators of the inflammatory response, but our understanding of their role in the genesis and resolution of sepsis is still limited. Here, we report a comprehensive exploration of monocyte molecular responses in a cohort of patients with septic shock via proteomic profiling. The acute stage of septic shock was associated with an impaired inflammatory phenotype, indicated by the down-regulation of MHC class II molecules and proinflammatory cytokine pathways. Simultaneously, there was an up-regulation of glycolysis enzymes and a decrease in proteins related to the citric acid cycle and oxidative phosphorylation. On the other hand, the restoration of immunocompetence was the hallmark of recovering patients, in which an upregulation of interferon signaling pathways was a notable feature. Our results provide insights into the immunopathology of sepsis and propose that, pending future studies, immunometabolism pathway components could serve as therapeutic targets in septic patients.


Conflict of interest statement

The authors declare no competing interests.

Figures

Figure 1
Figure 1
Alterations in the proteome of monocytes in the acute phase of sepsis (Sepsis group), compared with the recovery phase (Recovery group) and healthy subjects (Control group). (a) Total, unique, and shared protein identifications among the experimental groups. (b) Molecular degree of perturbation of the Sepsis end Recovery groups in relation to the Control group. The plot represents individual values with median and IQR per group. (c) Volcano plot of all shared proteins in the comparisons between the Sepsis and Control and Sepsis and Recovery groups. Each dot represents a protein mapped according to its log2 (fold change) on the y-axis and its − log2 (t-test p value) on the x-axis. The red dots indicate proteins that satisfy neither the fold-change cutoff nor the p value (0.05). Green dots depict protein entries that meet the fold-change cutoff but not the p value. Orange dots indicate proteins that satisfy both fold-change and p value but have low abundances, as determined by an additional stringency filter. Blue dots represent protein entries that met all statistical filters and were selected for further analysis. (d) Total and shared proteins significantly up (red bars) or down (blue bars)-regulated in the comparisons between the Sepsis and Control and Sepsis and Recovery groups.
Figure 2
Figure 2
Functional analysis of the sepsis monocyte proteome. Enriched Reactome pathways among the differentially expressed proteins in groups (a) Sepsis, compared to Control and; (b) Sepsis, compared to Recovery. The y-axis represents the − log10 of the p value for the association between the pathways and the set of proteins up (red bars) or down (blue bars)-regulated. Significance (dotted lines) was defined as p ≥ 0.05 (Benjamini and Hochberg); (c) A network of pathways selected from (a,b). Nodes represent proteins up (red) or down (blue)-regulated in the comparisons between Sepsis and Control (circles), Sepsis end Recovery (squares), or both comparisons (triangles).
Figure 3
Figure 3
Immunometabolic profile of the experimental groups. (a) On the left, the columns (individuals) and rows (proteins) of the heatmap were clustered hierarchically by the Euclidean distance. The expression values were normalized by the z-score of each line. On the right, the fold changes of the protein abundance ratios (NSAF) between the control (C), Sepsis (S), and Recovery (R) groups are displayed. The gray bars represent statistically non-significant differences (TFold); (b) Expression (z-scores) of proteins separated by function. The samples were organized on the y axis by the identifier of individuals in the Control group (C1 to C6) followed by the Sepsis (S2 to S10) and Recovery (R2 to R10) groups. Each dot represents a protein with the corresponding smooth line (loess regression) showing each group's expression trends.
Figure 4
Figure 4
Graphical summary of the main findings regarding the immunometabolic phenotype. Proteins of selected enriched Reactome pathways are listed. Adjacent symbols indicate up (red) or down (blue)-regulation in the comparisons between Sepsis and Control (circles), Sepsis end Recovery (squares), or both comparisons (triangles).

References

    1. Fleischmann C, et al. Assessment of global incidence and mortality of hospital-treated sepsis. Current estimates and limitations. Am. J. Respir. Crit. Care Med. 2016;193:259–272. doi: 10.1164/rccm.201504-0781OC. - DOI - PubMed
    1. Singer M, et al. The third international consensus definitions for sepsis and septic shock (Sepsis-3) JAMA. 2016;315:801–810. doi: 10.1001/jama.2016.0287. - DOI - PMC - PubMed
    1. Bone RC. Sir Isaac Newton, sepsis, SIRS, and CARS. Crit. Care Med. 1996;24:1125–1128. doi: 10.1097/00003246-199607000-00010. - DOI - PubMed
    1. Xiao W, et al. A genomic storm in critically injured humans. J. Exp. Med. 2011;208:2581–2590. doi: 10.1084/jem.20111354. - DOI - PMC - PubMed
    1. Fink M. Cytopathic hypoxia in sepsis. Acta Anaesthesiol. Scand. Suppl. 1997;110:87–95. doi: 10.1111/j.1399-6576.1997.tb05514.x. - DOI - PubMed

Publication types

Substances