. 2021 Jul 26;11(1):15208.
doi: 10.1038/s41598-021-94747-8.

Faecal biomarkers in type 1 diabetes with and without diabetic nephropathy

Affiliations

Faecal biomarkers in type 1 diabetes with and without diabetic nephropathy

Signe Abitz Winther et al. Sci Rep. .

Abstract

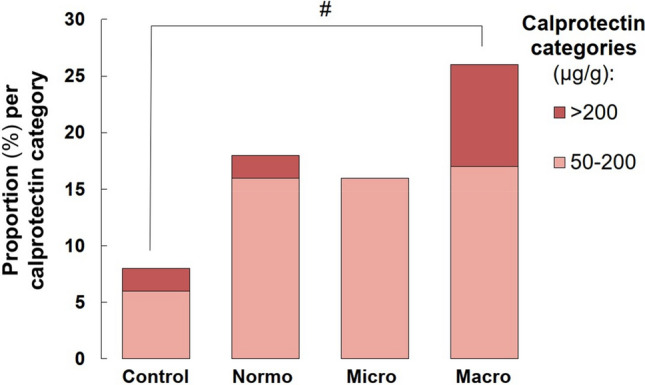
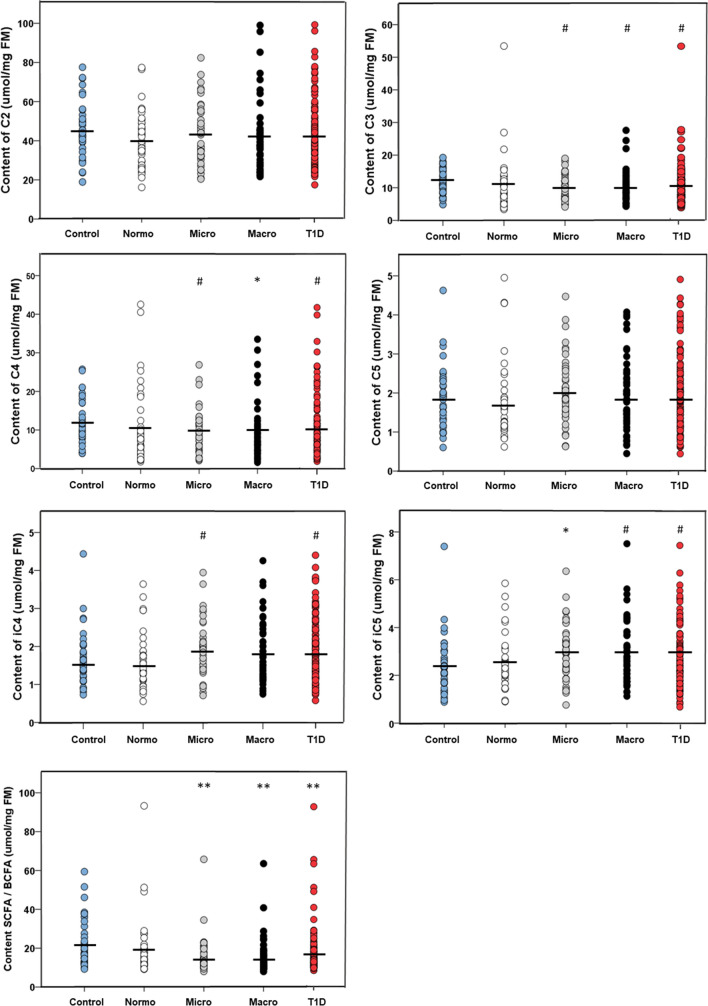
Gastrointestinal dysbiosis is common among persons with type 1 diabetes (T1D), but its potential impact on diabetic nephropathy (DN) remains obscure. We examined whether faecal biomarkers, previously associated with low-grade gastrointestinal inflammation, differ between healthy controls and T1D subjects with and without DN. Faecal samples were analyzed for levels of calprotectin, intestinal alkaline phosphatase (IAP), short-chain fatty acids (SCFA) and immunoglobulins in subjects with T1D (n = 159) and healthy controls (NDC; n = 50). The subjects with T1D were stratified based on albuminuria: normoalbuminuria (< 30 mg/g; n = 49), microalbuminuria (30-299 mg/g; n = 50) and macroalbuminuria (≥ 300 mg/g; n = 60). aecal calprotectin, IAP and immunoglobulin levels did not differ between the T1D albuminuria groups. However, when subjects were stratified based on faecal calprotectin cut-off level (50 µg/g), macroalbuminuric T1D subjects exceeded the threshold more frequently than NDC (p = 0.02). Concentrations of faecal propionate and butyrate were lower in T1D subjects compared with NDC (p = 0.04 and p = 0.03, respectively). Among T1D subjects, levels of branched SCFA (BCFA) correlated positively with current albuminuria level (isobutyrate, p = 0.03; isovalerate, p = 0.005). In our study cohort, fatty acid metabolism seemed to be altered among T1D subjects and those with albuminuria compared to NDC. This may reflect gastrointestinal imbalances associated with T1D and renal complications.


Conflict of interest statement

The authors declare no competing interests.

Figures

Figure 1
Figure 1
Faecal calprotectin measurements. The proportion of calprotectin positive individuals [expressing either moderate (> 50 μg/g) or high (> 200 μg/g) calprotectin levels] was higher in the macroalbuminuria group compared to controls. Control healthy nondiabetic controls, Normo T1D subjects with normal albuminuria, Micro T1D subjects with microalbuminuria, Macro T1D subjects with macroalbuminuria. #p < 0.05.
Figure 2
Figure 2
Faecal short chain fatty acids (SCFA). Acetate (C2), valerate (C5), isobutyrate (iC4) and isovalerate (iC5) levels did not differ between subjects with T1D and controls. Propionate (C3) and butyrate (C4) levels and the SCFA/BCFA -ratio were significantly lower among the subjects with diabetes compared to controls. SCFA (sum of C2, C3, C4 and C5), and branched SCFA (BCFA) (sum of iC4 and iC5). Only relevant significances between the controls (n = 40) and disease groups (Normo, n = 40; Micro, n = 42; Macro, n = 50; T1D, n = 132) are shown. #p < 0.05; *p < 0.01; **p < 0.001.
Figure 3
Figure 3
Branched short chain fatty acids (isobutyrate, iC4 and isovalerate, iC5) per urinary albumin to creatinine ratio (UACR). Both iC4 (A) and iC5 (B) correlated with UACR (iC4: R2 = 0.03, p = 0.02; iC5: R2 = 0.05, p = 0.004) in the unadjusted as well as in the adjusted model (iC4: R2 = 0.35, p = 0.03; iC5: R2 = 0.36, p = 0.005). The analyses were adjusted with age, sex, 24-h systolic blood pressure and estimated glomerular filtration rate. FM fecal mass. 95% CI around the regression line is shown in grey.

References

    1. Noce A, et al. Impact of gut microbiota composition on onset and progression of chronic non-communicable diseases. Nutrients. 2019;11:1073. doi: 10.3390/nu11051073. - DOI - PMC - PubMed
    1. Lee CJ, Sears CL, Maruthur N. Gut microbiome and its role in obesity and insulin resistance. Ann. N. Y. Acad. Sci. 2019 doi: 10.1111/nyas.14107. - DOI - PubMed
    1. Tytgat HLP, Nobrega FL, van der Oost J, de Vos WM. Bowel biofilms: Tipping points between a healthy and compromised gut? Trends Microbiol. 2018 doi: 10.1016/j.tim.2018.08.009. - DOI - PubMed
    1. Carding S, Verbeke K, Vipond DT, Corfe BM, Owen LJ. Dysbiosis of the gut microbiota in disease. Microb. Ecol. Health Dis. 2015;26:26191. - PMC - PubMed
    1. Rogers GB, et al. From gut dysbiosis to altered brain function and mental illness: Mechanisms and pathways. Mol. Psychiatry. 2016;21:738–748. doi: 10.1038/mp.2016.50. - DOI - PMC - PubMed

Publication types