. 2021 Aug;28(8):642-651.
doi: 10.1038/s41594-021-00626-1. Epub 2021 Jul 26.

DNA-loop-extruding SMC complexes can traverse one another in vivo

Affiliations

DNA-loop-extruding SMC complexes can traverse one another in vivo

Hugo B Brandão et al. Nat Struct Mol Biol. 2021 Aug.

Abstract

Chromosome organization mediated by structural maintenance of chromosomes (SMC) complexes is vital in many organisms. SMC complexes act as motors that extrude DNA loops, but it remains unclear what happens when multiple complexes encounter one another on the same DNA in living cells and how these interactions may help to organize an active genome. We therefore created a crash-course track system to study SMC complex encounters in vivo by engineering defined SMC loading sites in the Bacillus subtilis chromosome. Chromosome conformation capture (Hi-C) analyses of over 20 engineered strains show an amazing variety of chromosome folding patterns. Through three-dimensional polymer simulations and theory, we determine that these patterns require SMC complexes to bypass each other in vivo, as recently seen in an in vitro study. We posit that the bypassing activity enables SMC complexes to avoid traffic jams while spatially organizing the genome.


Conflict of interest statement

Competing interests

The authors declare no competing interests.

Figures

Extended Data Figure 1:
Exponential growth does not strongly affect the Hi-C contact patterns. (a) The B. subtilis genome is displayed in genomic coordinates (kilobases) and the angular coordinates used to designate the locations of the parS sites. (b) Hi-C maps for cells in exponential growth for the strains with parS sites at −94°, −59°, and both −94° and −59°. For details on strain names refer to Supplementary Table 1 and 2.
Extended Data Figure 2:
Extended Data Figure 2:. SMC complexes can slow each other down.
(a) Time-course (similar to Fig. 1d) comparing the extrusion rates away from (but not between) the S1 and S2 parS sites. The green dashed line tracks the leading edge of the hairpin trace as it emerges from the −94° parS (S1) site and moves towards the ter; the red dashed line tracks the leading edge of the hairpin trace as it emerges from the −59° parS (S2) site and moves towards the ori. (b) Demonstration that when two parS sites are in one strain, the angle of the hairpin traces changes compared to single parS sites. The yellow and blue dashed lines are superimposed on the Hi-C map to help visualize the angle change. (c) The relationship between the tilt of the hairpin trace and the loop extrusion speeds (v1, v2 and v3) is captured by a simple geometric relation. The equation shows that for equal v1 across strains with one or two parS sites (as indicated in panel (a)), it follows that v2 > v3.
Extended Data Figure 3:
Extended Data Figure 3:. The blocking and unloading model of loop extruder interactions does not produce all the features seen in the Hi-C map.
The parameter sweep was conducted for varying numbers of extruders and facilitated dissociation rates. The experimental data (for the strain with parS sites at both −94° and −59°) is shown on the top left of the figure. These contact maps were generated with the semi-analytical approach without making the shortest path approximation as described in Appendix 3 of Banigan et al, 2020 (also see Supplementary Notes 1–5). Notably, Lines 4 and 5 are missing in all of the plots with the blocking and unloading model - this is due to either traffic jams forming between extruders (for high numbers of extruders), or an insufficient loading rate (for low numbers of extruders) preventing the efficient formation of nested doublets and triplets.
Extended Data Figure 4:
Extended Data Figure 4:. The number of extrusion complexes tunes the relative frequency of singlet- to adjoining-doublet interactions.
(a) In the experimental Hi-C map for the −59°−94° strain after 60 min of SirA expression, the frequency of singlet contacts to adjoining doublet contacts is close to 1:1. This is only achieved when the number of extrusion complexes is >40 and for sufficiently high bypassing rates. (b) A parameter sweep over the number of extruders and the bypassing rate. The best matched parameter combination is shown boxed in red. For a description of how we obtained the overall best parameters, see Methods and Supplementary Figs. 4–7.
Extended Data Figure 5:
Extended Data Figure 5:. Parameter sweep of the bypassing and unloading rates for N=40 extruders/chromosome.
The experimental data (for the −59°−94° strain) is shown on the top left of the figure, and the model parameter sweep is below. The model with the most similar pattern in both angles of the Hi-C traces and the relative intensities of the different lines corresponds to a bypassing rate of 0.05 s−1 and an unloading rate between 0.001 s−1 and 0.005 s−1. From the sweep, we find that the bypassing rate can control the angle between Hi-C map hairpin structures, while the ratio of the bypassing to unloading rates tunes the relative frequency of nested-doublet and nested-triplet interactions. These contact maps were generated with the semi-analytical approach (see Supplementary Notes 1–5).
Extended Data Figure 6:
Extended Data Figure 6:. Hi-C maps for exponentially growing cells.
Hi-C maps for strains with (a) two parS sites, and (b) three parS sites. Cells were growing exponentially.
Extended Data Figure 7:
Extended Data Figure 7:. Hi-C time course of cells under G1 arrest.
The experimental time course of G1 arrest for a strain with (a) a single parS site at the −59° (top) and −91° (bottom), and (b) with two parS sites at −59° −91° (top) and −91° −117° (bottom). The experiments show that almost no change occurs to the angle of the hairpin traces when only a single parS site is present. However, when two parS sites are present, the hairpins increasingly tilt away from each other. (c) A 3D polymer simulation with the blocking, bypassing and unloading model of loop extrusion showing that when a single parS site is present, increasing the numbers of loop extruders, N, on the chromosome also does not change the observed hairpin angle for the same strains as in (a). Loop extrusion parameters use a bypassing rate of 0.05 s−1 and a facilitated dissociation rate of 0.003 s−1 (i.e. same as Fig. 4a); the number of extrusion complexes is denoted by N.
Extended Data Figure 8:
Extended Data Figure 8:. Quantification of chromosome copy numbers and cell lengths per nucleoid.
(a) Whole genome sequencing plots for cells after the indicated minutes of replication inhibition by SirA. The computed ori:ter ratio indicates that by 60 min of SirA expression, cells have finished chromosome replication. (b) The quantification of microscopy images reveals the numbers of origins per nucleoid, and cell lengths per nucleoid. The numbers of cells analyzed were n=725, 580, 702, 557 for the four time points (exponential, 60 min, 90 min, 120 min), respectively. Means and standard deviations are shown. These values are used to calculate the numbers of SMC complexes per chromosome at different time points. To estimate the absolute numbers of SMC complexes/chromosome (independently of the Hi-C data and polymer simulations), we use the reference value of 30 SMC complexes/ori as measured in (Wilhelm et al, 2015), which converts to 34 SMC complexes/chromosome (indicated by *). We infer that these calculated values agree well with the numbers of loop extrusion complexes (as found by Hi-C and polymer modeling), if there are two SMC complexes per loop extrusion complex; this inference assumes that the error on the reference value of 30 SMC complexes/ori is sufficiently small. For calculations, see the attached Supplementary Data.
Extended Data Figure 9:
Extended Data Figure 9:. Overexpression of SMC complexes speeds up the change of Hi-C patterns with time.
(a) Replication inhibition Hi-C time course following induction of SirA for a strain with parS sites at −27° and −59°. (b) The SMC complex (SMC, ScpA and ScpB) was overexpressed in the same background as the strain in panel A. We found that prolonged over-expression of SMC complexes at 90 min and 120 min did not recapitulate the experiments seen in G1 arrested cells in (a) but caused the interaction lines to become shorter. These patterns are likely due to non-specific loading of SMC complexes outside of parS, creating traffic jams along the DNA. In simulations, when we increase the numbers of off-parS loaded extruders, while keeping the numbers of on-parS loaded extruders consistent, we can observe similar changes in the Hi-C maps. Numbers of on-parS versus off-parS loading are average values for the simulation. (c) With SMC overexpression, the 60 min time point (following SirA induction) more closely resembles the 90 min point than the 60m time point with no SMC overexpression. This indicates that increasing the numbers of SMC complexes on the chromosome leads to an increase in the tilts of the hairpin diagonals away from each other.
Extended Data Figure 10:
Extended Data Figure 10:. Simulations of blocking and unloading (without bypassing) do not reproduce the wild-type Hi-C map.
(a) Analytical results demonstrating there is a high likelihood of collisions between SMC complexes near the ori due to the high density of parS sites. Calculations were performed for a facilitated unloading rate of 0.0006 s−1 and an extrusion rate of 0.8 kb/s. (b) 3D polymer simulations showing that even a few loop extruders (e.g. 5 extruders) results in a missing central diagonal and long-range tethers between the ori and other genome positions. With more extruders per chromosome, the traffic jams between SMC complexes near the origin becomes more likely, preventing juxtaposition of the arms. For very low numbers of extruders (e.g. 2 extruders), the central diagonal is present, but it is much fainter than observed experimentally.
Figure 1:
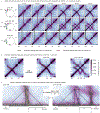
Figure 1:. Experimental system to study the effect of “collisions” between SMC complexes.
(a) Experimental setup. (b) Schematic of strains indicating the positions of single parS sites inserted on the chromosome of B. subtilis. (c) Hi-C maps of G1-arrested cells. B. subtilis strains contain a single parS site at −94° (2981 kb, left), −59° (3377 kb, middle) or at both sites (right). (d) HiC maps from a time course experiment following induction of ParB, the SMC loading protein, for the indicated times. The schematic illustrates the paths of SMC loop extruders superimposed on the chromosome for each strain at 10 min following ParB induction.
Figure 2:
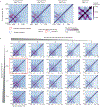
Figure 2:. Specific interactions between SMC complexes leave unique Hi-C signatures.
(a) Decomposition of the Hi-C map into assemblies of SMC complexes. The schematic diagram (top row) and the arch-diagram representation (middle row) of the SMC assemblies are superimposed on a Hi-C map (bottom row). Locations of point-like SMC-mediated contacts are depicted either by a yellow arrow (top, middle), or by a yellow/pink dot on the Hi-C map (bottom). S1 and S2 are SMC loading sites (blue dots). SMCs loaded on S1 are orange and on S2 pink. These colors are consistent between rows to facilitate comparison. SMC complexes in different cells can meet at different genome positions; when averaged over a population of cells, the contacts mediated by SMC collisions generate ‘lines’ in the HiC map. (b) Possible interaction rules of SMC complexes (blocking, unloading, bypassing). The schematic diagram (top row) illustrates the interaction. The arch diagram (second row) captures the 1D contact along the DNA. The 2D Hi-C-like contact trace (third row) captures the spatio-temporal behaviour of a single interaction by a pair of extrusion complexes. For second and third rows, extrusion time is shown over a 15 min period, and times are indicated by arch or dot colours. A 3D polymer simulation and the resulting contact map for each interaction rule is shown on the bottom row. A broader parameter sweep can be found in Extended Data Figs. 3, 4, 5. (c) A parameter sweep over the three interaction rules accounting for different rates gives a best-match model (Supplementary Figs. 4–7 and Methods): For N=40 extrusion complexes per chromosome, we find that bypassing rates are ~1/20 s−1 and unloading rates are ~1/300 s−1. A comparison between the experimental data and a 3D polymer simulation of the model is shown.
Figure 3:
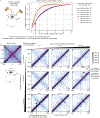
Figure 3:. Validating and testing a model of in vivo Z-loop formation.
Data and simulations of Hi-C maps of strains containing two parS sites (a) or three parS sites (b); all models use the same parameters as identified in Fig. 2c. (c) A comparison of SMC occupancy between experimental ChIP-seq (red) and our model for different rates of bypassing (blue, green and yellow); notably, a bypassing rate of ~1/20 s−1 identifies the best-fit model. This comparison is independent of the comparisons between Hi-C results and modeling.
Figure 4:
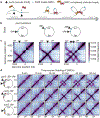
Figure 4:. Numbers of SMC complexes per chromosome tunes the shape of contact maps.
A time-course of Hi-C (a) and SMC ChIP-seq (b) tracking chromosome structure changes and SMC occupancy following replication arrest by SirA; experiments are compared to simulations in which the numbers of SMC complexes per chromosome are increased, but all other simulation parameters are kept as determined in Fig. 2c. (c) Top row: fluorescence microscopy of tagged chromosome loci marking the ori (green), DAPI-stained nucleoid (blue). Bottom Row: nucleoids in a strain containing −27°59° parS sites. Membranes are stained in red. This experiment was independently performed twice with similar results. Scale bar indicates 4 μm. Quantification of the data is provided in Extended Data Fig. 8b. (d) Western blots for the indicated proteins. (e) Quantification of the number of extrusion complexes per cell (assuming extrusion complexes as dimers of SMC complexes); numbers are calculated using the fluorescence microscopy, Western blot, and whole-genome sequencing data quantifications. For simulations, confidence intervals are estimated by qualitatively matching simulated contact maps (i.e. size of the star-shape, angles and intensities of Lines 1–5) to experimental Hi-C maps. Mean and standard deviation are shown for the experimental fold-change in SMC abundance values. The numbers of cells analyzed were n=725, 580, 702, 557 for the four time points. See also Extended Data Fig. 8. Unprocessed images for panel c and full scans of the blots in panel d are uploaded to Mendeley Data.
Figure 5:
Figure 5:. Time-dependent change of Hi-C patterns in strains with 3 parS sites.
(a) Hi-C time-course experiments upon SirA induction (top) and corresponding 3D polymer simulations (bottom) for a strain with three parS sites at positions −91°, −59°, −27°. (b) Anti-SMC ChIP-seq performed for the same strains; experiments (red) and simulations of SMC abundance (blue). (a-b) In the simulations, the bypassing rate was 0.05 s−1 and the facilitated dissociation rate was 0.003 s−1 (i.e. the same as Fig. 4a).
Figure 6:
Figure 6:. Time-dependent change of Hi-C patterns in strains with wild-type parS sites.
(a) Experiments (top) and simulations (bottom) of G1-arrested wild-type B. subtilis cells. The wild-type parS sites occur at positions (−27°, −6°, −5°, −4°, −1°, +4°, +17°, +42°, +91°). In the simulation, we excluded the +91° parS site because SMC complex loading is strongly attenuated by the proximal chromosome interaction domain boundary and SMC binding at this site is substantially weaker than at the others. In both experiments and simulations, the central diagonal gradually vanishes due to traffic jams between extruders at the ori-proximal parS sites after increasing numbers of loop extruders. The bypassing rate was 0.05 s−1 and the unloading rate was 0.003 s−1 in the simulations. (b) Calculated average time between SMC collision events from the model shown in (a). The violin plot (top panel) shows the distribution of the average time between SMC collisions from 61 independent simulations, where each simulation contains a measurement of at least 150 collision events. Horizontal bars indicate the extrema of simulation values; even for cells with only 5 SMC complexes per chromosome, encounters are expected approximately every 10 minutes on every chromosome. For the expected number of SMC complexes in wild-type cells (black dotted line, bottom panel), the mean collision time is less than 1 min.
Figure 7:
Figure 7:. Schematic model illustrating how SMC encounters are resolved.
Upon an encounter, SMC complexes first mutually block one another and then may resolve the conflict either by bypassing (top row) or unloading from the DNA (bottom row). The bypassing mode of conflict resolution occurs at least 10 times more frequently than unloading (indicated by the thickness of the arrows).

References

    1. Hirano T Condensins: universal organizers of chromosomes with diverse functions. Genes Dev 26, 1659–1678, doi:10.1101/gad.194746.112 (2012). - DOI - PMC - PubMed
    1. Yatskevich S, Rhodes J & Nasmyth K Organization of Chromosomal DNA by SMC Complexes. Annu Rev Genet 53, 445–482, doi:10.1146/annurev-genet-112618-043633 (2019). - DOI - PubMed
    1. Davidson IF et al. DNA loop extrusion by human cohesin. Science 366, 1338–1345, doi:10.1126/science.aaz3418 (2019). - DOI - PubMed
    1. Ganji M et al. Real-time imaging of DNA loop extrusion by condensin. Science 360, 102–105, doi:10.1126/science.aar7831 (2018). - DOI - PMC - PubMed
    1. Golfier S, Quail T, Kimura H & Brugues J Cohesin and condensin extrude DNA loops in a cell cycle-dependent manner. eLife 9, doi:10.7554/eLife.53885 (2020). - DOI - PMC - PubMed

Publication types

MeSH terms