Clinical Trial
. 2021 Aug;22(8):1020-1029.
doi: 10.1038/s41590-021-00979-1. Epub 2021 Jul 26.

Epigenetic scars of CD8+ T cell exhaustion persist after cure of chronic infection in humans

Affiliations
Clinical Trial

Epigenetic scars of CD8+ T cell exhaustion persist after cure of chronic infection in humans

Kathleen B Yates et al. Nat Immunol. 2021 Aug.

Abstract

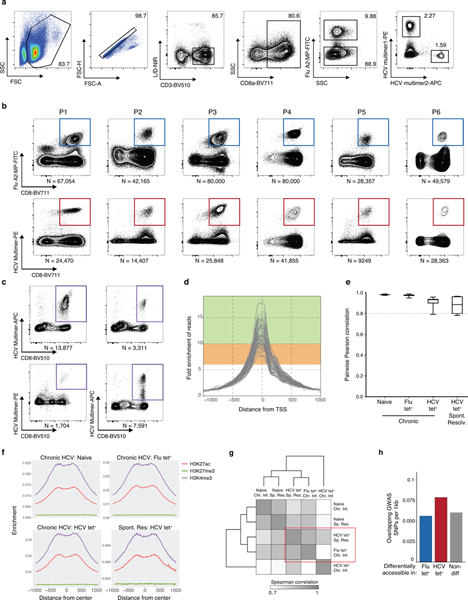
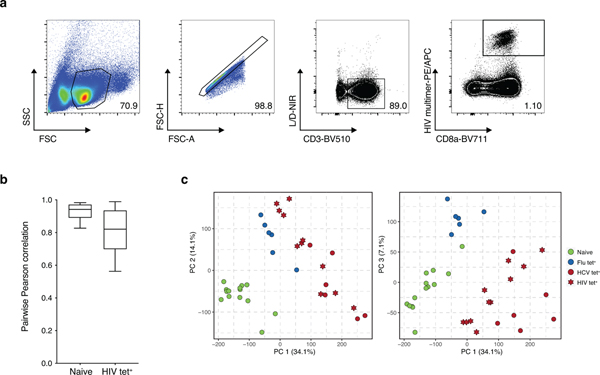
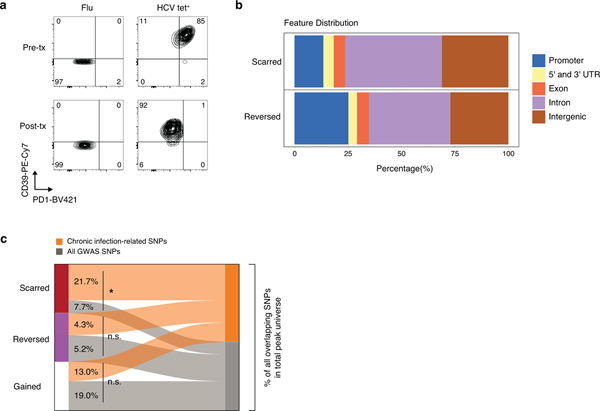
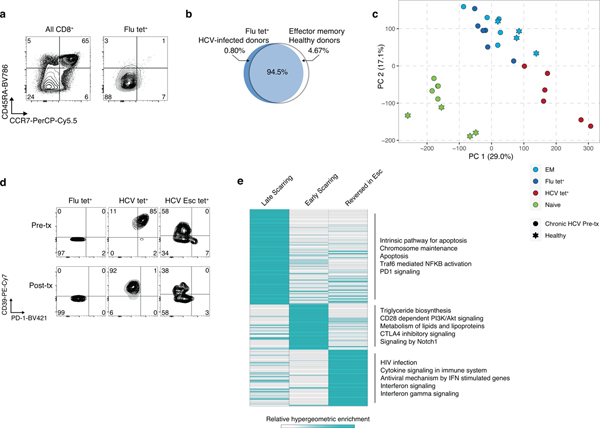
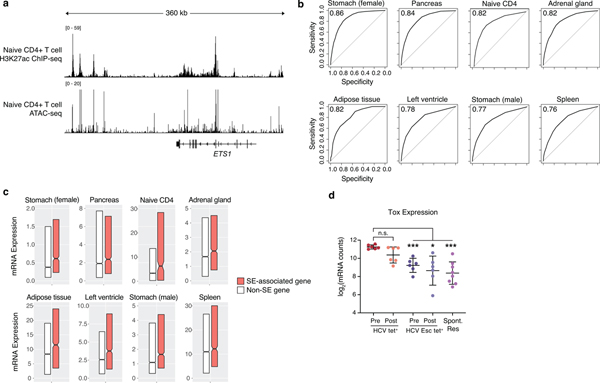
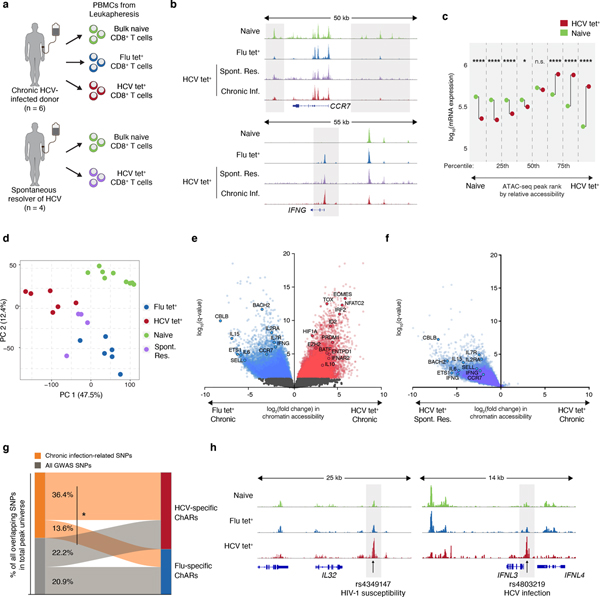
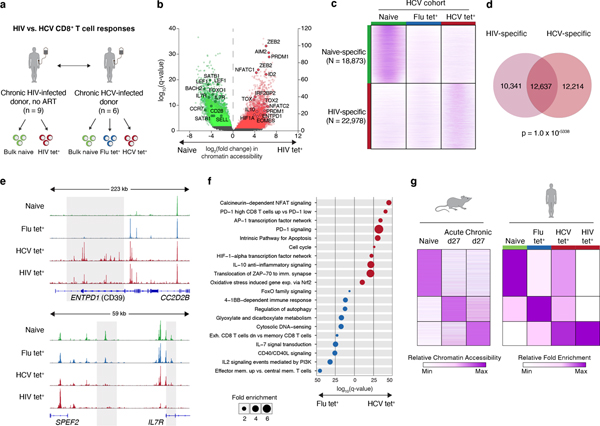
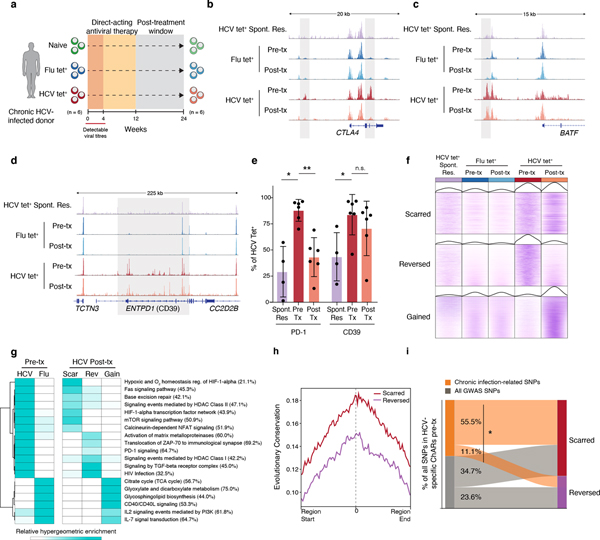
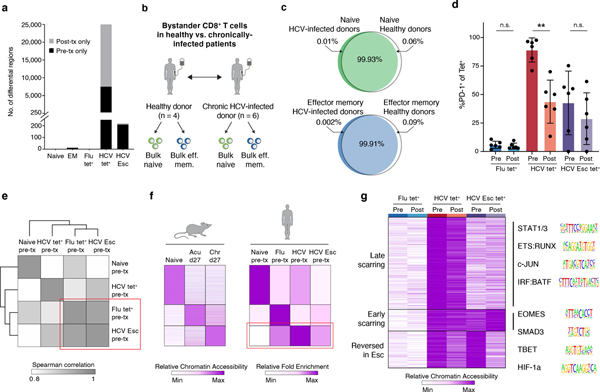
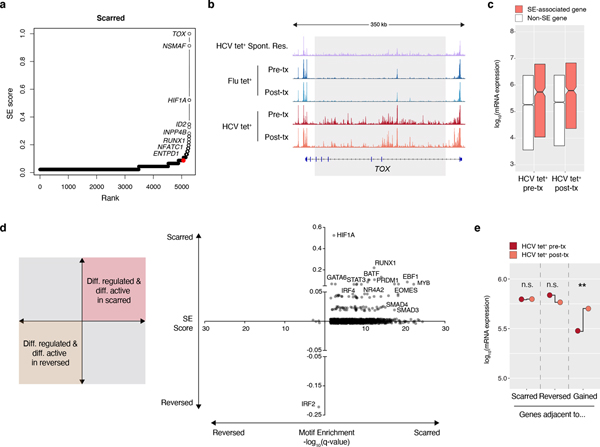
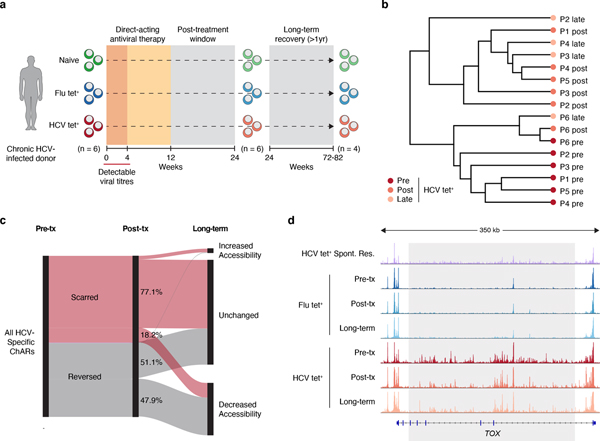
T cell exhaustion is an induced state of dysfunction that arises in response to chronic infection and cancer. Exhausted CD8+ T cells acquire a distinct epigenetic state, but it is not known whether that chromatin landscape is fixed or plastic following the resolution of a chronic infection. Here we show that the epigenetic state of exhaustion is largely irreversible, even after curative therapy. Analysis of chromatin accessibility in HCV- and HIV-specific responses identifies a core epigenetic program of exhaustion in CD8+ T cells, which undergoes only limited remodeling before and after resolution of infection. Moreover, canonical features of exhaustion, including super-enhancers near the genes TOX and HIF1A, remain 'epigenetically scarred.' T cell exhaustion is therefore a conserved epigenetic state that becomes fixed and persists independent of chronic antigen stimulation and inflammation. Therapeutic efforts to reverse T cell exhaustion may require new approaches that increase the epigenetic plasticity of exhausted T cells.


Conflict of interest statement

Competing interests

AbbVie sponsored the clinical trial (NCT02476617) and gave input to trial design and clinical and biological sample collection schedule. W.N.H. is an employee of Merck and Company and holds equity in Tango Therapeutics and Arsenal Biosciences. The authors declare no other competing interests.

Figures

Extended Data Fig. 1
(A) Representative flow cytometry sorting strategy for Flu and HCV multimer+ CD8+ T cells. (B) Recovered numbers of Flu (top) and HCV (bottom) multimer+ cells for each donor during chronic HCV infection. (C) Recovered numbers of HCV multimer+ cells for each donor during resolved HCV infection. (D) Combined ATAC signal across all TSSs for each biological condition from each donor. Green and range bands indicate ranges for ideal and acceptable values, respectively, for TSS enrichment per ENCODE standards. (E) Boxplots of pairwise Pearson correlations for data from individual donors within each biological condition. Centre, median; box limits, first and third percentiles; whiskers, min and max. N = 6 donors. (F) Combined ATAC signal across all H3K27ac peaks (red), H3K27me3 (green) and H3K4me3 (purple). Histone mark peaks were determined from the following samples on ENCODE: ENCFF653OGM - H3K27ac, ENCFF285FID - H3K4me3, ENCFF367HSC - H3K27me3. (G) Clustered similarity matrix between the indicated biological conditions in the chronically-infected and spontaneously resolved cohort. (H) Density of overlapping GWAS SNPs per 1000bp in Flu-specific, HCV-specific or non-differential ChARs.
Extended Data Fig. 2
(A) Representative flow cytometry sorting strategy for HIV multimer+ CD8+ T cells. (B) Boxplots of pairwise Pearson correlations for data from individual donors within each biological condition. Centre, median; box limits, first and third percentiles; whiskers, min and max. N = 11 donors. (C) Combined principal component analysis of naïve, HIV-, HCV- and Flu- specific CD8+ T cells from the HIV and HCV cohorts.
Extended Data Fig. 3
(A) PD-1 and CD39 staining on tetramer populations before (top) and after (bottom) DAA therapy. (B) Partitioning of scarred and reversed regions into those overlapping promoters, UTRs, exons, introns and intergenic areas as indicated. (C) Classification of SNPs falling within scarred, reversed or gained ChARs. SNPs that were subcategorized into those associated with chronic viral infection are summarized in Supplementary Table 3.
Extended Data Fig. 4
(A) CCR7 and CD45RA staining on all CD8+ T cells (left) and Flu-specific T cells (right). (B) Venn diagram of ChAR overlap in Flu tet+ cells (bottom) from HCV-infected donors and healthy donors. (C) PD-1 and CD39 staining on tetramer populations before (top) and after (bottom) DAA therapy. (D) Combined principal component analysis of naïve, effector memory, HCV-, and Flu- specific CD8+ T cells from the healthy and HCV cohorts. (E) Heatmap showing pathway enrichment (rows) within clustered ChARs from Figure 4g (columns).
Extended Data Fig. 5
(A) H3K27ac ChIP-seq signal (top) and ATAC-seq signal (bottom) at the ETS1 gene locus. (B) ROC plots of varying cutoff for ATAC-based ranking of super-enhancer to predict bona fide super-enhancers defined using matched tissue-specific H3K27ac ChIP-seq. (C) Boxplots of tissue-specific mRNA expression, partitioned by genes with or without an associated super-enhancer. Centre, median; box limits, first and third percentiles. (D) Tox mRNA expression in HCV tetramer populations before and after DAA therapy. Mean ± s.d., two-sided Student’s t-test with Welch’s correction; *P ≤ 0.05, **P ≤ 0.01, ***P ≤ 0.001. N = 6 donors.
Figure 1.
Figure 1.. Distinct epigenetic changes underlie CD8+ T cell responses to influenza and chronic HCV infection.
(A) Schematic diagram of the experiment. (B) Representative ATAC-seq tracks at the CCR7 and IFNG gene loci. (C) Median mRNA expression of genes neighboring chromatin accessibility regions, which were partitioned into 8 bins based on relative accessibility in naïve vs. HCV tet+ CD8+ T cells. Gene expression from naïve T cells is denoted in green, and that from HCV tet+ cells in red. (D) Principal component analysis of naïve, HCV tet+ and Flu tet+ CD8+ T cell populations across 6 patients. (E) Volcano plot highlighting differential transcripts present in Flu tet+ CD8+ T cells versus HCV tet+ CD8+ T cells (colored dots, FDR < 0.05). (F) Reprojection of Flu-specific ChARs from (E) onto volcano plots comparing HCV tet+ in spontaneously resolved versus chronic infection. (G) Classification of SNPs falling within HCV-specific (red) and Flu-specific (blue) ChARs. SNPs that were subcategorized into those associated with chronic viral infection are summarized in Supplementary Table 3. (H) Representative ATAC-seq tracks at the IL32 and IFNL3 gene locus, showing the location of a SNP associated with HIV-1 susceptibility and HCV infection, respectively.
Figure 2.
Figure 2.. Epigenetic signature of T cell exhaustion is conserved across chronic viral infections.
(A) Schematic diagram of the experiment. (B) Volcano plot highlighting differential transcripts present in HIV tet+ CD8+ T cells versus naive CD8+ T cells from HIV patients (colored dots, FDR < 0.05). (C) Chromatin accessibility at naïve-specific and HIV-specific ChARs within the indicated conditions from the HCV cohort. (D) Venn diagram of overlap between ChARs with increased in accessibility in HIV and HCV tet+ T cells relative to naïve T cells. (E) Representative ATAC-seq tracks at the ENTPD1 and IL7R gene loci. (F) Gene ontology and gene set enrichment (rows) in Flu-specific (blue) or HCV-specific (red) ChARs. FDR values (hypergeometric test) presented as 1–log10. (G) Heatmap of peak intensity within modules of ChARs (rows) from mouse naïve CD8+ T cells, and CD8+ T cells responding to acute and chronic LCMV (left). Fold enrichment of regions orthologous to mouse naïve, memory and exhaustion enhancers in human samples indicated (right).
Figure 3.
Figure 3.. HCV-specific CD8+ T cells retain epigenetic scars of exhaustion despite cure of chronic infection.
(A) Schematic diagram of the treatment regimen. (B-D) Representative ATAC-seq tracks at the CTLA4 (B), ENTPD1 (C) and BATF (D) gene loci. (E) Frequency of PD-1 and CD39 in HCV-specific CD8+ T cells from spontaneously resolved and chronic HCV infection. Mean ± s.d., two-sided Student’s t-test with Welch’s correction; *P ≤ 0.05, **P ≤ 0.01, ***P ≤ 0.001. N = 6 donors for chronic HCV, N = 4 donors for resolved HCV infection. (F) Chromatin accessibility at “scarred”, “reversed” and “gained” ChARs within the indicated conditions from the HCV cohort. (G) Heatmap showing pathway enrichment (rows) within HCV-specific and Flu-specific ChARs pre-treatment, and within scarred, reversed and gained ChARs post-treatment (columns). Percentage of genes observed within total gene-set is denoted in parentheses for the “scarred”, “reversed” and “gained” clusters, respectively. (H) Average evolutionary conservation across the length of all ChARs within the scarred and reversed ChAR set. (I) Alluvial diagram showing shared chronic-infection related or all GWAS SNPs between HCV-specific ChARs pre-treatment and scarred and reversed ChARs post-treatment.
Figure 4.
Figure 4.. Chronic TCR signaling, and not inflammatory milieu, drives epigenetic scarring in exhausted CD8+ T cells.
(A) Quantification of differential ChARs within indicated conditions, before and after DAA therapy. (B) Schematic diagram of the experiment. (C) Venn diagram of ChAR overlap in naïve T cells (top) and bulk effector memory cells (bottom) from HCV-infected donors and healthy donors. (D) PD-1 staining on tetramer populations before and after DAA therapy. Mean ± s.d., two-sided Student’s t-test with Welch’s correction; *P ≤ 0.05, **P ≤ 0.01, ***P ≤ 0.001. N = 6 donors. (E) Clustered similarity matrix between the indicated biological conditions at the pre-treatment timepoint. (F) Heatmap of peak intensity within modules of ChARs (rows) from mouse naïve CD8+ T cells, and CD8+ T cells responding to acute and chronic LCMV (left). Fold enrichment of regions orthologous to mouse naïve, memory and exhaustion enhancers in human samples indicated (right). (G) Heatmap of chromatin accessibility within scarred ChARs (rows), clustered across the indicated cell states (columns). Sequence logos for transcription factor motifs enriched within the indicated clusters (right).
Figure 5.
Figure 5.. Scarred regions identify critical regulators of exhaustion.
(A) Super-enhancer elbow plots based on ChARs within the scarred set of regions. (B) Representative ATAC-seq tracks at the TOX gene locus. (C) Boxplots of log10(mRNA expression) from HCV tet+ cells before and after treatment, partitioned by genes with or without an associated super-enhancer. Centre, median; box limits, first and third percentiles. (D) Plot of transcription factors based on their super-enhancer ranking (y-axis) and differential motif enrichment between scarred and reversed ChARs (x-axis). (E) Median mRNA expression of genes neighboring scarred, reversed or gained chromatin accessibility regions. Gene expression from HCV tet+ cells before and after treatment are denoted in red and orange, respectively.
Figure 6.
Figure 6.. Epigenetic scars of exhaustion are retained long-term after cure of infection.
(A) Schematic diagram of experimental time-points before and after DAA therapy. (B) Clustering of individual HCV tet+ profiles from patients across 3 time-points (pre-treatment, post-treatment and long-term). (C) Longitudinal trajectory of scarred and reversed ChARs at each time point. (D) Representative ATAC-seq tracks at the TOX gene locus.

References

    1. Hashimoto M et al. CD8 T Cell Exhaustion in Chronic Infection and Cancer: Opportunities for Interventions. Annu Rev Med 69, 301–318, doi:10.1146/annurev-med-012017-043208 (2018). - DOI - PubMed
    1. Wherry EJ et al. Molecular signature of CD8+ T cell exhaustion during chronic viral infection. Immunity 27, 670–684, doi:10.1016/j.immuni.2007.09.006 (2007). - DOI - PubMed
    1. Doering TA et al. Network analysis reveals centrally connected genes and pathways involved in CD8+ T cell exhaustion versus memory. Immunity 37, 1130–1144, doi:10.1016/j.immuni.2012.08.021 (2012). - DOI - PMC - PubMed
    1. Sen DR et al. The epigenetic landscape of T cell exhaustion. Science 354, 1165–1169, doi:10.1126/science.aae0491 (2016). - DOI - PMC - PubMed
    1. Gallimore A et al. Induction and exhaustion of lymphocytic choriomeningitis virus-specific cytotoxic T lymphocytes visualized using soluble tetrameric major histocompatibility complex class I-peptide complexes. J Exp Med 187, 1383–1393 (1998). - PMC - PubMed

Publication types

MeSH terms