

Consumption of quinolones in the community, European Union/European Economic Area, 1997-2017
- PMID: 34312652
- PMCID: PMC8314103
- DOI: 10.1093/jac/dkab176
Consumption of quinolones in the community, European Union/European Economic Area, 1997-2017
Abstract
Objectives: Data on quinolone consumption in the community were collected from 30 EU/European Economic Area (EEA) countries over two decades. This article reviews temporal trends, seasonal variation, presence of change-points and changes in the composition of main subgroups of quinolones.
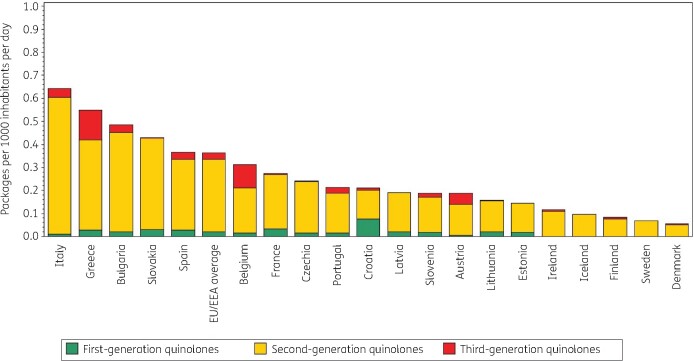
Methods: For the period 1997-2017, data on consumption of quinolones, i.e. ATC group J01M, in the community and aggregated at the level of the active substance, were collected using the WHO ATC/DDD methodology (ATC/DDD index 2019). Consumption was expressed in DDD per 1000 inhabitants per day and in packages per 1000 inhabitants per day. Quinolone consumption was analysed by subgroups based on pharmacokinetic profile, and presented as trends, seasonal variation, presence of change-points and compositional changes.
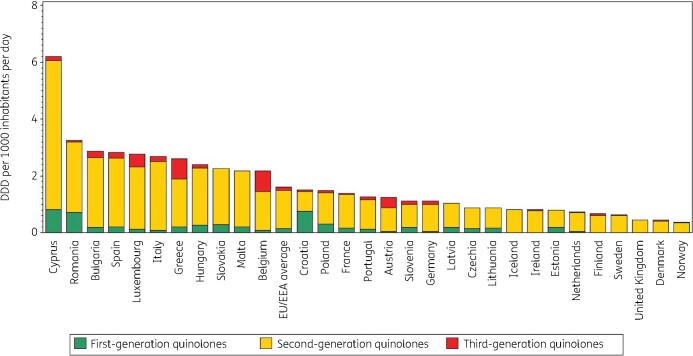
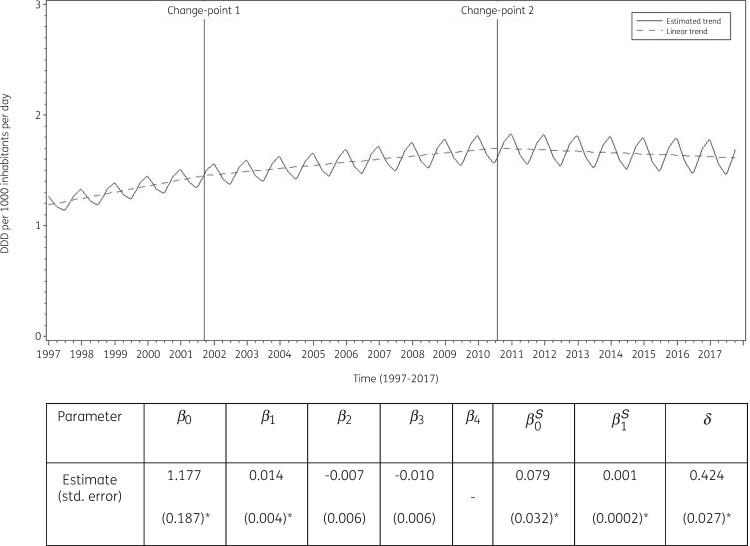
Results: In 2017, quinolone consumption in the community expressed in DDD per 1000 inhabitants per day varied by a factor of 8.2 between countries with the highest (Bulgaria) and the lowest (Norway) consumption. The second-generation quinolones accounted for >50% of quinolone consumption in most countries. Quinolone consumption significantly increased up to 2001, and did not change significantly afterwards. Seasonal variation increased significantly over time. Proportional consumption of third-generation quinolones significantly increased over time relative to that of second-generation quinolones, while proportional consumption of both third- and second-generation quinolones significantly increased relative to that of first-generation quinolones. Levofloxacin and moxifloxacin represented >40% of quinolone consumption in the community in southern EU/EEA countries.
Conclusions: Quinolone consumption in the community is no longer increasing in the EU/EEA, but its seasonal variation continues to increase significantly as is the proportion of quinolones to treat respiratory infections.
© The Author(s) 2021. Published by Oxford University Press on behalf of the British Society for Antimicrobial Chemotherapy.
Figures
References
-
- European Centre for Disease Prevention and Control (ECDC). European Surveillance of Antimicrobial Consumption Network (ESAC-Net). 2020.
-
- Ferech M, Coenen S, Malhotra-Kumar S. et al. European Surveillance of Antimicrobial Consumption (ESAC): outpatient quinolone use in Europe. J Antimicrob Chemother 2006; 58: 423–7. - PubMed
-
- Adriaenssens N, Coenen S, Versporten A. et al. European Surveillance on Antimicrobial Consumption: outpatient quinolone use in Europe (1997–2009). J Antimicrob Chemother 2011; 66 Suppl 6: vi47–56. - PubMed
-
- Ball P.Quinolone generations: natural history or natural selection? J Antimicrob Chemother 2000; 46: 17–24. - PubMed
Publication types
MeSH terms
Substances
LinkOut - more resources
Full Text Sources
Medical
Research Materials
