

Consumption of penicillins in the community, European Union/European Economic Area, 1997-2017
- PMID: 34312657
- PMCID: PMC8314108
- DOI: 10.1093/jac/dkab173
Consumption of penicillins in the community, European Union/European Economic Area, 1997-2017
Abstract
Objectives: Data on consumption of penicillins in the community were collected from 30 EU/European Economic Area (EEA) countries over two decades. This article reviews temporal trends, seasonal variation, presence of change-points and changes in the composition of the main subgroups of penicillins.
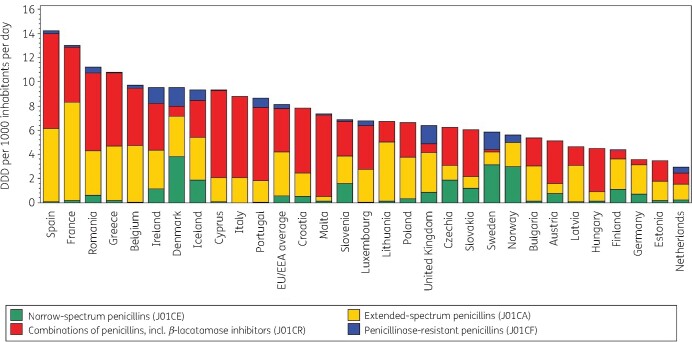
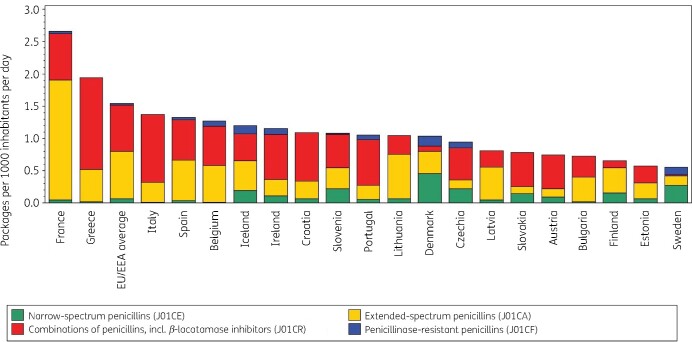
Methods: For the period 1997-2017, data on consumption of penicillins, i.e. β-lactam antibacterials, penicillins (ATC group J01C), in the community aggregated at the level of the active substance, were collected using the WHO ATC/DDD methodology (ATC/DDD index 2019). Consumption was expressed in DDD per 1000 inhabitants per day and in packages per 1000 inhabitants per day. Consumption of penicillins was analysed based on ATC-4 subgroups, and presented as trends, seasonal variation, presence of change-points and compositional changes.
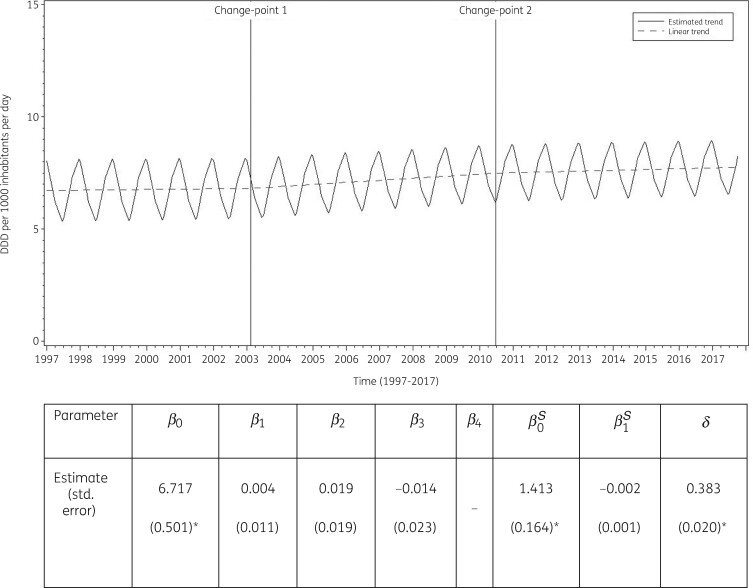
Results: In 2017, consumption of penicillins in the community expressed in DDD per 1000 inhabitants per day varied by a factor of 4.9 between countries with the highest (Spain) and the lowest (the Netherlands) consumption. An increase in consumption of penicillins, which was not statistically significant, was observed between 1997 and 2003 and up to 2010. A decrease, which was not statistically significant, was observed from 2010 onwards. Proportional consumption of combinations of penicillins, including β-lactamase inhibitors (J01CR) increased during 1997-2017, which coincided with a decrease in the proportional consumption of extended-spectrum penicillins (J01CA) and narrow-spectrum penicillins (J01CE).
Conclusions: Considerable variation in the patterns of consumption of penicillins was observed between EU/EEA countries. The consumption of penicillins in the EU/EEA community did not change significantly over time, while the proportional consumption of combinations of penicillins increased.
© The Author(s) 2021. Published by Oxford University Press on behalf of the British Society for Antimicrobial Chemotherapy.
Figures
References
-
- European Centre for Disease Prevention and Control (ECDC). European Surveillance of Antimicrobial Consumption Network (ESAC-Net). 2020. https://www.ecdc.europa.eu/en/about-us/partnerships-and-networks/disease....
-
- Adriaenssens N, Coenen S, Versporten A. et al. European Surveillance of Antimicrobial Consumption (ESAC): outpatient antibiotic use in Europe (1997-2009). J Antimicrob Chemother 2011; 66: vi3–12. - PubMed
-
- Ferech M, Coenen S, Dvorakova K. et al. European Surveillance of Antimicrobial Consumption (ESAC): outpatient cephalosporin use in Europe. J Antimicrob Chemother 2006; 58: 413–7. - PubMed
-
- WHO collaborating centre for drug statistics methodology. ATC Classification index with DDDs 2019. Oslo; 2018.
Publication types
MeSH terms
Substances
LinkOut - more resources
Full Text Sources
Medical
Research Materials
