Review
. 2021 Jul 26;76(12 Suppl 2):ii45-ii59.
doi: 10.1093/jac/dkab177.

Consumption of tetracyclines, sulphonamides and trimethoprim, and other antibacterials in the community, European Union/European Economic Area, 1997-2017

Collaborators, Affiliations
Review

Consumption of tetracyclines, sulphonamides and trimethoprim, and other antibacterials in the community, European Union/European Economic Area, 1997-2017

Ann Versporten et al. J Antimicrob Chemother. .

Abstract

Objectives: Data on consumption of tetracyclines, sulphonamides and trimethoprim, and other antibacterials were collected from 30 EU/European Economic Area (EEA) countries over two decades. This article reviews temporal trends, seasonal variation, presence of change-points and changes in the composition of main subgroups of tetracyclines, sulphonamides and trimethoprim and other antibacterials.

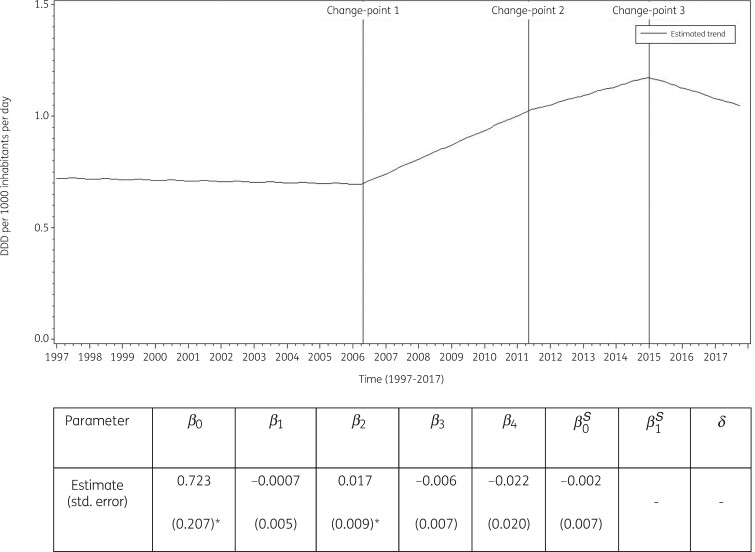
Methods: For the period 1997-2017, data on consumption of tetracyclines (ATC group J01A), sulphonamides and trimethoprim (ATC group J01E), and other antibacterials (ATC group J01X) in the community and aggregated at the level of the active substance, were collected using the WHO ATC/DDD methodology (ATC/DDD index 2019). Consumption was expressed in DDD per 1000 inhabitants per day and in packages per 1000 inhabitants per day. Consumption of tetracyclines, sulphonamides and trimethoprim, and other antibacterials was analysed based on ATC-4 subgroups and presented as trends, seasonal variation, presence of change-points and compositional changes.

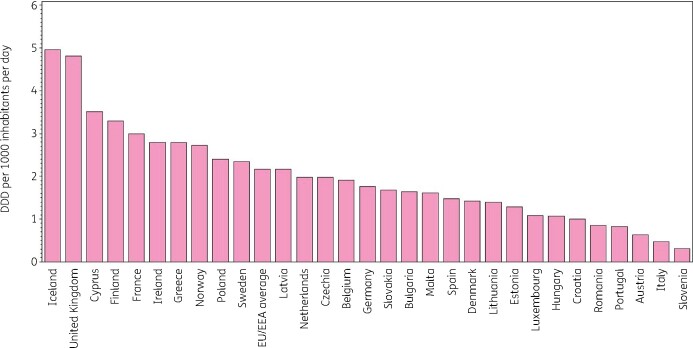
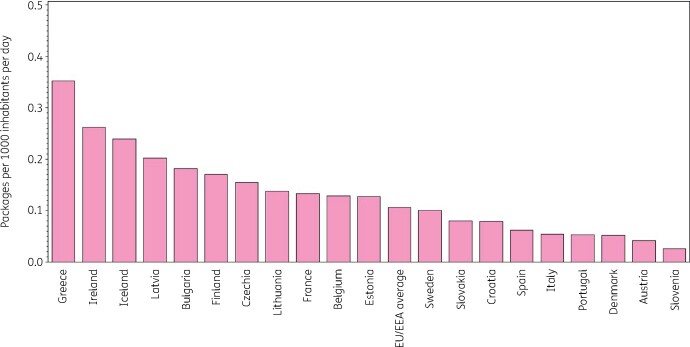
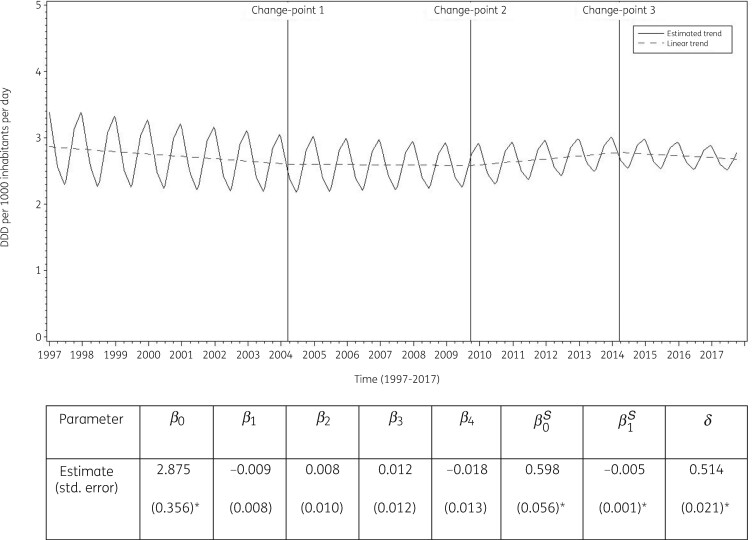
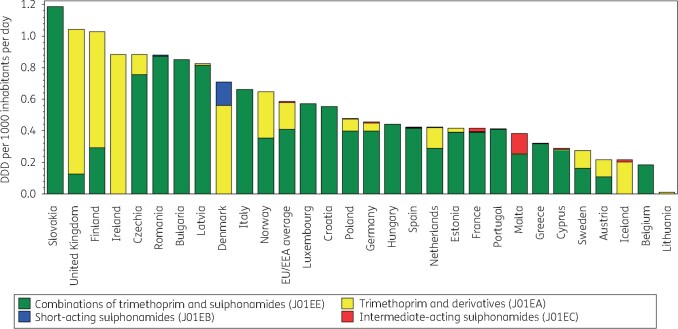
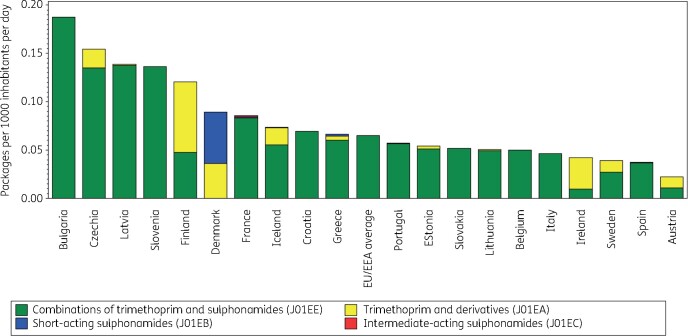
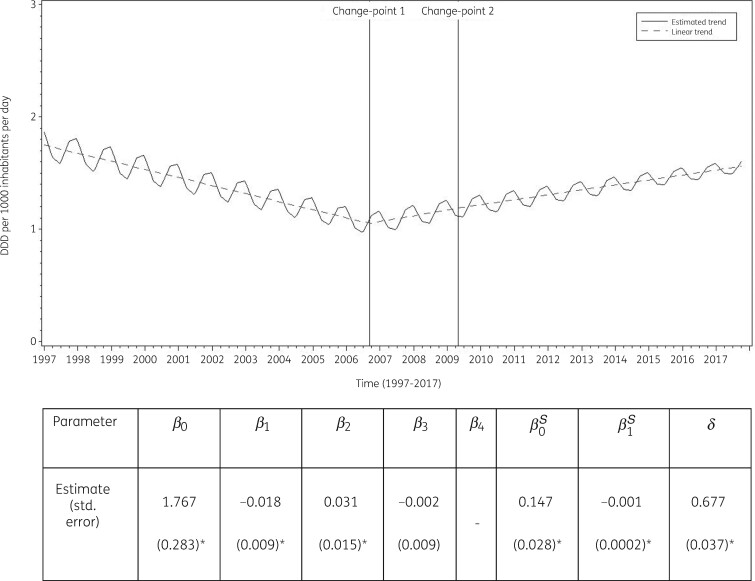
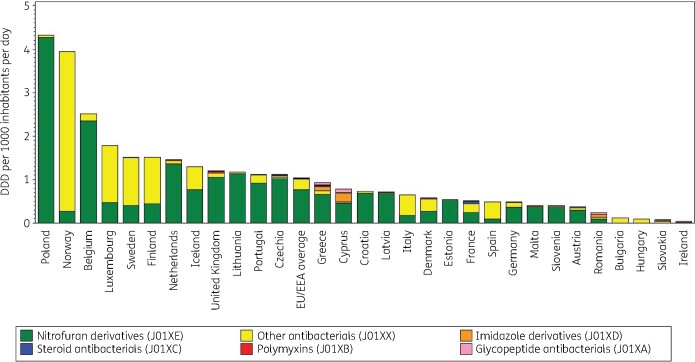
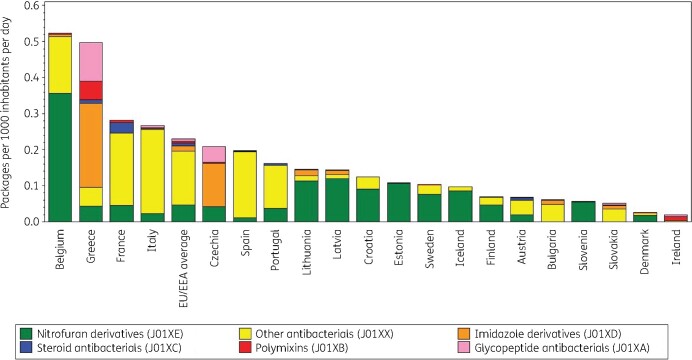
Results: In 2017, consumption of tetracyclines, sulphonamides and trimethoprim, and other antibacterials in the community expressed in DDD per 1000 inhabitants per day varied considerably between countries. Between 1997 and 2017, consumption of tetracyclines did not change significantly, while its seasonal variation significantly decreased over time. Consumption of sulphonamides and trimethoprim significantly decreased until 2006, and its seasonal variation significantly decreased over time. The consumption of other antibacterials showed no significant change over time or in seasonal variation.

Conclusions: Consumption and composition of tetracyclines, sulphonamides and trimethoprim, and other antibacterials showed wide variations between EU/EEA countries and over time. This represents an opportunity to further reduce consumption of these groups in some countries and improve the quality of their prescription.


Figures

Figure 1.
Figure 1.
Consumption of tetracyclines (ATC J01A) in the community, expressed in DDD (ATC/DDD index 2019) per 1000 inhabitants per day, 30 EU/EEA countries, 2017. For Czechia, 2015 data are used. For Slovakia, 2016 data are used. For Cyprus and Romania, total care data, i.e. community and hospital sector combined, are used.
Figure 2.
Figure 2.
Consumption of tetracyclines (ATC J01A) in the community, expressed in packages per 1000 inhabitants per day, 20 EU/EEA countries in 2017. For Czechia, 2015 data are used. For Slovakia, 2016 data are used. For Cyprus and Romania, total care data, i.e. community and hospital sector combined, are used.
Figure 3.
Figure 3.
Estimated trend (solid line) and linear trend (dashed line) of consumption of tetracyclines (ATC J01A) in the community based on quarterly data, 25 EU/EEA countries, 1997–2017. β0, predicted consumption in the first quarter of 1997; β1, predicted increase (if positive)/decrease (if negative) in consumption per quarter; β2, predicted difference in slope after versus before the first change-point; β3, predicted difference in slope after versus before the second change-point; β4, predicted difference in slope after versus before the third change-point; β0S, predicted amplitude of the upward winter and downward summer peak in consumption; β1S, predicted increase (if positive)/decrease (if negative) of the amplitude of the upward winter and downward summer peak in consumption per quarter; δ, shift in timing of the upward winter and downward summer peak from one year to another. An asterisk indicates the result was statistically significant at significance level 0.05.
Figure 4.
Figure 4.
Consumption of sulphonamides and trimethoprim (ATC J01E) in the community, expressed in DDD (ATC/DDD index 2019) per 1000 inhabitants per day, 30 EU/EEA countries, 2017. For Czechia, 2015 data are used. For Slovakia, 2016 data are used. For Cyprus and Romania, total care data, i.e. community and hospital sector combined, are used.
Figure 5.
Figure 5.
Consumption of sulphonamides and trimethoprim (ATC J01E) in the community, expressed in packages per 1000 inhabitants per day, 20 EU/EEA countries, 2017. For Czechia, 2015 data are used. For Slovakia, 2016 data are used. For Cyprus and Romania, total care data, i.e. community and hospital sector combined, are used.
Figure 6.
Figure 6.
Estimated trend (solid line) and linear trend (dashed line) of consumption of sulphonamides and trimethoprim (ATC J01E) in the community expressed based on quarterly data, 25 EU/EEA countries, 1997–2017. β0, predicted consumption in the first quarter of 1997; β1, predicted increase (if positive)/decrease (if negative) in consumption per quarter; β2, predicted difference in slope after versus before the first change-point; β3, predicted difference in slope after versus before the second change-point; β4, predicted difference in slope after versus before the third change-point; β0S, predicted amplitude of the upward winter and downward summer peak in consumption; β1S, predicted increase (if positive)/decrease (if negative) of the amplitude of the upward winter and downward summer peak in consumption per quarter; δ, shift in timing of the upward winter and downward summer peak from one year to another. An asterisk indicates that the result was statistically significant at significance level 0.05.
Figure 7.
Figure 7.
Consumption of other antibacterials (ATC J01X) in the community, expressed in DDD (ATC/DDD index 2019) per 1000 inhabitants per day, 30 EU/EEA countries in 2017. For Czechia, 2015 data are used. For Slovakia, 2016 data are used. For Cyprus and Romania, total care data, i.e. community and hospital sector combined, are used. For Ireland, nitrofurantoin (J01XE01) consumption is not included.
Figure 8.
Figure 8.
Consumption of other antibacterials (ATC J01X) in the community, expressed in packages per 1000 inhabitants per day 20 EU/EEA countries, 2017. For Czechia, 2015 data are used. For Slovakia, 2016 data are used. For Cyprus and Romania, total care data, i.e. community and hospital sector combined, are used. For Ireland, nitrofurantoin (J01XE01) consumption is not included.
Figure 9.
Figure 9.
Estimated trend (solid line) of consumption of other antibacterials (ATC J01X) in the community based on quarterly data from 25 EU/EEA countries, 1997–2017. β0, predicted consumption in the first quarter of 1997; β1, predicted increase (if positive)/decrease (if negative) in consumption per quarter; β2, predicted difference in slope after versus before the first change-point; β3, predicted difference in slope after versus before the second change-point; β4, predicted difference in slope after versus before the third change-point; β0S, predicted amplitude of the upward winter and downward summer peak in consumption; β1S, predicted increase (if positive)/decrease (if negative) of the amplitude of the upward winter and downward summer peak in consumption per quarter; δ, shift in timing of the upward winter and downward summer peak from one year to another. An asterisk indicates that the result was statistically significant at significance level 0.05.

References

    1. European Centre for Disease Prevention and Control (ECDC). European Surveillance of Antimicrobial Consumption Network (ESAC-Net). https://www.ecdc.europa.eu/en/about-us/partnerships-and-networks/disease....
    1. Coenen S, Adriaenssens N, Versporten A. et al.European Surveillance of Antimicrobial Consumption (ESAC): outpatient use of tetracyclines, sulphonamides and trimethoprim, and other antibacterials in Europe (1997–2009). J Antimicrob Chemother 2011; 66: vi57–70. - PubMed
    1. Bruyndonckx R, Adriaenssens N, Versporten A. et al.Consumption of antibiotics in the community, European Union/European Economic Area, 1997–2017. J Antimicrob Chemother 2021; 76: ii7–ii13. - PMC - PubMed
    1. Bruyndonckx R, Adriaenssens N, Versporten A. et al.Consumption of antibiotics in the community, European Union/European Economic Area, 1997–2017: data collection, management and analysis. J Antimicrob Chemother 2021; 76: ii2–ii6. - PMC - PubMed
    1. WHO Collaborating Centre for Drug Statistics Methodology. Guidelines for ATC classification and DDD assignment. https://www.whocc.no/atc_ddd_index_and_guidelines/guidelines/.

Publication types