

HP1γ binding pre-mRNA intronic repeats modulates RNA splicing decisions
- PMID: 34312949
- PMCID: PMC8419704
- DOI: 10.15252/embr.202052320
HP1γ binding pre-mRNA intronic repeats modulates RNA splicing decisions
Abstract
HP1 proteins are best known as markers of heterochromatin and gene silencing. Yet, they are also RNA-binding proteins and the HP1γ/CBX3 family member is present on transcribed genes together with RNA polymerase II, where it regulates co-transcriptional processes such as alternative splicing. To gain insight in the role of the RNA-binding activity of HP1γ in transcriptionally active chromatin, we have captured and analysed RNAs associated with this protein. We find that HP1γ is specifically targeted to hexameric RNA motifs and coincidentally transposable elements of the SINE family. As these elements are abundant in introns, while essentially absent from exons, the HP1γ RNA association tethers unspliced pre-mRNA to chromatin via the intronic regions and limits the usage of intronic cryptic splice sites. Thus, our data unveil novel determinants in the relationship between chromatin and co-transcriptional splicing.
Keywords: Cbx3; HP1; RNA; chromatin; splicing.
© 2021 The Authors.
Conflict of interest statement
The authors declare that they have no conflict of interest.
Figures
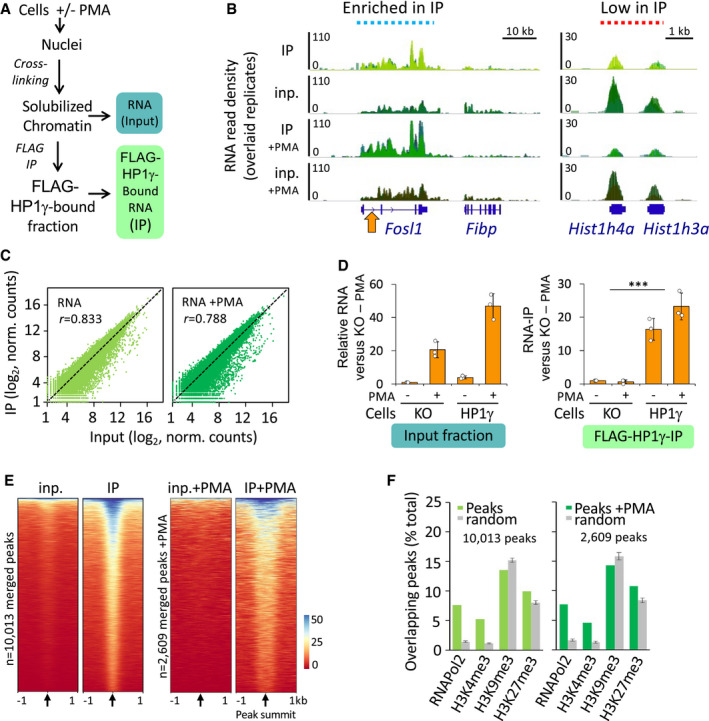
Scheme of the strategy used to assay HP1γ association with RNA on chromatin.
Genome views of RNA read density profiles on representative loci enriched (left) or low (right) in FLAG‐HP1γ RNAchIP (IP) relative to input RNA (inp.) in overlaid replicate samples from HP1γ cells stimulated or not with PMA. Orange arrow, position of the locus analysed in D.
Genome‐wide scatter plot of IP and input normalized (norm.) RNA read counts per gene for the mean of the triplicates; n = 21,754; r, Pearson's correlation coefficient between IP and input.
Relative quantities of RNA in the RNAchIP samples, detected by RT–qPCR with primers aligning on the intron1 of the Fosl1 gene as depicted in B (orange arrow). n = 3 independent experiments.
Heat maps of RNA IP and input signal centred on the summit of RNAchIP peaks of IP versus input detected by MACS2 analysis (10,013 and 2,609 peaks) for a representative replicate (replicate 1). Black arrows represent peak summit.
Percentage of RNAchIP peaks overlapping with indicated chromatin features in MEF samples from ENCODE database (green bars). Overlaps was evaluated by comparison with the list of merged peaks whose genomic location was randomized among genes with one hundred permutations (random, grey bars).
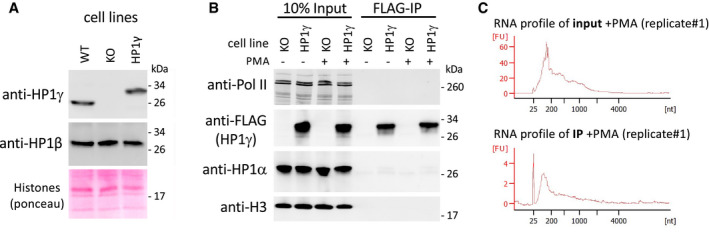
Top panels, western blot analysis of HP1γ and HP1β protein levels in MEF‐derived cells expressing or not FLAG‐tagged HP1γ (HP1γ or KO, respectively), compared to WT MEF‐derived cells. Bottom panel, total protein staining by Ponceau S. Panel is a section of the blot centred on 17 kD, showing Histones.
Detection of RNA polymerase II (Pol II), FLAG‐tagged HP1γ, HP1α and Histone H3 (H3) in the RNAchIP fractions depicted in Fig 1 by Western blot analysis in the HP1γ‐expressing cells (HP1γ), compared to KO cells (KO).
Virtual gel profiles showing the size range of RNA fragments in both input and IP representative samples from HP1γ cells, obtained by Bioanalyzer (Agilent).
- A
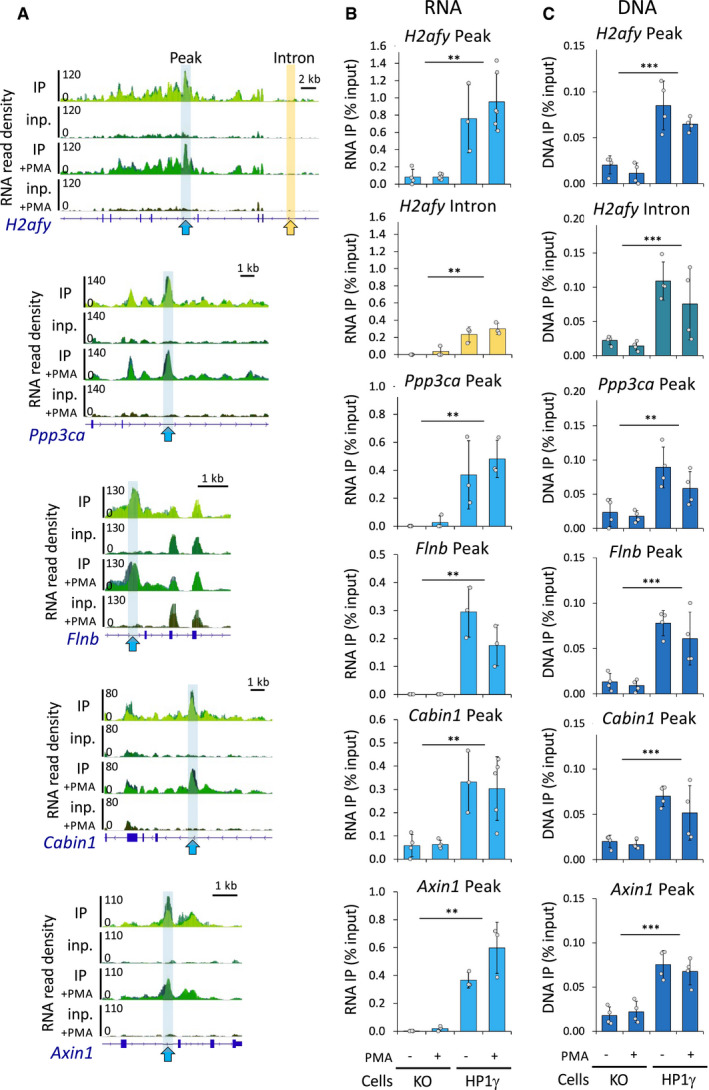
Genome views of RNA read density in overlaid replicates as in (Fig 1B) on representative gene loci bearing a peak (blue arrows) identified by MACS2, together with a neighbouring intronic region (yellow arrow).
- B, C
Relative quantities of RNA (B) and DNA (C) in the RNAchIP samples versus input in both HP1γ and KO cell lines, detected by RT–qPCR (B) and by PCR (C), at the peak (blue) and in the intron (yellow) regions delineated in (A). n = 3–5 independent experiments.
- A
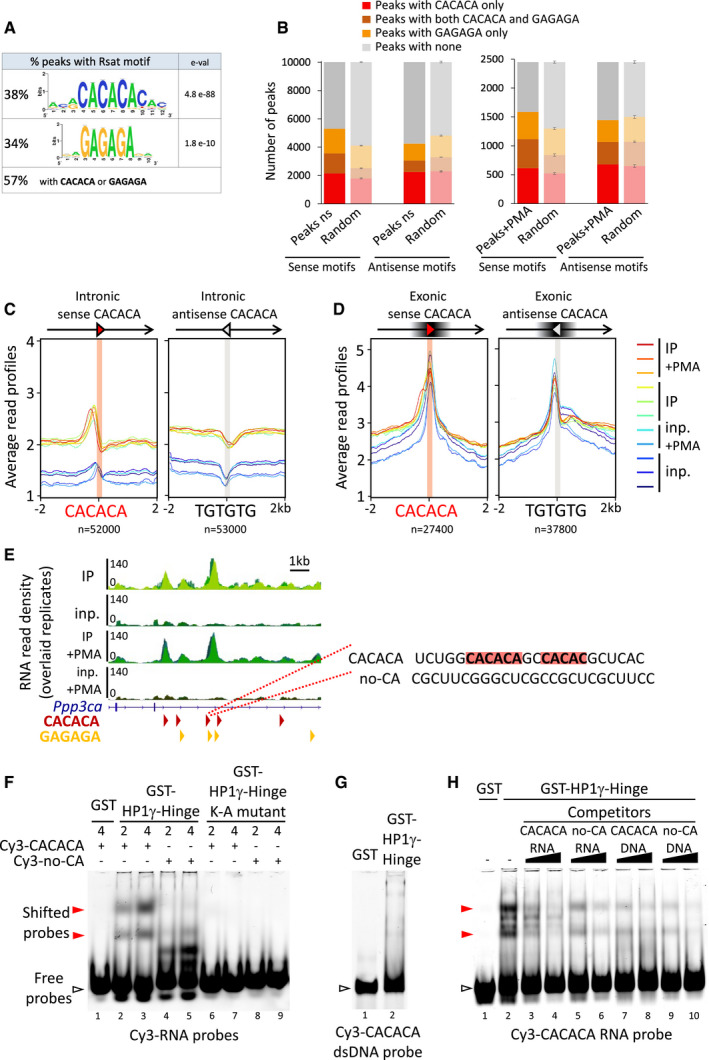
Consensus motifs discovered among RNAchIP peaks with the RSAT pipeline, together with the percentage of peaks containing at least one exact hexameric CACACA or GAGAGA motifs or both. e‐val. represents the expected number of patterns which would be returned at random for a given probability.
- B
RNAchIP peaks are enriched in CACACA and GAGAGA motifs. Number of peaks containing at least one exact hexameric motif as indicated, compared to the average number of motifs in peaks whose genomic location was randomized among genes with ten permutations (random, light bars, represent mean and SD).
- C, D
Distribution profiles of average RNAchIP signal in both IP (warm colours) and input (blue colours) over ± 2 kb centred on intronic (C) and exonic (D) CACACA hexameric motifs oriented in the same orientation (sense) or in opposite orientation (antisense) relative to the overlapping annotated transcript. The antisense CACACA motifs were obtained by querying the transcript sequences with the TGTGTG motif.
- E
Left, representative example of a locus on the Ppp3ca gene surrounding an RNAchIP merged peak, showing the RNAchIP read density as in Fig 1B. Red and orange arrowheads correspond to oriented CACACA and GAGAGA motifs, respectively. Right, sequence of the RNA surrounding a CACACA motif highlighted in red, as well as a neighbouring imperfect motif. The sequence was used to design a CACACA‐containing RNA oligonucleotide probe (CACACA), compared to a control probe (no‐CA) devoid of any related motif.
- F–H
Gel mobility shift assays of bacterially expressed, purified HP1γ‐Hinge domain, fused to GST proteins and tested for its direct interaction with the Cy3‐labelled RNA (F and H) or dsDNA (G) oligonucleotide probes depicted in (C). The probes in the gels, either free (white arrowheads) or as shifted protein/RNA complexes (red arrowheads) were detected by their Cy3 fluorescence. Representative of three independent experiments.
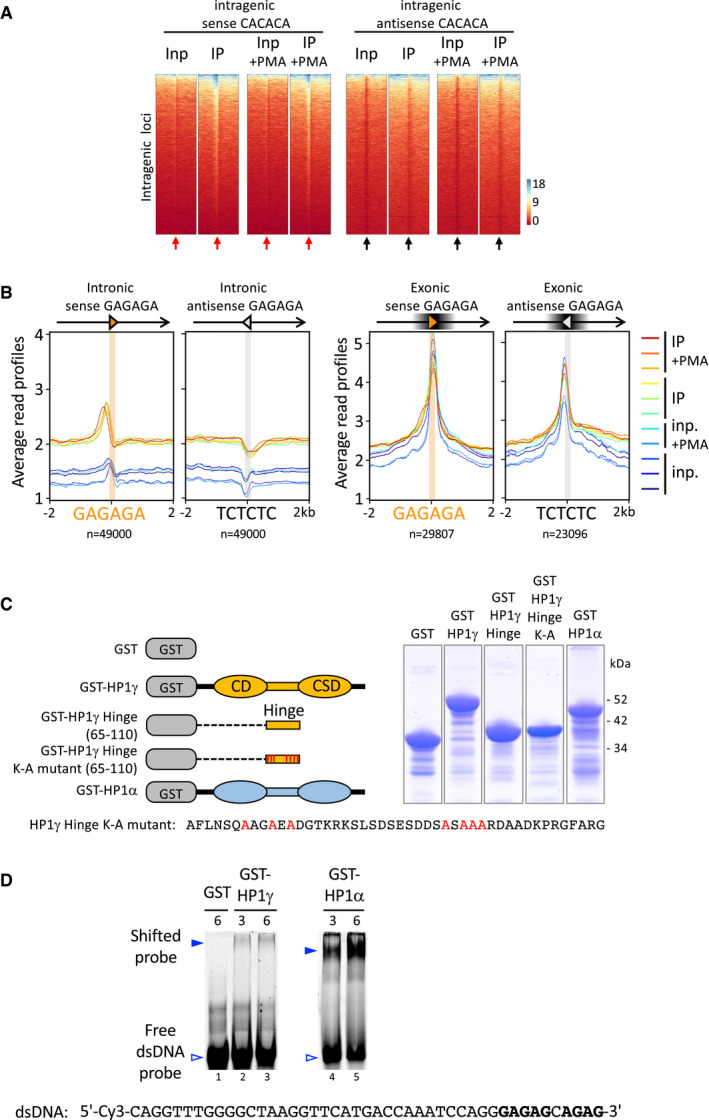
Heat maps of IP and input signal in replicate sample 1 for each condition over ± 2 kb centred (arrows) on intragenic sense or antisense CACACA hexameric motifs (red or black arrows, respectively), corresponding to the average profiles depicted in Fig 2B.
Distribution profiles of average RNAchIP signal in both IP (warm colours) and input (blue colours) over ± 2 kb centred on intronic (left) and exonic (right) GAGAGA hexameric motifs oriented in the same orientation (sense) or in opposite orientation (antisense) relative to the overlapping annotated transcript. The antisense GAGAGA motifs were obtained by querying the transcript sequences with the TCTCTC motif.
Left, schematic representation of the GST‐HP1γ constructions used in gel mobility shift assay, depicting the chromo‐ and chromoshadow‐globular domains, as well as the unstructured Hinge domain (CD, CSD, Hinge, respectively). Right, Coomassie blue staining of the bacterially expressed, purified GST‐HP1 fusion proteins used in Figs 2D, EV2C and 3H.
Gel mobility shift assay performed in the same conditions as in Fig 2, on the indicated dsDNA oligonucleotide probe. The probes in the gels, either free (white arrowheads) or as shifted protein/DNA complexes (blue arrowheads) were detected by their Cy3 fluorescence.
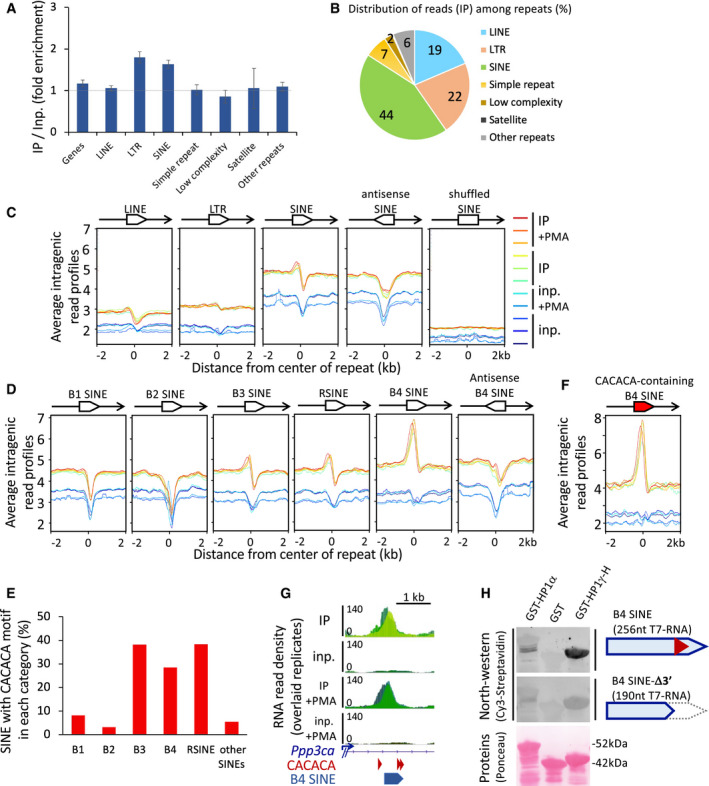
Fold enrichment values on all repeat masker classes and on Refseq genes, on the basis of all uniquely aligned reads, shown as mean and SD, n = 6 biological replicates. Dashed line represents an IP/Input ratio of 1, taken as a reference.
Pie chart of the distribution of RNA sequencing reads in IP per repeat masker classes counted as in (A), as a percentage of all repeats.
Profiles of average RNAchIP signal as in Fig 2B over ± 2 kb centred on intragenic LINE, LTR or SINE repeats annotated in the Repeat masker database (n = 34,000). All repeats are in the same orientation (sense) relative to the overlapping annotated transcript, unless otherwise specified (antisense, shuffled), and as depicted by an oriented white box overlapping the transcript in 5′–3′ orientation (black line with arrowhead).
Profiles of average RNAchIP signal, as in (C) centred on the 5 major families of intragenic SINE repeats.
Proportions of the families of CACACA‐containing SINE repeats within each family, as a percentage of total intragenic sense SINEs.
Profiles of average RNAchIP signal, as in (D) centred on the subset of intragenic B4 SINEs containing a consensus CACACA motif.
Genomic position of a B4 SINE repeat and CACACA consensus motifs at the location of the RNAchIP peak depicted in Fig 2C.
North‐western blot assay showing direct association between the indicated bacterially expressed, purified GST‐fusion proteins and in vitro transcribed, biotinylated RNA probes based on the sequence of the B4 SINE depicted in (G). Top panels, binding of a 256nt probe corresponding to the CACACA‐containing B4 SINE sequence, was compared to an identical B4 SINE deleted of its CACACA by truncation of its 3′ portion (B4 SINE‐Δ3′). RNA probes hybridized on the membranes were detected by their Cy3 fluorescence. Total GST‐fusion protein loading was visualized by Ponceau S staining. Representative of two independent experiments.
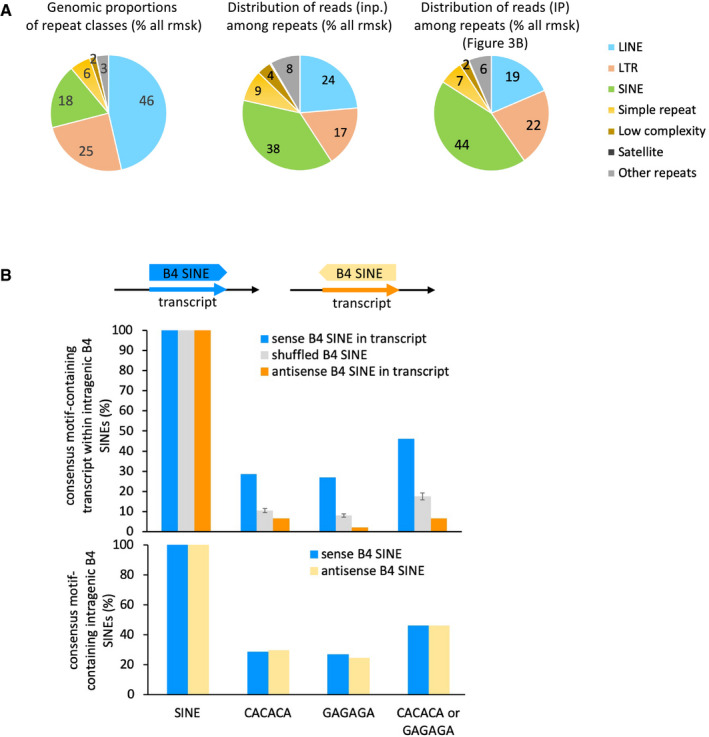
Pie charts depicting the proportions of repeat classes of the Repeat Masker database, in terms of their cumulated genomic size (left chart), percentage of RNA sequencing reads from input (middle chart) and IP (right chart) counted per repeat classes as a percentage of all repeats, on the basis of all uniquely aligned reads.
Intragenic B4 SINE repeats have a CACACA or GAGAGA motif density which is linked to their orientation in the gene, not with the proportions of CACACA in their intrinsic sequence. Top, schematic representation of the features. Middle, proportions of intragenic B4 SINE repeats which contain the depicted hexameric motifs when the sequence is read in the same orientation as the overlapping gene. Bottom, both sense and antisense B4 SINE repeats contain identical intrinsic motif density in their sequence. Graphs represent mean and SD for the three times randomized intervals.
- A
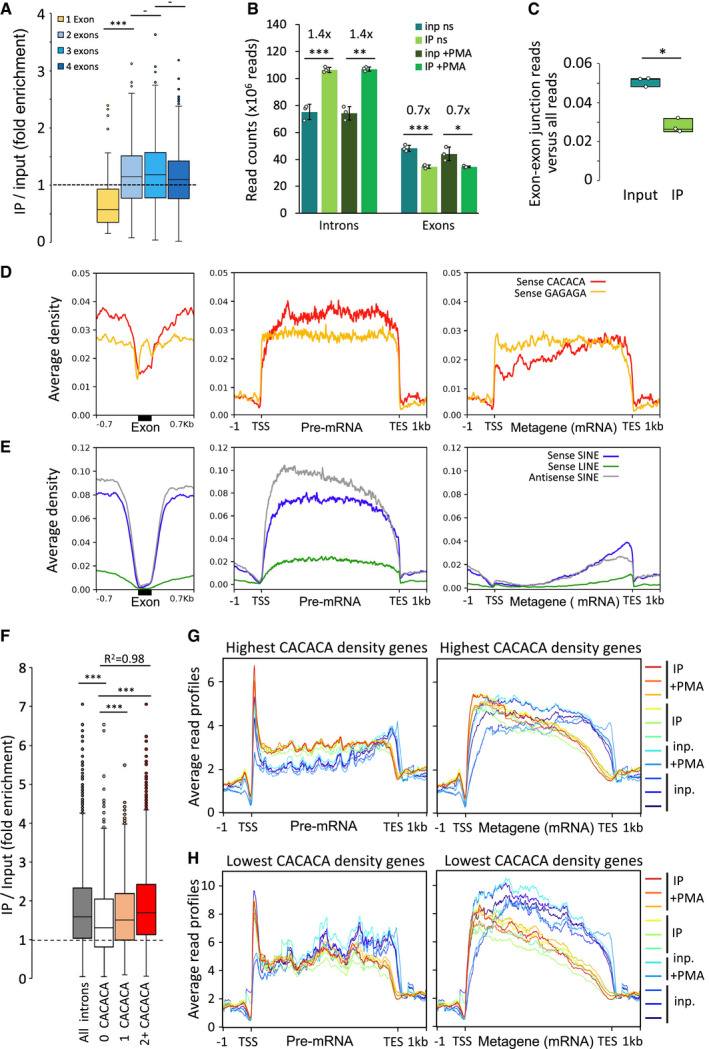
Box plot showing the distribution of fold enrichment values per genes sorted by exon number, n = 66, 247, 389, and 574 genes with 1, 2, 3 and 4 exons, respectively. Dashed line represents an IP/Input ratio of 1, taken as a reference.
- B
Reads from input and IP counted in unstimulated and PMA stimulated triplicates give significant enrichment values of 1.4 and 0.7 on introns and exons, respectively, shown as mean and SD, n = 3 biological replicates. Dots represent individual data points.
- C
Box plot of reads belonging to spliced transcripts versus all reads in input or RNAchIP samples pooled between + and –PMA, calculated as a ratio between split reads and total reads, n = 3 biological replicates. Dots represent individual data points.
- D, E
Average distribution profiles of the depicted hexameric motifs (D), or SINE and LINE repeats (E) on RefSeq genes, computed over exons (black box) and on ± 0.7 kb of surrounding introns (left panels), or over entire gene bodies including introns (pre‐mRNA; middle panels), or as metagenes over exons only (Metagene mRNA; right panels).
- F
Box plot as described in (A) showing the distribution of fold enrichment values on series of introns of comparable size (4kb in average, ranging from 3 to 5kb) sorted by number of sense CACACA motifs per intron (2+, two or more motifs), n = 5,782, 899, 960 and 3,234 introns for all introns, 0, 1 and 2+ CACACA categories, respectively. R2, Linear regression coefficient between 0, 1 and 2+. Dashed line represents an IP/Input ratio of 1, taken as a reference.
- G, H
Average read profiles as in Fig 2C computed as in (D) and (E) on two groups of RefSeq genes, in the size range 4–15 kb, containing the highest (G) or lowest (H) CACACA motif density.
- A
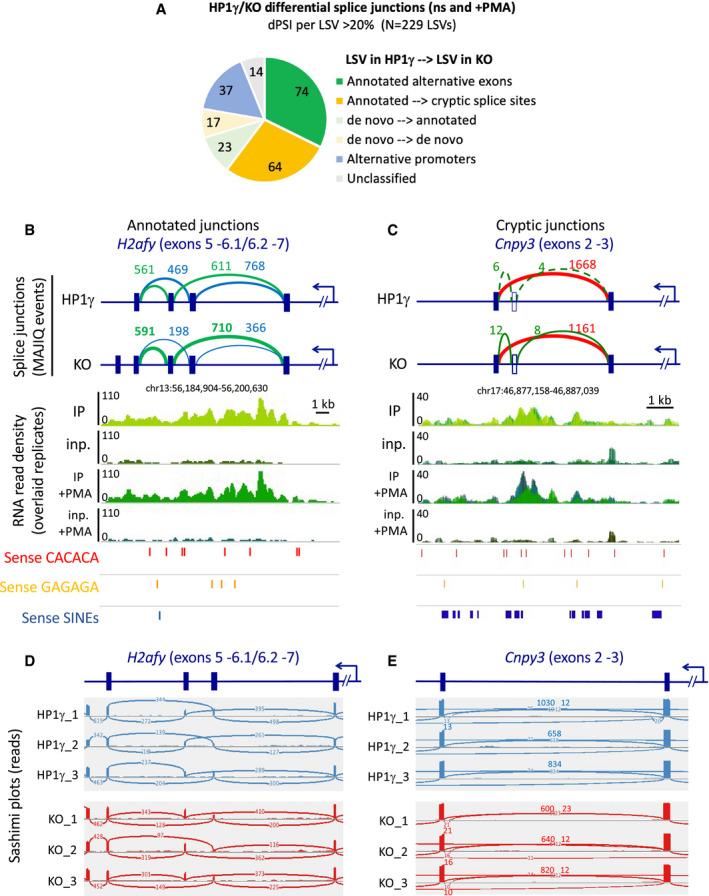
Number of high confidence differential splice junctions detected by MAJIQ as Local Splice Variations (LSV) with d(PSI)>= 0.2 between HP1γ and KO. “Unclassified” are Junctions in rRNAs, satellite repeats or undefined junction changes (not matching any gene).
- B, C
Schemes showing the splicing event depicted in Fig 5A and B (top), together with RNAchIP read density profiles (middle) and position of the indicated oriented repeated motifs (bottom).
- D, E
Sashimi plots showing the reads corresponding to the splicing events depicted in Fig EV5B and C.
- A, B
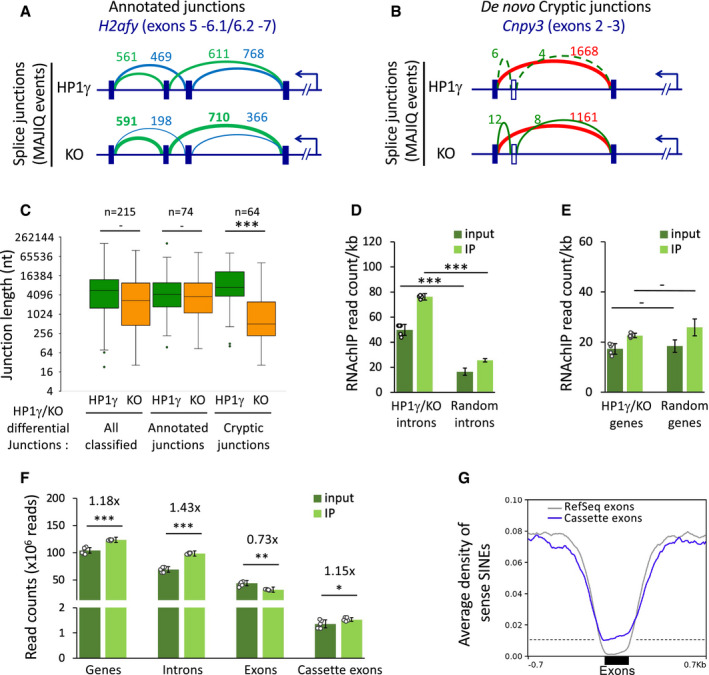
HP1γ‐dependent differential splicing junctions detected by MAJIQ between transcriptomes of HP1γ and KO cells. Top, Schemes of splice junctions showing annotated alternative splicing events (blue and green, panel A), or an annotated exon‐exon junction and de novo cryptic junctions increased in KO (red and green, respectively, panel B).
- C
Box plot depicting the length of exon junctions found differentially regulated by MAJIQ between HP1γ (green) and KO (orange) in three categories as in Fig EV5A, all classified differential HP1γ/KO junctions, annotated alternative exon junctions, non‐annotated de novo cryptic junctions detected in KO only; n, differential events. Box boundaries represent 25th and 75th percentiles; centre line represents median; whiskers indicate ± 1.5 × IQR; points are values of outliers.
- D
RNAchIP read density per kb on the indicated introns for input and IP in samples from both untreated and PMA stimulated cells, n = 6 biological replicates, or 3‐times randomized intervals, n = 18 samples. Dots represent individual data points. HP1γ/KO introns are all 272 intronic intervals between exon junctions differentially detected in HP1γ and KO. “Random introns” are a matching library of random intronic intervals.
- E
RNAchIP read density per kb on the genes corresponding to the introns tested in (D) and analysed as in (D), n = 6 biological replicates, or 3‐times randomized intervals, n = 18 samples.
- F
Reads from input and IP counted on the indicated features in combined unstimulated and PMA stimulated triplicate samples, n = 6 biological replicates. Dots represent individual data points.
- G
Average distribution profiles of sense SINE repeats on indicated exons and on ±0.7kb of surrounding introns.
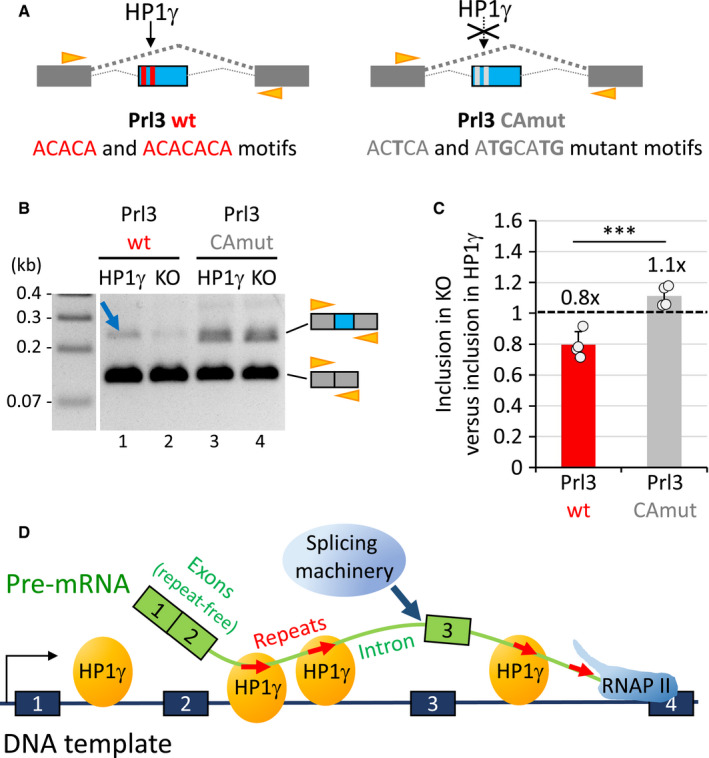
Scheme of the minigene constructs containing the Prl exon and surrounding introns (blue) between human beta globin exons (dark grey), and containing CACACA motifs (red boxes; Prl3 wt) or mutant versions (light grey boxes; Prl3 CAmut). Orange arrowheads, position of the primers used in the assay performed in B.
RT–PCR analysis of the RNAs produced in the splicing assay with the Prl3 wt or Prl3 CAmut constructs as depicted in A transfected into HP1γ or KO cell lines. The top 210bp and bottom 120bp amplicons correspond to the included form (beta globin with Prl exon, more included in lane1, blue arrow, compared to lane 2),and the skipped form (beta globin exons only) of RNA, respectively. Orange arrowheads, position of the HBGEX‐F and HBGEX‐R primers used in PCR analysis.
Histogram showing the loss of inclusion of the Prl3 exon upon depletion of HP1γ (in KO) relative to inclusion in the presence of HP1γ with the Prl3 wt (red) or Prl3 CA mut (grey) reporters. Based on the quantitation of 4 experiments as the one depicted in B. Values represent the fold change relative to HP1γ as a reference (dashed line). Graph represents mean and SD (***P < 0.001; two‐tailed Student’s t‐test; n = 4).
Model of HP1γ‐dependent impact on splicing events via its binding to repeated intronic hexameric motifs (red arrows).
References
-
- Alló M, Buggiano V, Fededa JP, Petrillo E, Schor I, de la Mata M, Agirre E, Plass M, Eyras E, Elela SAet al (2009) Control of alternative splicing through siRNA‐mediated transcriptional gene silencing. Nat Struct Mol Biol 16: 717–724 - PubMed
-
- Almouzni G, Probst AV (2011) Heterochromatin maintenance and establishment: lessons from the mouse pericentromere. Nucleus 2: 332–338 - PubMed
-
- Ameyar‐Zazoua M, Rachez C, Souidi M, Robin P, Fritsch L, Young R, Morozova N, Fenouil R, Descostes N, Andrau J‐Cet al (2012) Argonaute proteins couple chromatin silencing to alternative splicing. Nat Struct Mol Biol 19: 998–1004 - PubMed
-
- Bannister AJ, Zegerman P, Partridge JF, Miska EA, Thomas JO, Allshire RC, Kouzarides T (2001) Selective recognition of methylated lysine 9 on histone H3 by the HP1 chromo domain. Nature 410: 120–124 - PubMed
Publication types
MeSH terms
Substances
LinkOut - more resources
Full Text Sources
Molecular Biology Databases
Research Materials
Miscellaneous
