Comment
. 2021 Nov;301(2):E396-E405.
doi: 10.1148/radiol.2021210834. Epub 2021 Jul 27.

Post-Acute Sequelae of COVID-19 Pneumonia: Six-month Chest CT Follow-up

Affiliations
Comment

Post-Acute Sequelae of COVID-19 Pneumonia: Six-month Chest CT Follow-up

Damiano Caruso et al. Radiology. 2021 Nov.

Abstract

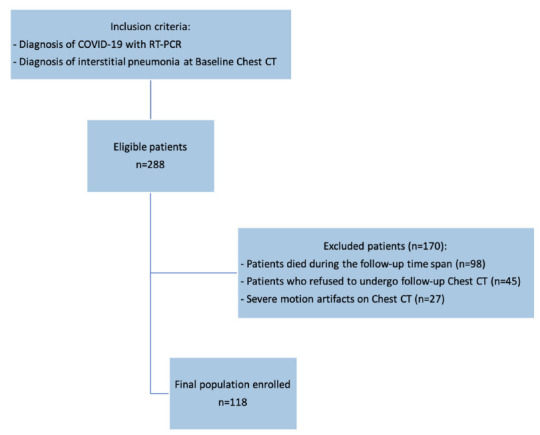
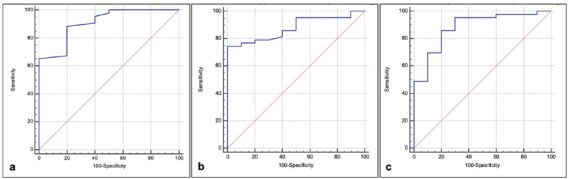
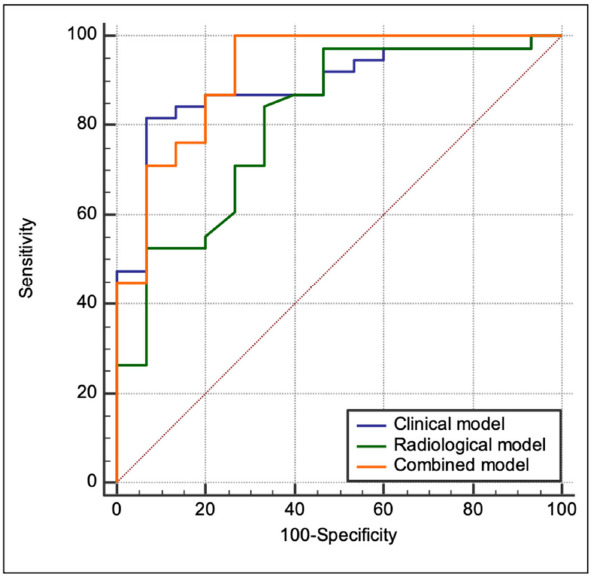
Background The long-term post-acute pulmonary sequelae of COVID-19 remain unknown. Purpose To evaluate lung injury in patients affected by COVID-19 pneumonia at the 6-month follow-up CT examination compared with the baseline chest CT examination. Materials and Methods From March 19, 2020, to May 24, 2020, patients with moderate to severe COVID-19 pneumonia who had undergone baseline chest CT were prospectively enrolled at their 6-month follow-up. The CT qualitative findings, semiquantitative Lung Severity Score (LSS), and the well-aerated lung volume at quantitative chest CT (QCCT) analysis were analyzed. The performance of the baseline LSS and QCCT findings for predicting fibrosis-like changes (reticular pattern and/or honeycombing) at the 6-month follow-up chest CT examination was tested by using receiver operating characteristic curves. Univariable and multivariable logistic regression analyses were used to test clinical and radiologic features that were predictive of fibrosis-like changes. The multivariable analysis was performed with clinical parameters alone (clinical model), radiologic parameters alone (radiologic model), and the combination of clinical and radiologic parameters (combined model). Results One hundred eighteen patients who had undergone baseline chest CT and agreed to undergo follow-up chest CT at 6 months were included in the study (62 women; mean age, 65 years ± 12 [standard deviation]). At follow-up chest CT, 85 of 118 (72%) patients showed fibrosis-like changes and 49 of 118 (42%) showed ground-glass opacities. The baseline LSS (>14) and QCCT findings (≤3.75 L and ≤80%) showed excellent performance for predicting fibrosis-like changes at follow-up chest CT. In the multivariable analysis, the areas under the curve were 0.89 (95% CI: 0.77, 0.96) for the clinical model, 0.81 (95% CI: 0.68, 0.9) for the radiologic model, and 0.92 (95% CI: 0.81, 0.98) for the combined model. Conclusion At 6-month follow-up chest CT, 72% of patients showed late sequelae, in particular fibrosis-like changes. The baseline Lung Severity Score and the well-aerated lung volume at quantitative chest CT (QCCT) analysis showed excellent performance for predicting fibrosis-like changes at the 6-month chest CT (area under the curve, >0.88). Male sex, cough, lymphocytosis, and the well-aerated lung volume at QCCT analysis were significant predictors of fibrosis-like changes at 6 months, demonstrating an inverse correlation (area under the curve, 0.92). © RSNA, 2021 See also the editorial by Wells and Devaraj in this issue.


Figures

Enrollment flow-chart of the study. From an initial cohort of 288
Patients, 118 patients with both baseline and six-month follow-up Chest CT
were enrolled.
Figure 1.
Enrollment flow-chart of the study. From an initial cohort of 288 Patients, 118 patients with both baseline and six-month follow-up Chest CT were enrolled.
(a) Baseline and (b) six-month follow-up axial thin-section unenhanced
Chest CT scans of 83-year-old man, former smokers, who presented fever,
cough and worsening dyspnea; COVID-19 was confirmed by reverse transcription
polymerase chain reaction (RT-PCR) testing. (a) Baseline scan shows multiple
bilateral and confluent ground-glass opacities with predominantly linear
pattern and peripheral distribution (red arrows). (b) Six-month follow-up
scan shows complete resolution of ground-glass opacities without
fibrotic-like changes.
Figure 2.
(a) Baseline and (b) six-month follow-up axial thin-section unenhanced Chest CT scans of 83-year-old man, former smokers, who presented fever, cough and worsening dyspnea; COVID-19 was confirmed by reverse transcription polymerase chain reaction (RT-PCR) testing. (a) Baseline scan shows multiple bilateral and confluent ground-glass opacities with predominantly linear pattern and peripheral distribution (red arrows). (b) Six-month follow-up scan shows complete resolution of ground-glass opacities without fibrotic-like changes.
(a,b) Baseline and (c,d) six-month follow-up axial thin-section
unenhanced Chest CT scans of 84-year-old man, smoker, admitted to the
Emergency Department presenting fever and cough; COVID-19 was confirmed by
reverse transcription polymerase chain reaction (RT-PCR) testing. (a,b)
Images show bilateral consolidative pulmonary opacities (black arrow) with
diffuse ground-glass opacities and interstitial septal thickening (red
arrow). (c,d) Six-month follow-up scans show residual ground-glass opacities
with decreased density compared to baseline, interstitial septal thickening
and peripheral fibrotic-like changes (white arrows).
Figure 3.
(a,b) Baseline and (c,d) six-month follow-up axial thin-section unenhanced Chest CT scans of 84-year-old man, smoker, admitted to the Emergency Department presenting fever and cough; COVID-19 was confirmed by reverse transcription polymerase chain reaction (RT-PCR) testing. (a,b) Images show bilateral consolidative pulmonary opacities (black arrow) with diffuse ground-glass opacities and interstitial septal thickening (red arrow). (c,d) Six-month follow-up scans show residual ground-glass opacities with decreased density compared to baseline, interstitial septal thickening and peripheral fibrotic-like changes (white arrows).
(a,b) Baseline and (c,d) six-month follow-up coronal thin-section
unenhanced Chest CT scans of 79-year-old man, admitted to the Emergency
Department presenting fever, dyspnea and cough; COVID-19 was confirmed by
reverse transcription polymerase chain reaction (RT-PCR) testing. (a) Chest
CT scan shows bilateral ground-glass opacities tending to consolidation
(black arrow). (b) The same scan after Quantitative Chest CT Analysis
highlighted in light-blue well-aerated lung (1.5 liters, 50%) and in
yellow pulmonary injury of COVID-19 pneumonia. (c) Six-month follow-up scan
shows residual fibrotic-like changes (white arrows) and persisting of
low-density ground glass (asterisks). (d) The same scan after Quantitative
Chest CT Analysis highlighted in light-blue well-aerated lung (3.5 liters,
82%) and in yellow residual findings of COVID-19 pneumonia at six
months follow-up.
Figure 4.
(a,b) Baseline and (c,d) six-month follow-up coronal thin-section unenhanced Chest CT scans of 79-year-old man, admitted to the Emergency Department presenting fever, dyspnea and cough; COVID-19 was confirmed by reverse transcription polymerase chain reaction (RT-PCR) testing. (a) Chest CT scan shows bilateral ground-glass opacities tending to consolidation (black arrow). (b) The same scan after Quantitative Chest CT Analysis highlighted in light-blue well-aerated lung (1.5 liters, 50%) and in yellow pulmonary injury of COVID-19 pneumonia. (c) Six-month follow-up scan shows residual fibrotic-like changes (white arrows) and persisting of low-density ground glass (asterisks). (d) The same scan after Quantitative Chest CT Analysis highlighted in light-blue well-aerated lung (3.5 liters, 82%) and in yellow residual findings of COVID-19 pneumonia at six months follow-up.
(a) Receiver operating characteristic (ROC) curves tested the
performance of baseline lung severity score to predict fibrotic-like changes
at six-month follow-up Chest CT, showing an area under the curve (AUC) of
.91, 95%CI .8-.97, sensitivity of 88% and specificity of
80% when the cut-off was >14. (b,c) ROC curves tested the
performance of baseline quantitative Chest CT (QCCT) analysis of
well-aerated lung, expressed in percentage (b) and Liters (c) to predict
fibrotic-like changes at six-month follow-up Chest CT: (b) with the cut-off
of ≤3.8L an AUC of .88, 95%CI .77-.96, a sensitivity of
86% and a specificity of 80% was found, (c) the cut-off of
≤80% showed an AUC of .88, 95%CI .76-.95, 74% of
sensitivity and 100% of specificity.
Figure 5.
(a) Receiver operating characteristic (ROC) curves tested the performance of baseline lung severity score to predict fibrotic-like changes at six-month follow-up Chest CT, showing an area under the curve (AUC) of .91, 95%CI .8-.97, sensitivity of 88% and specificity of 80% when the cut-off was >14. (b,c) ROC curves tested the performance of baseline quantitative Chest CT (QCCT) analysis of well-aerated lung, expressed in percentage (b) and Liters (c) to predict fibrotic-like changes at six-month follow-up Chest CT: (b) with the cut-off of ≤3.8L an AUC of .88, 95%CI .77-.96, a sensitivity of 86% and a specificity of 80% was found, (c) the cut-off of ≤80% showed an AUC of .88, 95%CI .76-.95, 74% of sensitivity and 100% of specificity.
Receiver operating characteristic (ROC) curves tested the performance
of clinical (blue line), radiological (green line) and combined model
(orange line) in predicting the presence of fibrotic-like changes at
six-month follow-up Chest CT. The AUC for the clinical model was .89
(95%CI .77-.96, sensitivity: 82%, specificity: 93%),
.81 for radiological model (95%CI .68-.9, sensitivity: 84%,
specificity: 67%,) and .92 for combined model (95%CI .81-.97,
sensitivity: 100%, specificity: 73%).
Figure 6.
Receiver operating characteristic (ROC) curves tested the performance of clinical (blue line), radiological (green line) and combined model (orange line) in predicting the presence of fibrotic-like changes at six-month follow-up Chest CT. The AUC for the clinical model was .89 (95%CI .77-.96, sensitivity: 82%, specificity: 93%), .81 for radiological model (95%CI .68-.9, sensitivity: 84%, specificity: 67%,) and .92 for combined model (95%CI .81-.97, sensitivity: 100%, specificity: 73%).

Comment in

Comment on

References

    1. Naming the coronavirus disease (COVID-19) and the virus that causes it. 2020. https://www.who.int/emergencies/diseases/novel-coronavirus-2019/technica.... Published 2020.
    1. Caruso D, Zerunian M, Polici M, Pucciarelli F, Polidori T, Rucci C, Guido G, Bracci B, De Dominicis C, Laghi A. Chest CT Features of COVID-19 in Rome, Italy. Radiology 2020;296(2):E79–e85. 10.1148/radiol.2020201237 - DOI - PMC - PubMed
    1. Huang L, Han R, Ai T, Yu P, Kang H, Tao Q, Xia L. Serial quantitative chest ct assessment of covid-19: Deep-learning approach. Radiology: Cardiothoracic Imaging 2020;2(2):e200075. - PMC - PubMed
    1. Caruso D, Polici M, Zerunian M, Pucciarelli F, Polidori T, Guido G, Rucci C, Bracci B, Muscogiuri E, De Dominicis C, Laghi A. Quantitative Chest CT analysis in discriminating COVID-19 from non-COVID-19 patients. Radiol Med 2020. 10.1007/s11547-020-01291-y - DOI - PMC - PubMed
    1. Shen C, Yu N, Cai S, Zhou J, Sheng J, Liu K, Zhou H, Guo Y, Niu G. Quantitative computed tomography analysis for stratifying the severity of Coronavirus Disease 2019. J Pharm Anal 2020;10(2):123–129. 10.1016/j.jpha.2020.03.004 - DOI - PMC - PubMed