

Adjustment for energy intake in nutritional research: a causal inference perspective
- PMID: 34313676
- PMCID: PMC8755101
- DOI: 10.1093/ajcn/nqab266
Adjustment for energy intake in nutritional research: a causal inference perspective
Abstract
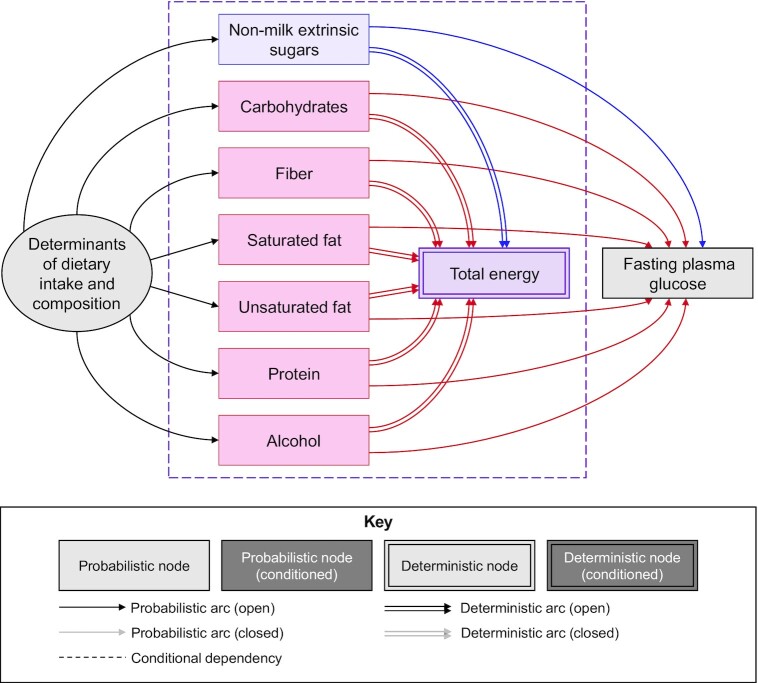
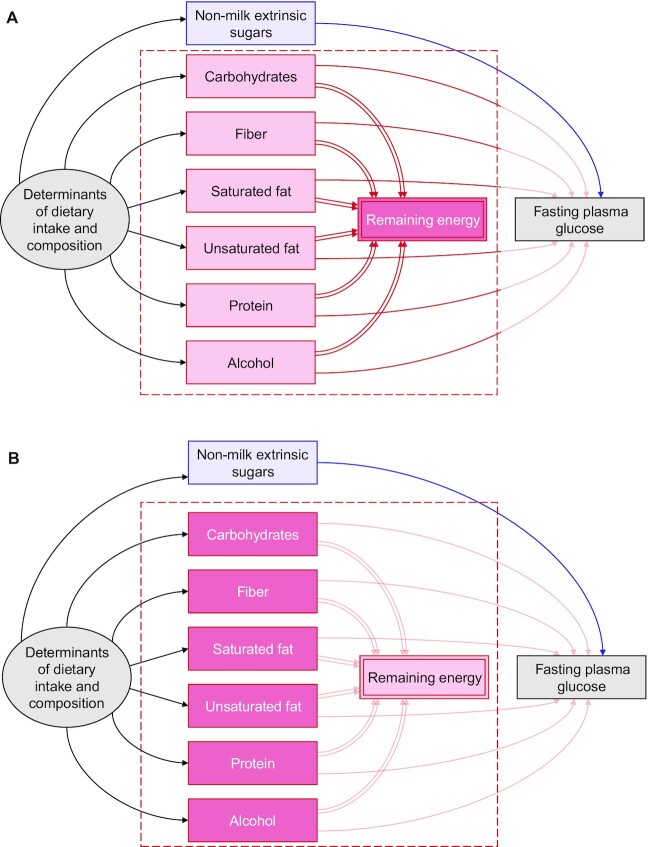
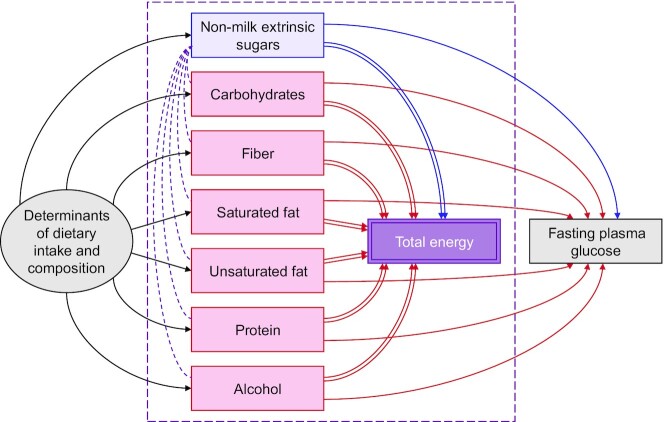
Background: Four models are commonly used to adjust for energy intake when estimating the causal effect of a dietary component on an outcome: 1) the "standard model" adjusts for total energy intake, 2) the "energy partition model" adjusts for remaining energy intake, 3) the "nutrient density model" rescales the exposure as a proportion of total energy, and 4) the "residual model" indirectly adjusts for total energy by using a residual. It remains underappreciated that each approach evaluates a different estimand and only partially accounts for confounding by common dietary causes.
Objectives: We aimed to clarify the implied causal estimand and interpretation of each model and evaluate their performance in reducing dietary confounding.
Methods: Semiparametric directed acyclic graphs and Monte Carlo simulations were used to identify the estimands and interpretations implied by each model and explore their performance in the absence or presence of dietary confounding.
Results: The "standard model" and the mathematically identical "residual model" estimate the average relative causal effect (i.e., a "substitution" effect) but provide biased estimates even in the absence of confounding. The "energy partition model" estimates the total causal effect but only provides unbiased estimates in the absence of confounding or when all other nutrients have equal effects on the outcome. The "nutrient density model" has an obscure interpretation but attempts to estimate the average relative causal effect rescaled as a proportion of total energy. Accurate estimates of both the total and average relative causal effects may instead be derived by simultaneously adjusting for all dietary components, an approach we term the "all-components model."
Conclusions: Lack of awareness of the estimand differences and accuracy of the 4 modeling approaches may explain some of the apparent heterogeneity among existing nutritional studies. This raises serious questions regarding the validity of meta-analyses where different estimands have been inappropriately pooled.
Keywords: causal inference; compositional data; directed acyclic graphs; estimand; nutritional epidemiology.
© The Author(s) 2021. Published by Oxford University Press on behalf of the American Society for Nutrition.
Figures
Comment in
-
Well-defined interventions for nutritional studies: from target trials to nutritional modeling.Am J Clin Nutr. 2022 Jan 11;115(1):3-5. doi: 10.1093/ajcn/nqab343. Am J Clin Nutr. 2022. PMID: 34849525 No abstract available.
-
Re: Adjustment for energy intake in nutritional research: a causal inference perspective.Am J Clin Nutr. 2022 Aug 4;116(2):608-609. doi: 10.1093/ajcn/nqac114. Am J Clin Nutr. 2022. PMID: 35482596 No abstract available.
References
Publication types
MeSH terms
LinkOut - more resources
Full Text Sources
