. 2021 Sep 6;218(9):e20210409.
doi: 10.1084/jem.20210409. Epub 2021 Jul 27.

Marginating transitional B cells modulate neutrophils in the lung during inflammation and pneumonia

Affiliations

Marginating transitional B cells modulate neutrophils in the lung during inflammation and pneumonia

John Podstawka et al. J Exp Med. .

Abstract

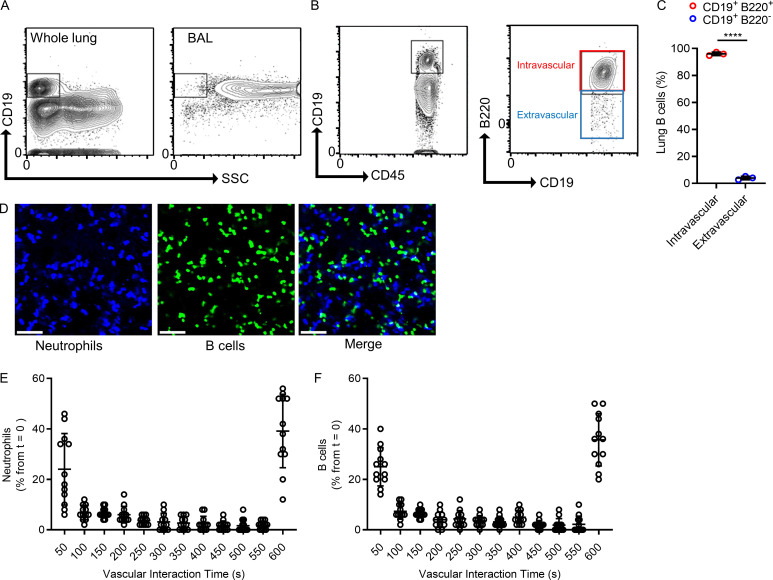
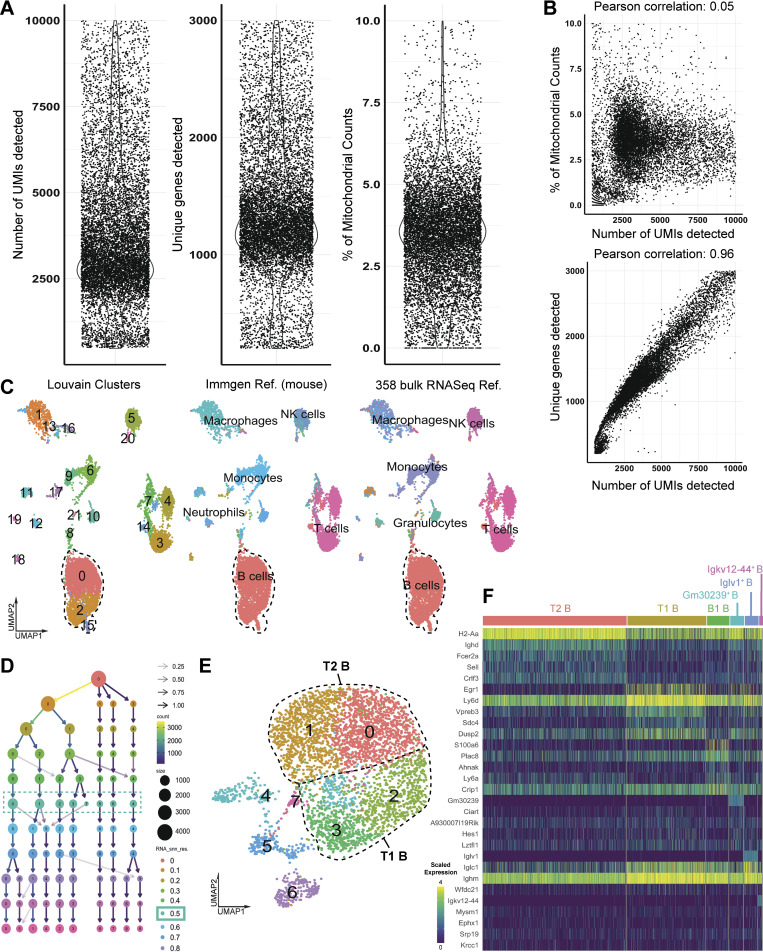
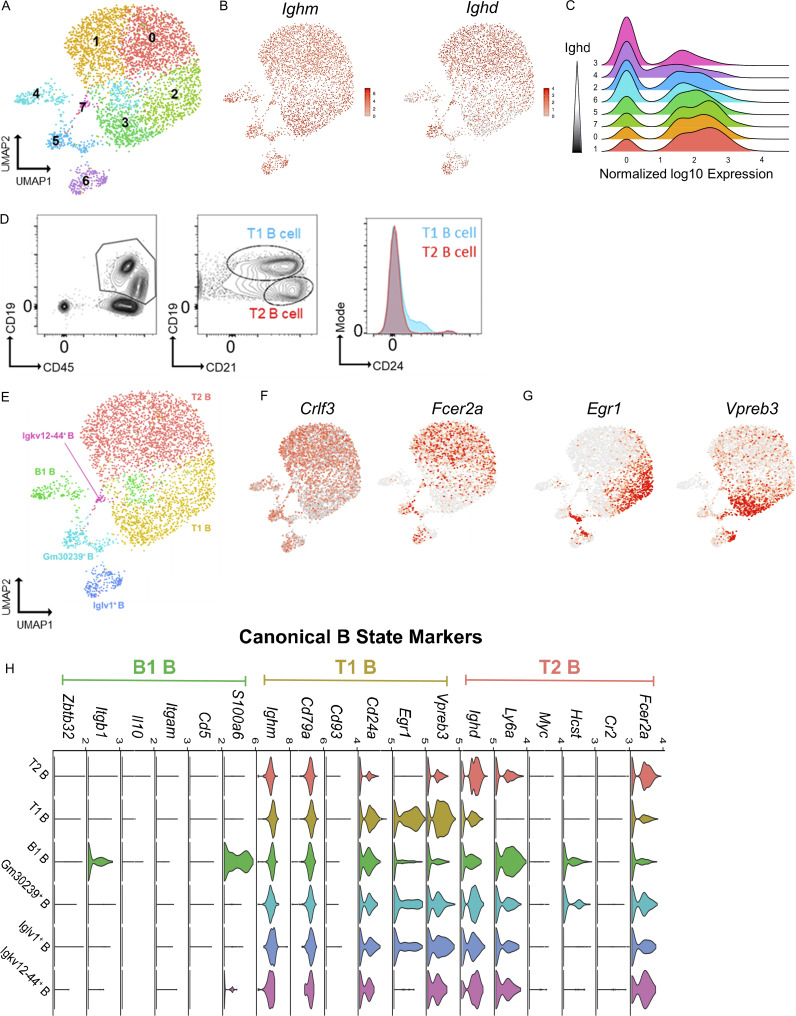
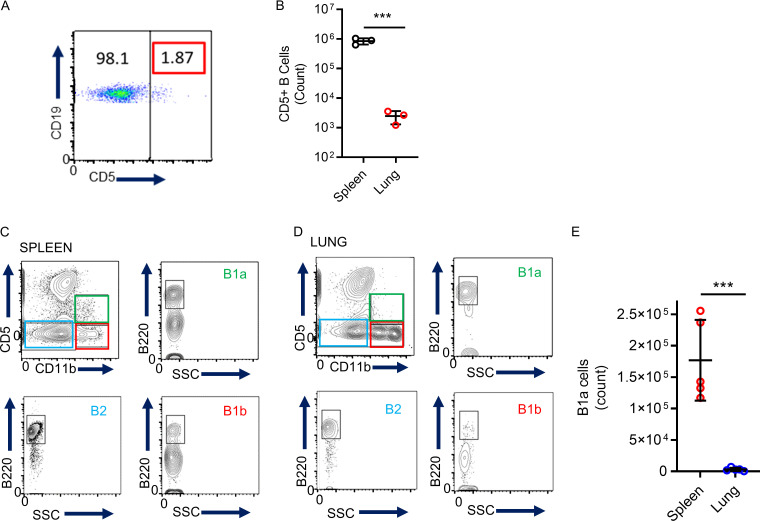
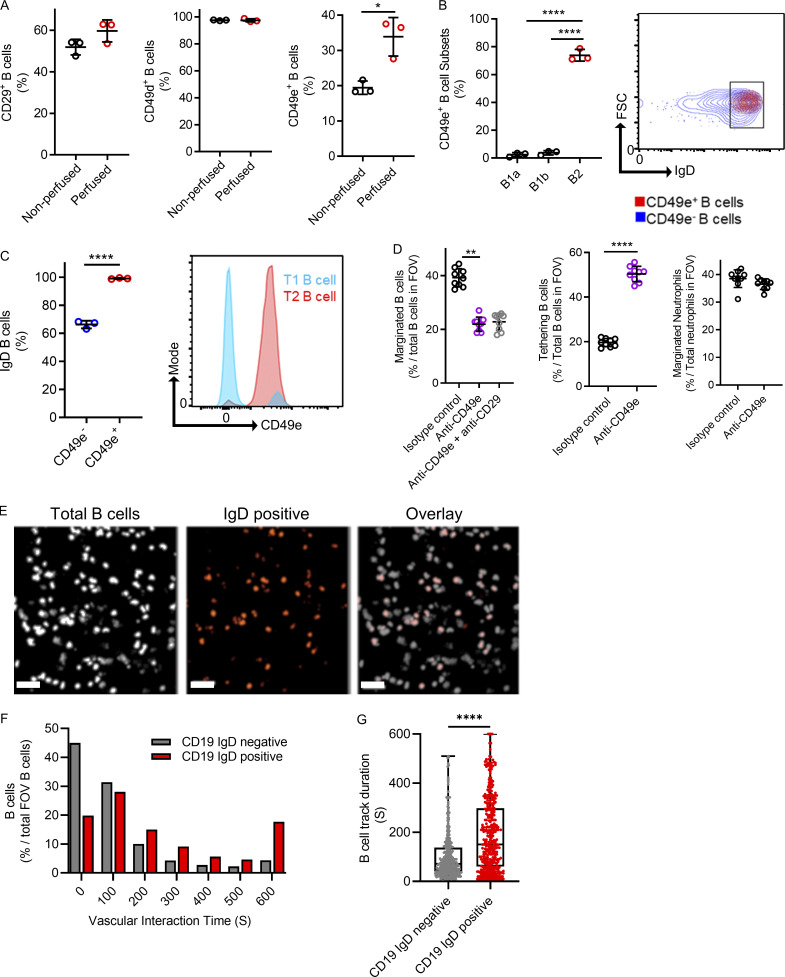
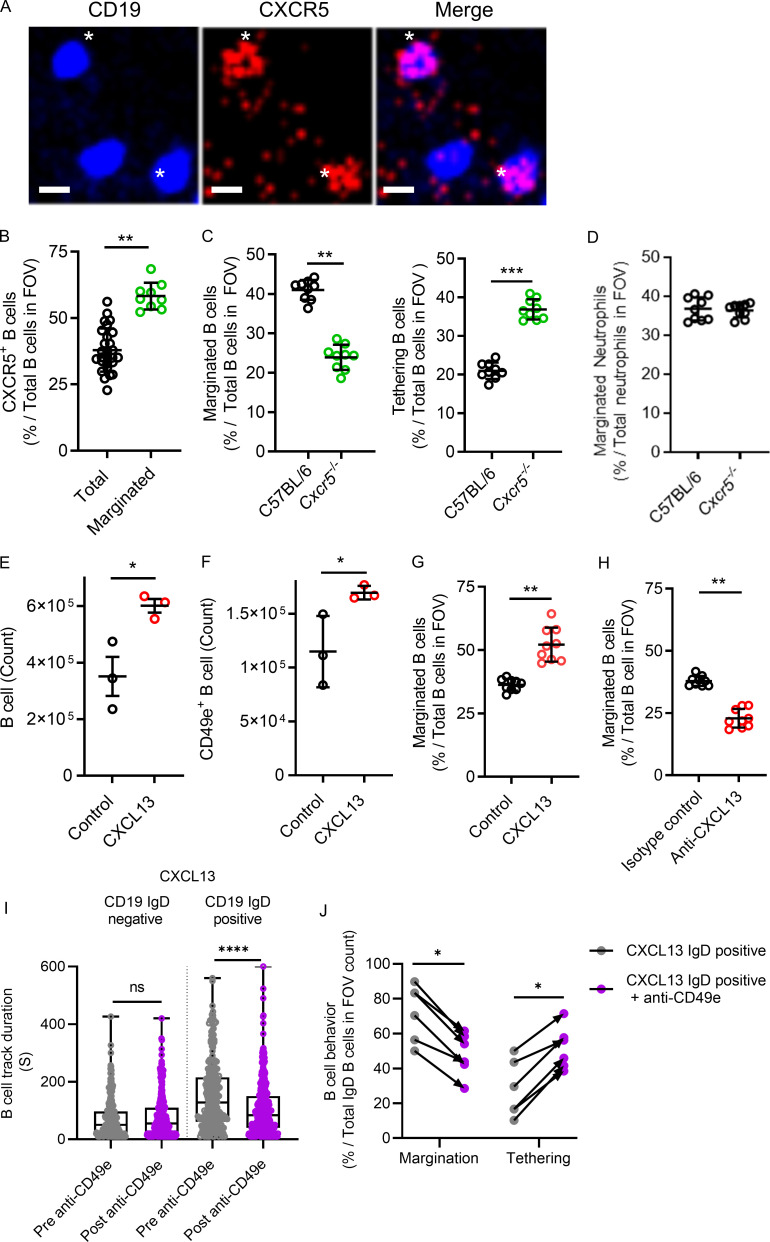
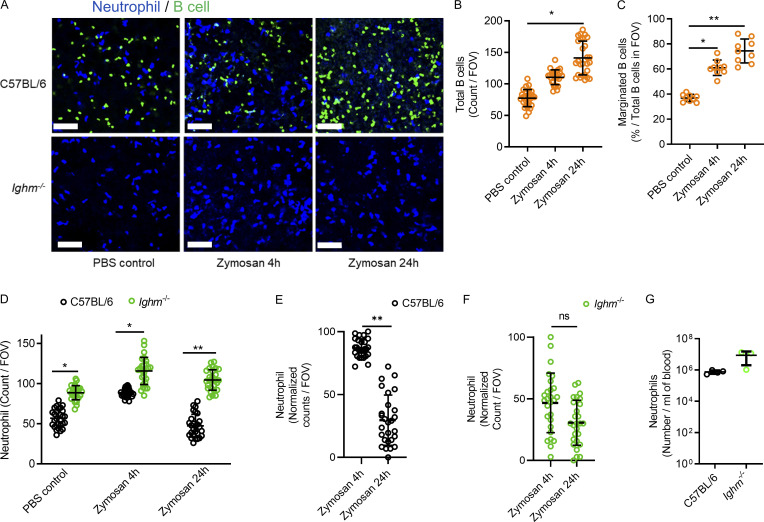
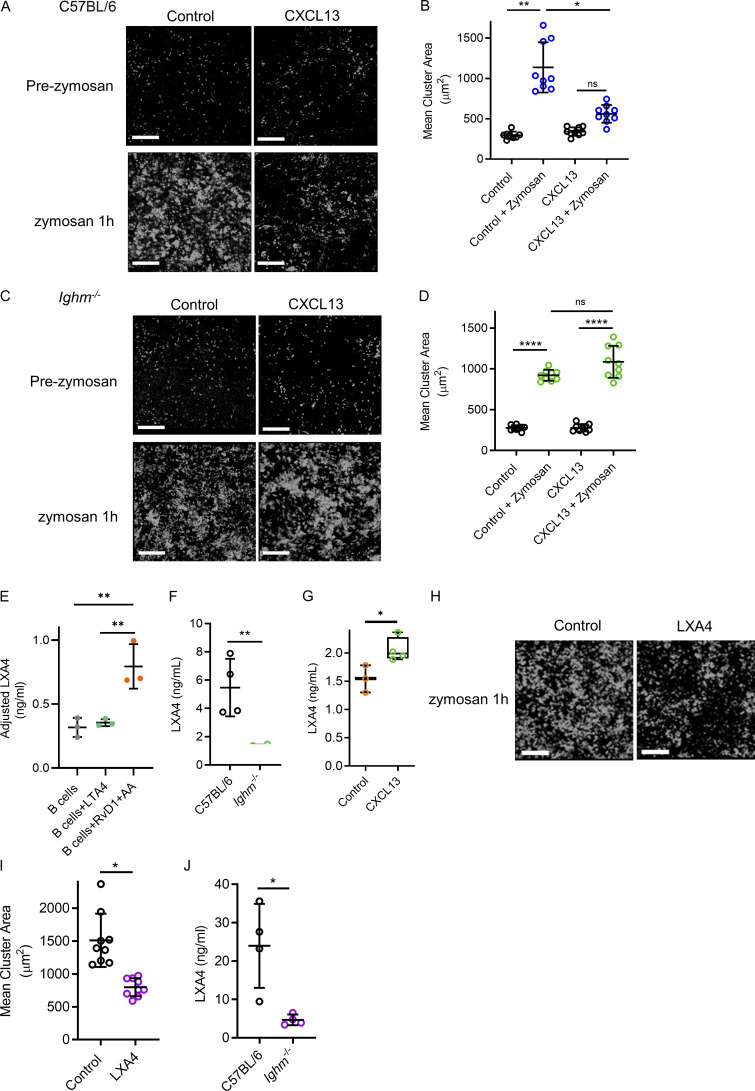
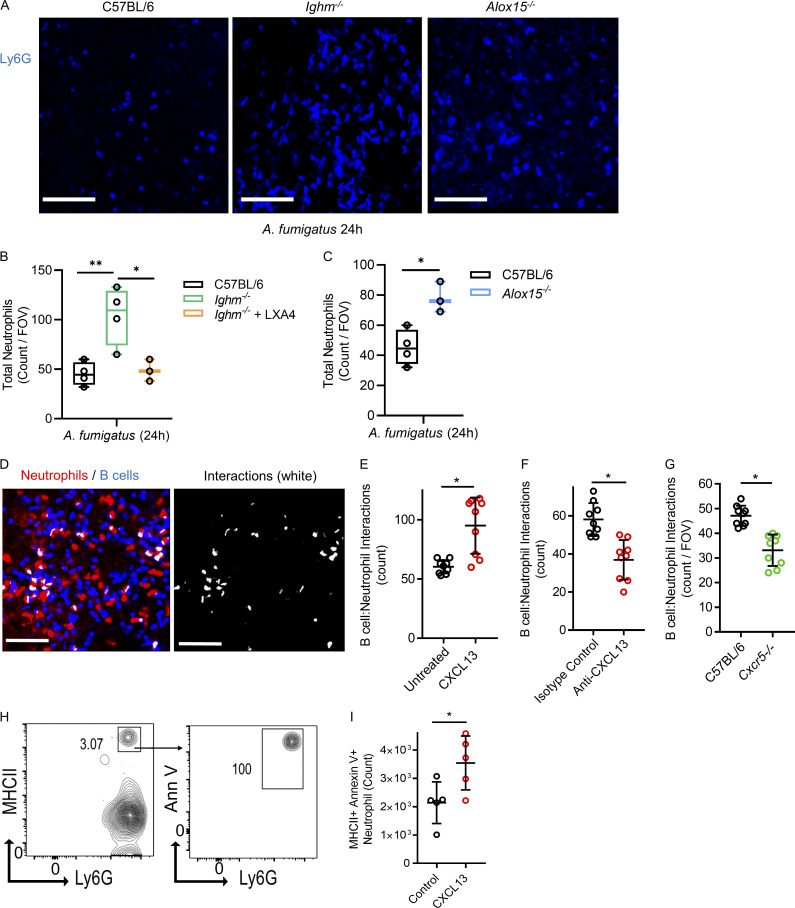
Pulmonary innate immunity is required for host defense; however, excessive neutrophil inflammation can cause life-threatening acute lung injury. B lymphocytes can be regulatory, yet little is known about peripheral transitional IgM+ B cells in terms of regulatory properties. Using single-cell RNA sequencing, we discovered eight IgM+ B cell subsets with unique gene regulatory networks in the lung circulation dominated by transitional type 1 B and type 2 B (T2B) cells. Lung intravital confocal microscopy revealed that T2B cells marginate in the pulmonary capillaries via CD49e and require CXCL13 and CXCR5. During lung inflammation, marginated T2B cells dampened excessive neutrophil vascular inflammation via the specialized proresolving molecule lipoxin A4 (LXA4). Exogenous CXCL13 dampened excessive neutrophilic inflammation by increasing marginated B cells, and LXA4 recapitulated neutrophil regulation in B cell-deficient mice during inflammation and fungal pneumonia. Thus, the lung microvasculature is enriched in multiple IgM+ B cell subsets with marginating capillary T2B cells that dampen neutrophil responses.


Conflict of interest statement

Disclosures: The authors declare no competing interests exist.

Figures

Figure 1.
Figure 1.
The lung capillaries contain marginated intravascular B cells. (A) Flow cytometry compared B cells (fluorescently conjugated anti-CD19 mAb) within a whole-lung homogenate with BAL fluid. SSC, side scatter. (B and C) Representative flow cytometry and quantification of intravascular (CD19+/B220+) versus extravascular (CD19+/B220) B cells using a two-antibody staining technique (A–C, n = 3 independent experiments with six mice total). (D) Lung intravital microscopy visualized both intravascular neutrophils (fluorescently conjugated anti-Ly6G mAb) and B cells (Cd19ZsGreen1). Scale bar, 70 µm. (E and F) The transit times of neutrophils and B cells were quantified using intravital microscopy. Marginated cells were observed in the FOV for up to 600 s. Cells at time point 0 were followed for their duration in the lung vasculature and expressed as a percentage of the initial total B cell numbers in each FOV (D–F, n = 4 independent experiments using four mice total; each dot represents one FOV). Pooled data are presented as mean ± SD. Exact P values were determined using Student’s t test. ****, P < 0.0001.
Figure S1.
Figure S1.
scRNAseq quality control metrics and B cell annotations.(A) Unique molecular identifier (UMI), unique gene, and mitochondrial counts for each individual cell. (B) Pearson correlation of UMI counts with percentage of mitochondrial genes and number of unique genes detected for each individual cell. (C) Automated annotations of all Cd45+ immune cells using established SingleR databases (mouse RNAseq and ImmGen) confirmed the B cell identity of outlined clusters. NK, natural killer. (D) Subclustering of B cells was performed over a range of resolutions from 0 to 0.8 in steps of 0.1 to determine an optimal clustering resolution. (E) UMAP plot revealing eight distinct B cell clusters (at resolution 0.5). (F) Heatmap of the top five marker genes (determined by nonparametric Wilcoxon rank-sum test) for each of the six B cell states described in Fig. 2.
Figure 2.
Figure 2.
scRNAseq reveals distinct B cell states within the lung. (A) B cells were analyzed using scRNAseq, and unsupervised clustering was achieved using a hierarchical tree algorithm using Seurat’s Louvain algorithm and visualized by UMAP. (B) Comparison of Ighm and Ighd transcripts across all B cells. (C) Ridge plots of Ighd transcripts between clusters 0 and 7. (D) Flow cytometry of lungs demonstrates two main B cell subtypes, T1B and T2B, using fluorescently conjugated mAbs to detect cell surface expression of CD45, CD19, CD21, and CD24. Data represent n = 3 independent experiments using three mice total. (E) Reclustering of B cells to map T1B and T2B cell states. (F and G) Relative RNA expression of representative genes associated with B cell states, including Crlf3, Fcer2a (T2), and Egr1 and Vpreb3 (T1). (H) Violin plots of RNA transcripts grouped by B cell states. For scRNAseq data in A–C and E–H, 4,044 B cells were from seven pooled mice, and sequencing was performed once.
Figure S2.
Figure S2.
Characterizing B cell subsets in the lung. (A and B) Flow cytometry was used to analyze lung CD5+ B cells (A) and to compare the quantitative counts (B) between spleen and lung (unpaired Student’s t test, n = 3 independent experiments using three mice in total). (C–E) Flow cytometry was used to identify B1a, B1b, and B2 B cell subsets in the spleen (C) and lung (D) and to compare the two organs (E). Unpaired Student’s t test; n = 5 independent experiments using five mice in total. Data is mean ± SD. SSC, side scatter. ***, P < 0.001.
Figure 3.
Figure 3.
T1B, T2B, and B1 cells occupy distinct regulatory states. (A) GRN-based clustering color coded by B cell state and projected on a t-distributed stochastic neighbor embedding (t-SNE) map reveals that T1B, T2B, and B1 have distinct regulatory network structures. (B) GRN density projected onto SCENIC t-SNE map. (C) Rank-ordered regulon specificity scores for transcriptionally defined B cell states. (D–F) t-SNE map plotting gene expression (yellow), binarized regulon activity (active, blue; inactive, gray), and kernel density line area under the curve (AUC) histogram plotting inferred transcription factor (TF) activation. Examples of differentially active GRNs in T1B (D), T2B (E), and B1 (F) states.
Figure 4.
Figure 4.
Marginated B cells are marked by CD49e, which mediates endothelial interactions. (A) Flow cytometry compared cell surface molecule expression on B cells obtained from nonperfused lungs (circulating blood remaining) with perfused lungs (circulating blood removed). (B) Flow cytometry expression of CD49e using a fluorescently conjugated anti-CD49e mAb. B cells were pregated for prototypical B1a, B1b, and B2 markers, and the percentage of CD49e-positive B cells is shown per group. FSC, forward scatter. (C) The expression of cell surface IgD was assessed by flow cytometry and compared between CD49e-positive B cells versus CD49e-negative B cells (A–C, n = 3 independent experiments using a total of six mice). (D) Intravital microscopy was used to visualize vascular B cells in mice treated i.v. with an inhibitory anti-CD49e mAb with or without an inhibitory anti-CD29 antibody compared with an appropriate isotype mAb control (pooled FOV replicates shown for n = 3 independent experiments using nine mice in total). (E) Intravital microscopy was performed with Cd19ZsGreen1 and costained for IgD-positive B cells. Scale bar, 50 µm. (F and G) Vascular interaction times and track duration are shown as frequency distributions and pooled together to compare IgD-negative and IgD-positive B cells (n = 3 independent experiments with three mice in total). Exact P values were determined using Student’s t test or ANOVA. *, P < 0.05; **, P < 0.01; ****, P < 0.0001. Pooled data are presented as mean ± SD or box-and-whisker plots showing median and interquartile range.
Figure 5.
Figure 5.
The CXCR5–CXCL13 axis modulates the level of B cell margination in the lung. (A) Intravital lung microscopy revealed B cells (Cd19ZsGreen1) that were visible for CXCR5 using i.v. administered, fluorescently conjugated anti-CXCR5 mAb and that were marginated. For clarity, B cells were falsely colored blue, and CXCR5 is red. Asterisks show two examples of CXCR5-positive B cells (representative images from n = 3 independent experiments using three mice; scale bars, 7 µm). (B) CXCR5+ B cells were compared with total B cells, as was the proportion of CXCR5+ B cells that marginated compared with total B cells observed in the FOV. (C and D) Intravital lung microscopy compared B cell margination and tethering in C57BL/6 versus Cxcr5−/− mice (C), while D shows marginated neutrophils. (E and F) Cd19Zsgreen1 mice were pretreated with exogenous CXCL13 i.t., and flow cytometry quantified total and CD49e+ lung B cells. (G and H) Intravital lung microscopy quantified B cell margination in purified CXCL13-pretreated Cd19Zsgreen1 mice or in Cd19Zsgreen1 mice that received systemic pretreatment with an isotype control antibody versus a neutralizing anti-CXCL13 mAb. (I) CXCL13 i.t. treated Cd19ZsGreen1 mice were costained for IgD, and B cells were quantified by track duration before and after administration of inhibitory anti-CD49e antibodies. (J) B cells were phenotyped for margination and tethering before and after anti-CD49e antibody administration. For imaging experiments, n = 3 individual experiments were performed. Pooled FOV replicates are shown for B–D, G, and H. I and J represent n = 3 independent experiments using six mice in total. Exact P values were determined using Student’s t test, except where groups were compared using the Mann-Whitney test. *, P < 0.05; **, P < 0.01; ***, P < 0.001; ****, P < 0.0001. Pooled data are presented as the mean of n values ± SD or as box-and-whisker plots showing median and interquartile range. Statistical testing was performed using the n values.
Figure 6.
Figure 6.
Marginated B cells increase during direct zymosan-induced lung injury and restrain excessive neutrophil recruitment.(A) Lung intravital microscopy was performed on either C57BL/6 or Ighm−/− mice that were treated with PBS i.t. as a control or with 106 zymosan-coated beads i.t. Neutrophils and B cells were visualized using i.v. fluorescently conjugated anti-Ly6G mAb and fluorescently conjugated anti-CD19 mAb. Scale bar, 70 µm. (B and C) Total visualized B cells and marginated B cells were quantified in C57BL/6 mice, and no B cells were visualized in Ighm−/− mice. (D–F) Neutrophils were quantified and compared between mice that received PBS control or 4 h or 24 h of zymosan i.t. (G) Peripheral blood neutrophil counts were compared. For A–G, n = 3 independent experiments using nine mice in total. All individual imaging FOV replicates are shown for B–F. B and C were analyzed using one-way ANOVA and Tukey’s post hoc test. D–G were analyzed using Student’s t test based on n. Pooled data are presented as mean of n ± SD. *, P < 0.05; **, P < 0.01.
Figure 7.
Figure 7.
Manipulating the effects of marginated B cells restrains excessive neutrophilic inflammation in a model of systemic inflammation induced lung injury. (A and B) Lung intravital microscopy quantified neutrophil inflammation and cluster formation in control versus CXCL13 i.t. treated C57BL/6 mice before and after i.v. administration of zymosan-coated beads. Neutrophils (i.v. fluorescently conjugated anti-Ly6G mAb) and neutrophil clusters have been falsely colored white. Scale bars, 200 µm. (C and D) Neutrophil cluster formation and surface area were assessed using lung intravital microscopy in B cell–deficient mice (Ighm−/−) treated with or without exogenous CXCL13 i.t. before and after zymosan-coated bead administration. For A–D, n = 3 independent experiments using 12 mice in total; pooled FOV replicates are shown. Exact P values were calculated using one-way ANOVA with Tukey’s post hoc test. Scale bars, 200 µm. (E) Isolated B cells were cultured, and supernatants were tested for LXA4 levels using ELISA. Adjusted levels were determined by subtracting the control wells without B cells added. n = 3 independent experiments using nine mice total. Exact P values were determined using Student’s t test. (F and G) ELISA quantified LXA4 levels in lung homogenates for C57BL/6 and Ighm−/− mice (F) and mice treated with CXCL13 (G). n = 4 independent experiments using eight mice total. Exact P values were determined using Student’s t test. (H and I) Intravital lung microscopy quantified cluster formation in mice receiving zymosan-coated beads i.v. alone or with i.v. LXA4. Neutrophil clusters have been falsely colored white. Scale bar, 200 µm. Pooled FOV replicates are shown for n = 3 independent experiments using six mice total. Exact P values were determined using Student’s t test. (J) ELISA quantified LXA4 levels in lung homogenates for C57BL/6 and Ighm−/− mice 1 h after administration of i.v. zymosan-coated beads. n = 4 independent experiments using eight mice total. Exact P values were determined using Student’s t test. Pooled data are presented as mean ± SD. *, P < 0.05; **, P < 0.01; ****, P < 0.0001.
Figure 8.
Figure 8.
B cell regulation of lung neutrophils during fungal pneumonia. (A–C) Lung intravital microscopy was performed in mice infected with A. fumigatus (24 h), and neutrophils were imaged and quantified. Scale bars, 100 µm. (B) C57BL/6 mice were compared with Ighm−/− mice with and without LXA4 administration (5 µg i.v. at the time of infection). (C) C57BL/6 mice were compared with Alox15−/− mice. A–C represent 3–4 independent experiments using 14 total mice. (D) Neutrophil (i.v. fluorescently conjugated anti-Ly6G mAb, red) and B cell (Cd19Zsgreen1, blue) physical interactions were observed using lung intravital microscopy and highlighted as colocalization (white in the right panel). Scale bars, 70 µm. (E) Untreated Cd19Zsgreen1 mice were compared with CXCL13 i.t. pretreated mice. (F and G) B cell neutrophil interactions were quantified and compared between Cd19Zsgreen1 mice treated with i.v. isotype control antibody versus a neutralizing anti-CXCL13 mAb (F) or between C57BL/6 versus Cxcr5−/− mice (G). (H) The acquisition of MHCII from B cells to neutrophils and the initiation of neutrophil apoptosis using annexin V staining was evaluated using flow cytometry. (I) MHCII+ annexin V+ lung neutrophils were quantified by flow cytometry and compared between control and exogenous CXCL13 i.t. treated mice. For imaging experiments, D–G pooled FOV replicates are shown, and n = 3 independent experiments were performed per condition using a total of 18 mice. In H and I, n = 5 independent experiments using 10 mice in total. Exact P values were determined using Student’s t test to compare two groups or ANOVA to compare three groups. Pooled data are presented as mean ± SD. *, P < 0.05; **, P < 0.01.

Comment in

References

    1. Aibar, S., González-Blas C.B., Moerman T., Huynh-Thu V.A., Imrichova H., Hulselmans G., Rambow F., Marine J.C., Geurts P., Aerts J., et al. . 2017. SCENIC: single-cell regulatory network inference and clustering. Nat. Methods. 14:1083–1086. 10.1038/nmeth.4463 - DOI - PMC - PubMed
    1. Ansel, K.M., Ngo V.N., Hyman P.L., Luther S.A., Förster R., Sedgwick J.D., Browning J.L., Lipp M., and Cyster J.G.. 2000. A chemokine-driven positive feedback loop organizes lymphoid follicles. Nature. 406:309–314. 10.1038/35018581 - DOI - PubMed
    1. Ansel, K.M., Harris R.B.S., and Cyster J.G.. 2002. CXCL13 is required for B1 cell homing, natural antibody production, and body cavity immunity. Immunity. 16:67–76. 10.1016/S1074-7613(01)00257-6 - DOI - PubMed
    1. Barletta, K.E., Cagnina R.E., Wallace K.L., Ramos S.I., Mehrad B., and Linden J.. 2012. Leukocyte compartments in the mouse lung: distinguishing between marginated, interstitial, and alveolar cells in response to injury. J. Immunol. Methods. 375:100–110. 10.1016/j.jim.2011.09.013 - DOI - PMC - PubMed
    1. Barnes, B.J., Adrover J.M., Baxter-Stoltzfus A., Borczuk A., Cools-Lartigue J., Crawford J.M., Daßler-Plenker J., Guerci P., Huynh C., Knight J.S., et al. . 2020. Targeting potential drivers of COVID-19: Neutrophil extracellular traps. J. Exp. Med. 217:e20200652. 10.1084/jem.20200652 - DOI - PMC - PubMed

Publication types

MeSH terms

Grants and funding