. 2021 Sep 7;49(15):8471-8487.
doi: 10.1093/nar/gkab624.

VarSAn: associating pathways with a set of genomic variants using network analysis

Affiliations

VarSAn: associating pathways with a set of genomic variants using network analysis

Xiaoman Xie et al. Nucleic Acids Res. .

Abstract

There is a pressing need today to mechanistically interpret sets of genomic variants associated with diseases. Here we present a tool called 'VarSAn' that uses a network analysis algorithm to identify pathways relevant to a given set of variants. VarSAn analyzes a configurable network whose nodes represent variants, genes and pathways, using a Random Walk with Restarts algorithm to rank pathways for relevance to the given variants, and reports P-values for pathway relevance. It treats non-coding and coding variants differently, properly accounts for the number of pathways impacted by each variant and identifies relevant pathways even if many variants do not directly impact genes of the pathway. We use VarSAn to identify pathways relevant to variants related to cancer and several other diseases, as well as drug response variation. We find VarSAn's pathway ranking to be complementary to the standard approach of enrichment tests on genes related to the query set. We adopt a novel benchmarking strategy to quantify its advantage over this baseline approach. Finally, we use VarSAn to discover key pathways, including the VEGFA-VEGFR2 pathway, related to de novo variants in patients of Hypoplastic Left Heart Syndrome, a rare and severe congenital heart defect.


Figures

Figure 1.
Figure 1.
(A) Workflow of variant set characterization by VarSAn. A network is defined with SNP nodes, gene nodes and pathway nodes. SNP and gene nodes are connected by edges representing biological evidence of their relationship, e.g. the SNP is predicted to impact the gene's encoded protein or the gene's expression (eQTL). Gene nodes are connected to pathway nodes to indicate genes that belong to a pathway. Gene-gene edges are optional and may represent various types of relationships, e.g., protein-protein interactions. A subset of SNPs, to be characterized, is designated as the ‘query set’ and a Random Walk with Restarts (RWR) algorithm is used, with this query set as its ‘restart set’, to identify relevant pathways. (B) Empirical P-values reflect the relevance of pathways to the query set of SNPs. Each pathway is assigned an ‘equilibrium probability’ by the RWR algorithm, run with the query set as the restart set. The process is repeated many times, using different random sets of SNPs as the query set, and the equilibrium probability of a pathway from the original RWR is compared to corresponding values with the random query sets to assign an empirical P-value to the pathway. (C) Assignment of SNP-gene edges in the network in pan-tissue eQTL mode. Each SNP-gene edge represents an eQTL in any tissue in the GTEx compendium. The edge is weighted by the ‘relevance score ’ (W1, W2, etc). of the tissue which is calculated as -log(p), where p is the P-value of the hypergeometric test between the query set SNPs and GTEx eQTLs for that tissue. If a SNP-gene relationship is supported by eQTLs detected in multiple tissues, the edge weight is the sum of the relevance scores of those tissues.
Figure 2.
Figure 2.
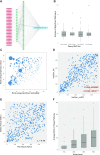
(A) SNP (red) and gene (green) nodes connected to the pathway node ‘Stablization_of_p53’, directly (SNP – gene – pathway) or indirectly (SNP – gene – gene – pathway) are shown. The left layer of gene nodes are genes directly connected to SNP nodes. The SNP set, obtained from a breast cancer GWAS study, has only one SNP that is associated with a member gene of the pathway (darker edge), but many indirect connections establish the relevance of this pathway to the SNP set. (B) Numbers of significant pathways (at empirical P-value < 0.05) reported by VarSAn for each of four disease-related SNP sets (blue dots). Each number is contrasted with a distribution (box and whiskers plots) of corresponding numbers for 100 random query sets of similar size and composition as the disease-related SNP set. (C) Pathway ranks reported by VarSAn for the BrCa GWAS SNP set, when using equilibrium probability (x-axis) or empirical P-value (y-axis) as pathway score. Size of each circle represents the number of genes in the pathway. (D) Effect of using gene-gene edges. Pathways ranked highly (top 50) by one method and ranked at 250 or worse by the other method are marked in red. * Reactome pathway R-HSA-5625886: Activated PKN1 stimulates transcription of AR regulated genes KLK2 and KLK3; ** Reactome pathway R-HSA-186797: Signaling by PDGF (E) Scatter plot of pathway rank using VarSAn on the BrCa GWAS SNP set, with SNP-gene edges based on eQTLs from the relevant tissue (y-axis) versus those based on eQTLs from all tissues (pan-tissue approach, x-axis). Seven of the top 10 pathways reported by the pan-tissue approach are in the top 50 reported with the breast tissue eQTLs being used for SNP-gene edges (marked in red) (F) Rank of target pathways for 24 drugs with 10x, 20×, 30× and 40× noisy query sets. Each box represents average rank of target pathways across the 20 independent tests at corresponding noise level.
Figure 3.
Figure 3.
(A) Scatter plot of pathway ranks reported by VarSAn and HGT, for the BrCa GWAS SNP set. Pathways labeled 1 to 5 are those with significantly better ranking in VarSAn than in HGT, with supporting literature evidence in Table 2A. Pathway labeled 6 is ‘Interferon gamma signaling’, and was ranked significantly better by HGT. (B) Scheme for assessing consistency and confusion scores of a pathway ranking method. SNPs associated with each disease are sampled to create two mutually exclusive subsets of 100 SNPs each; the process is repeated 10 times to create 10 pairs of subsets. Top pathways reported for each of the two subsets in a pair should be similar, and this is captured in the consistency score. Top pathways for SNP sets from different diseases should be distinct, and this is reflected in the confusion score. (C) Consistency and confusion scores for all diseases and disease pairs in the evaluation. Diagonal entries represent consistency score of different diseases. Off-diagonal entries represent confusion scores between each pair of diseases. There are two entries for each disease pair, due to an asymmetry in the evaluation procedure (see Methods); these two entries may be considered as two estimates of the confusion score. CC-ratio of each disease is calculated as the ratio of consistency score over the average of all confusion scores where the target disease is a member of the pair. D) Scatter plot of CC-ratios of VarSAn versus HGT.

References

    1. Zhang F., Lupski J.R.. Non-coding genetic variants in human disease. Hum. Mol. Genet. 2015; 24:R102–R110. - PMC - PubMed
    1. Horn S., Figl A., Rachakonda P.S., Fischer C., Sucker A., Gast A., Kadel S., Moll I., Nagore E., Hemminki K.et al. .. TERT promoter mutations in familial and sporadic melanoma. Science. 2013; 339:959–961. - PubMed
    1. Wang S., Mandell J.D., Kumar Y., Sun N., Morris M.T., Arbelaez J., Nasello C., Dong S., Duhn C., Zhao X.et al. .. De novo sequence and copy number variants are strongly associated with tourette disorder and implicate cell polarity in pathogenesis. Cell Rep. 2018; 24:3441–3454. - PMC - PubMed
    1. Jin Z.B., Wu J., Huang X.F., Feng C.Y., Cai X.B., Mao J.Y., Xiang L., Wu K.C., Xiao X., Kloss B.A.et al. .. Trio-based exome sequencing arrests de novo mutations in early-onset high myopia. Proc. Natl. Acad. Sci. U.S.A. 2017; 114:4219–4224. - PMC - PubMed
    1. Savic D., Ye H., Aneas I., Park S.Y., Bell G.I., Nobrega M.A.. Alterations in TCF7L2 expression define its role as a key regulator of glucose metabolism. Genome Res. 2011; 21:1417–1425. - PMC - PubMed

Publication types