Review
. 2021 Nov;27(22):5726-5761.
doi: 10.1111/gcb.15816. Epub 2021 Aug 29.

Carbon myopia: The urgent need for integrated social, economic and environmental action in the livestock sector

Affiliations
Review

Carbon myopia: The urgent need for integrated social, economic and environmental action in the livestock sector

Matthew Tom Harrison et al. Glob Chang Biol. 2021 Nov.

Abstract

Livestock have long been integral to food production systems, often not by choice but by need. While our knowledge of livestock greenhouse gas (GHG) emissions mitigation has evolved, the prevailing focus has been-somewhat myopically-on technology applications associated with mitigation. Here, we (1) examine the global distribution of livestock GHG emissions, (2) explore social, economic and environmental co-benefits and trade-offs associated with mitigation interventions and (3) critique approaches for quantifying GHG emissions. This review uncovered many insights. First, while GHG emissions from ruminant livestock are greatest in low- and middle-income countries (LMIC; globally, 66% of emissions are produced by Latin America and the Caribbean, East and southeast Asia and south Asia), the majority of mitigation strategies are designed for developed countries. This serious concern is heightened by the fact that 80% of growth in global meat production over the next decade will occur in LMIC. Second, few studies concurrently assess social, economic and environmental aspects of mitigation. Of the 54 interventions reviewed, only 16 had triple-bottom line benefit with medium-high mitigation potential. Third, while efforts designed to stimulate the adoption of strategies allowing both emissions reduction (ER) and carbon sequestration (CS) would achieve the greatest net emissions mitigation, CS measures have greater potential mitigation and co-benefits. The scientific community must shift attention away from the prevailing myopic lens on carbon, towards more holistic, systems-based, multi-metric approaches that carefully consider the raison d'être for livestock systems. Consequential life cycle assessments and systems-aligned 'socio-economic planetary boundaries' offer useful starting points that may uncover leverage points and cross-scale emergent properties. The derivation of harmonized, globally reconciled sustainability metrics requires iterative dialogue between stakeholders at all levels. Greater emphasis on the simultaneous characterization of multiple sustainability dimensions would help avoid situations where progress made in one area causes maladaptive outcomes in other areas.

Keywords: adaptation; carbon dioxide removal (CDR); carbon neutral; climate change; emissions intensity; maladaptation; multidisciplinary; policy; socio-economic; sustainable development goals.


Figures

FIGURE 1
FIGURE 1
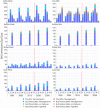
Global GHG emissions from ruminant livestock (cattle, buffalo, sheep and goats). Estimates were computed using IPCC Tier 1 Guidelines associated with on‐farm emissions. Note different scaling on each ordinate axis. Values shown have been adapted from FAOSTAT (http://www.fao.org/faostat)
FIGURE 2
FIGURE 2
Average meat supply per capita (kilograms per annum) versus gross domestic product ($US GDP) per capita in 2015. Meat supply was computed as the total amount of the commodity available for human consumption during the reference period. Bubble size is proportional to population per country (China = 1,407 million, United States = 321 million and Ireland= 4.7 million). Values shown do not include fish or seafood (adapted from FAOSTAT http://www.fao.org/faostat/en/#data/FBS)
FIGURE 3
FIGURE 3
Projected growth in global livestock meat production (carcass weight) in developed countries and LMIC between 2017 and 2029 (adapted from OECD, 2021)
FIGURE 4
FIGURE 4
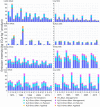
Disaggregated historical and future greenhouse gas emissions (GHG) associated with meat and milk production from key ruminant species (cow, sheep, goat and buffalo) for the main livestock producing continents from 1995 to 2050. X‐axis values: 1 = Africa, 2 = Americas, 3 = Asia, 4 = Europe, 5 = Oceania. Values shown to the right of the dashed red line indicate future projected GHG emissions. Note differing scales on ordinate axes. Values shown were estimated using IPCC Tier 1 associated with on farm emissions (adapted from FAOSTAT http://www.fao.org/faostat)
FIGURE 5
FIGURE 5
Emission intensities of meat and milk from key ruminants (cattle, buffalo, sheep and goats) for the main livestock producing continents from 1975 to 2015. X‐axis values: 1 = Africa, 2 = Americas, 3 = Asia, 4 = Europe, 5 = Oceania. Values shown were estimated using IPCC Tier 1 associated with on farm emissions. Note differing scales on ordinate axes (adapted from FAOSTAT http://www.fao.org/faostat)
FIGURE 6
FIGURE 6
(a) Number of Web of Science Core Collection documents published between 1945 and 2021 that include keywords ‘greenhouse gas emissions mitigation and livestock’ and/or additional biophysical, economic, environmental and social keywords; (b) corresponding search terms for LMIC or developing countries conducted using the search terms ‘AND (LMIC OR (low AND Middle AND income) OR “developing countr*”)’. Bar colours in (b) represent corresponding search colours in (a); note change in order of histogram bars
FIGURE 7
FIGURE 7
Relationship between theoretical maximum and actual GHG mitigation potential as influenced by social (barriers to adoption, animal welfare, social licence etc.), political (carbon price, red tape, emission mitigation legislation etc.), environmental (nutrient leaching, soil erosion, influence on biodiversity, ecosystems services etc.), economic (cost of implementation and relative return on investment etc.) and biophysical factors (climate, soil, geography, location etc). Social, political and environmental issues historically tend to be investigated last in studies of GHG emissions mitigation, whereas GHG emissions mitigation and productivity potentials are often evaluated first. Text adapted from Smith (2012)
FIGURE 8
FIGURE 8
Example of a trade‐off resulting from an intervention aimed at increasing soil carbon (e.g. through participation in an emissions trading scheme) that could result in higher net GHG emissions compared with business as usual. In the absence of external influence or constraints, landholders are likely to adapt grazing management to utilize any additional pasture or grassland production. This example illustrates the importance of assessing GHG emissions mitigation options holistically to manage unforeseen trade‐offs, such as pollution swapping
FIGURE 9
FIGURE 9
Current status of the nine planetary boundaries. Below the green zone defines the safe operating space, yellow represents the uncertainty zone (increasing risk), red is the high‐risk zone. The planetary boundary lies at the innermost heavy circle. The control variable for climate change is equivalent atmospheric CO2 concentration. Processes for which global‐level boundaries are not quantified are shaded grey (atmospheric aerosol loading, novel entities and the functional role of biosphere integrity). Reproduced with permission from Steffen et al. (2015)

References

    1. Abbott, D. W. , Aasen, I. M. , Beauchemin, K. A. , Grondahl, F. , Gruninger, R. , Hayes, M. , Huws, S. , Kenny, D. A. , Krizsan, S. J. , Kirwan, S. F. , Lind, V. , Meyer, U. , Ramin, M. , Theodoridou, K. , von Soosten, D. , Walsh, P. J. , Waters, S. , & Xing, X. (2020). Seaweed and seaweed bioactives for mitigation of enteric methane: Challenges and opportunities. Animals, 10. - PMC - PubMed
    1. Abernethy, B. , & Rutherford, I. (1999). Guidelines for stabilising stream banks with riparian vegetation (pp. 1–137). Cooperative Research Centre for Catchment Hydrology. Department of Geography and Environmental Studies, University of Melbourne.
    1. Abreu, R. C. , Hoffmann, W. A. , Vasconcelos, H. L. , Pilon, N. A. , Rossatto, D. R. , & Durigan, G. (2017). The biodiversity cost of carbon sequestration in tropical savanna. Science Advances, 3, e1701284. 10.1126/sciadv.1701284 - DOI - PMC - PubMed
    1. Ahmed, M. , Ahmad, S. , Waldrip, H. M. , Ramin, M. , & Raza, M. A. (2020). Whole farm modeling: A systems approach to understanding and managing livestock for greenhouse gas mitigation, economic viability and environmental quality. In H. Waldrip, P. Pagliari & Z. He (Eds.), Animal manure. 10.2134/asaspecpub67.c25 - DOI
    1. Alcock, D. J. , Harrison, M. T. , Rawnsley, R. P. , & Eckard, R. J. (2015). Can animal genetics and flock management be used to reduce greenhouse gas emissions but also maintain productivity of wool‐producing enterprises? Agricultural Systems, 132, 25–34. 10.1016/j.agsy.2014.06.007 - DOI