. 2021 Sep 27;31(18):3996-4008.e6.
doi: 10.1016/j.cub.2021.06.079. Epub 2021 Jul 26.

The spatiotemporal organization of experience dictates hippocampal involvement in primary visual cortical plasticity

Affiliations

The spatiotemporal organization of experience dictates hippocampal involvement in primary visual cortical plasticity

Peter S B Finnie et al. Curr Biol. .

Abstract

The hippocampus and neocortex are theorized to be crucial partners in the formation of long-term memories. Here, we assess hippocampal involvement in two related forms of experience-dependent plasticity in the primary visual cortex (V1) of mice. Like control animals, those with hippocampal lesions exhibit potentiation of visually evoked potentials after passive daily exposure to a phase-reversing oriented grating stimulus, which is accompanied by long-term habituation of a reflexive behavioral response. Thus, low-level recognition memory is formed independently of the hippocampus. However, response potentiation resulting from daily exposure to a fixed sequence of four oriented gratings is severely impaired in mice with hippocampal damage. A feature of sequence plasticity in V1 of controls, which is absent in lesioned mice, is the generation of predictive responses to an anticipated stimulus element when it is withheld or delayed. Thus, the hippocampus is involved in encoding temporally structured experience, even within the primary sensory cortex.

Keywords: hippocampus; long-term memory; primary visual cortex; synaptic plasticity; systems consolidation.


Conflict of interest statement

Declaration of interests The authors declare no competing interests. R.W.K. is currently an employee of Biogen, Inc.

Figures
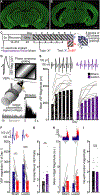
Figure 1.
Figure 1.. Long-term visual recognition memory does not require the hippocampus.
Representative coronal brain sections processed via NeuN immunofluorescence from mice in (A) sham control and (B) hippocampal lesion groups. The mouse depicted in the lesion example retained 40.77% residual hippocampal tissue across all quantified coronal sections, relative to the mean area of the sham control group. Green, NeuN. Scale bar represents 500 μm. Diagrams depict the (C) experimental protocol and (D) apparatus. (E) Mean VEP magnitudes plotted for each training day (days inset along x-axis, mean daily voltage traces plotted at top, and lines depict mean magnitude for each mouse). In both groups VEPs potentiated across days of exposure to a grating stimulus (two-way repeated-measures [RM] ANOVA with Greenhouse-Geisser correction, effect of day [F1.859,39.04 = 50.96, p < 0.0001]; Sidak’s posthoc tests comparing Days 1 to 2–6, each p < 0.0001). However, potentiation did not differ between Sham (S) and Lesion (L) groups (neither a main effect of group [F1,21 = 2.89, p = 0.1] nor group by day interaction [F1.859,39.04 = 0.44, p = 0.63]). F) VEP magnitudes elicited by familiar (F) and novel (N) stimulus orientations on Day 7, normalized to Day 1. The difference in familiar versus novel responses was significantly larger in the Lesion relative to Sham group (RM ANOVA group by stimulus interaction; F1,21 = 6.03, p = 0.023; Sidak’s post hoc tests: F vs N, Sham p = 0.0017, Lesion p < 0.0001). G) The ratio of VEP magnitudes elicited by F relative to N was also larger in the Lesion versus Sham group (two-tailed Mann-Whitney U = 24, nsham = 11, nlesion = 12, p = 0.009), confirming that SRP is exaggerated following hippocampal ablation. H) In each group, larger mean behavioral response magnitudes (arbitrary units, a.u.) were elicited by the onset of N versus F stimuli on Day 7 (mean traces superimposed at top; two-tailed Wilcoxon matched-pairs planned comparisons: sham, Z = 2.223, p = 0.024; lesion, Z = 2.118, p = 0.034). I) The Novel/Familiar vidget ratios for each group were comparable (unpaired two-tailed t-test, t21 = 0.16, p = 0.88). *p < 0.05, **p <0.01, *** p < 0.001, ****p < 0.0001, not significant (n.s.) p > 0.05. n/group: Sham = 11, Lesion = 12. See also Figures S1–S2; Table S1.
Figure 2.
Figure 2.. Pre-training hippocampal lesions impair spontaneous exploration of a spatially-displaced object.
A) Diagram of experimental timeline and apparatus. Square boxes represent overhead views of the open field arena, and filled circles example positions of identical objects during sampling and testing phases. B) The average time mice explored two identical objects declined between the first and each subsequent sampling sessions (two-way RM ANOVA with Greenhouse-Geisser correction, main effect of session, F2.071,43.482 = 4.38, p = 0.017; Dunnetts’s posthoc tests comparing Sessions 1 with 2 (p = 0.005), 3 (p = 0.013), and 4 (p = 0.049)). There was no difference in exploration between Lesion and Sham groups during the sampling sessions (main effect of Group, F1,21= 0.13, p = 0.73; Group by Session interaction, F2.071,43.482 = 1.13, p = 0.34). C) On test day the Sham group explored a spatially displaced object for a significantly longer duration (N mean = 10.97±1.17 s) than a static object (F mean = 6.15±1.04 sec; treatment by object interaction: F1,21 = 14.03, p = 0.001; Sidak’s multiple comparison test, p < 0.0001), whereas the lesion group explored both objects equivalently (F = 8.23±1.55 sec; N = 8.21±1.25 s; Sidak’s, p > 0.99). D) A ratio of exploration times for the N versus F object was also significantly greater for the Sham (0.31 ± 0.05 a.u.) relative to Lesion (0.012 ± 0.06 a.u.) group (two-tailed unpaired t21 = 3.79, p = 0.001). * < 0.05, ** < 0.01, **** < 0.0001. n/group: Sham = 11, Lesion = 12. See also Table S1.
Figure 3.
Figure 3.. The hippocampus is required for V1 response potentiation evoked by a sequence of visual stimuli.
A) Schematic diagram of experimental time-course and daily visual stimulation protocol. B) Average VEP waveforms elicited by visual sequence ABCD for each group on days 1–4. Labeled arrows denote the onset latency of sequence elements A, B, C, and D. N1–4 and P1–4 labels refer, respectively, to the four peak negative- and positive-going deflections of the V1 local field potential following each stimulus onset. C) Potentiation of average VEP magnitude to the familiar sequence across Days 1–4 was impaired in mice with hippocampal relative to sham lesions (two-way RM ANOVA, day by group interaction, F3, 33 = 6.20, p = 0.0018). Within-subject potentiation was significant for the Sham (Sidak’s posthoc comparisons of Days 1 versus 2–4: p = 0.024, 0.027, and 0.022, respectively) but not Lesion group (Day 2, p = 0.072; Day 3, p = 0.11; Day 4, p = 0.061). D) Average VEP waveforms elicited by sequence ABCD and the reverse DCBA during the Day 5 test session (Day 1 superimposed for reference). E) On Day 5, response potentiation in Lesion and Sham groups were significantly different for elements B and C in the ABCD versus reverse DCBA sequences, normalized to the day-1 baseline magnitudes for each mouse (two-way RM ANOVA group by stimulus interaction, F1, 11= 31.73, p = 0.0002). Responses to BC were larger in the Sham controls than in the Lesion group (planned Sidak’s comparison, p < 0.0001), suggesting the hippocampus is required for sequence-specific potentiation. Furthermore, response magnitude to the forward (BC) sequence was only larger than the reverse (CB) in the Sham (p < 0.0001) but not the Lesion group (p = 0.75). Mean response to the reverse CB sequence was also significantly larger for the Sham compared to Lesion group (p = 0.0057), indicative of an overall difference in sequence-independent potentiation. Subsequent planned one-sample t-tests with Bonferroni correction revealed significant potentiation of responses to both BC and CB over the Day-1 baseline only in the Sham (p = 0.0004 and 0.0016, respectively) but not the Lesion group (p = 0.26 and 0.15, respectively). F) The familiar/novel ratio on Day 5 was also significantly larger in the Sham versus Lesion group (Welch’s two-tailed t-test, t6.316= 3.162, p = 0.018). Furthermore, planned one-sample t-tests confirmed that sequence-specific potentiation was only evident in the sham (p < 0.0001) but not lesion (p = 0.51) group. Bars represent group means and points/lines are mean values for each individual mouse. *p < 0.05, **p <0.01, *** p < 0.001, ****p < 0.0001, n.s. p > 0.05. n/group: Sham = 7, Lesion = 6. See also Figure S3; Table S1.
Figure 4.
Figure 4.. Hippocampal lesions impair the generation of anticipatory responses in V1.
A) In addition to presentation of the forward and reverse sequences, on Day 5 of the visual sequence protocol we included interleaved blocks of the forward ABCD sequence in which each element was displayed for twice the standard duration (300 ms instead of 150 ms). Traces depict truncated mean VEP waveforms recorded in Sham and Lesion groups following sequence onset, encompassing both early (N1, P1) and late (N2, P2) VEP components elicited by stimulus A. Hashed horizontal lines indicate the transition points between sequence elements (denoted by labeled arrows at panel bottom, with grayed ‘B’ indicating the standard stimulus onset time-point). B) Truncated mean VEP waveforms elicited in Sham and Lesion groups by the familiar grating stimulus on Day 7 of the SRP protocol (re-plotted from Figure 2). C) Graph displays mean N2-P2 responses elicited by stimulus A in the slowed ABCD pattern on Day 5 of the visual sequence protocol (Delay Seq.) and by the familiar grating orientation on Day 7 of the SRP protocol. To account for baseline VEP differences between groups and protocols, the trough-to-peak magnitude of the N2-P2 response was normalized to the average magnitude of P1-N1 for each mouse ([P2 – N2]/[P1 – N1] × 100). Bars represent group means, with individual data-points depicting the mean response magnitudes for each mouse. A significant group-by-protocol interaction (two-way between-groups ANOVA, F1,32 = 19.31, p = 0.0001) is driven by a larger P2-N2 response in sham controls than lesioned mice exposed to the visual sequence protocol (Tukey’s pairwise comparison, p < 0.0001), but not the SRP protocol (p = 0.51). D-E) Truncated mean VEP waveforms recorded from Sham control and Lesion groups in response to the ABCD visual sequence on experimental days 1 and 10, as well as A_CD on day 10 (wherein gray screen is substituted for grating stimulus B). F-G) Graphs plot mean N2-P2 VEP magnitudes for the Sham and Lesion groups elicited by the 2nd element in each visual sequence (grating orientation B or gray screen). A significant group-by-sequence interaction effect (two-way RM ANOVA with Greenhouse-Geisser correction, F2, 22 = 5.553, p = 0.011) was driven by robust VEP potentiation in the Sham group elicited by stimulus B on Day 10 versus Day 1 (Tukey’s pairwise comparisons, p = 0.0499) and by gray screen on Day 10 versus stimulus B on Day 1 (p = 0.028), but not between stimulus B and gray screen on Day 10 (p = 0.198). Conversely, responses in the Lesion group to stimulus B on Day 10 are exaggerated when compared to those elicited by gray screen (Tukey’s Day 10 ABCD vs A_CD comparison, p = 0.0079), despite a lack of response potentiation to stimulus B between Days 1 and 10 (p = 0.244). H) To directly compare generative anticipatory responses between the two groups, we analyzed the N2-P2 responses in the A_CD condition (as a percentage of the ABCD condition on Day 10). The anticipatory VEP during the omission of stimulus B was significantly larger in the Sham than the Lesion group (Welch’s two-tailed t-test, t7.025 = 4.552, p = 0.0026). *p < 0.05, **p < 0.01, ****p < 0.0001, n.s. p > 0.05. n/group: Seq., Sham = 7, Lesion = 6; SRP, Sham = 11, Lesion = 12. See also Figure S3; Table S1.
Figure 5.
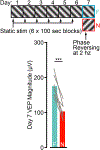
Figure 5.. Daily exposure to static gratings elicits robust VEP potentiation.
Diagram summarizes a modified SRP protocol in which each mouse (N = 7) viewed 6 × 100 sec blocks of a static grating stimulus during each of 6 daily recording sessions. On the 7th day of the protocol both a familiar stimulus and a novel orientation were presented phase reversing at 2 Hz. Static stimulation elicited robust SRP, revealed by comparison to the novel orientation (paired two-tailed t-test, t6 = 7.235, p = 0.0004). Thus, SRP does not require modulation of upcoming responses based on a predicted spatiotemporal pattern. ***p < 0.001.
Figure 6.
Figure 6.. Orientation-shifted stimulus pairs elicit exaggerated potentiation compared to phase-shifted pairs.
A) Diagram of a modified visual stimulation protocol combining attributes of the SRP and sequence protocols. Each mouse (N = 6) views two pairs of stimuli across interleaved blocks. The pairs of stimuli are either phase- or orientation-shifted (labeled ‘SRP’ and ‘Sequence’, respectively). All other stimulation properties are identical across the two conditions. B) Average VEP waveforms for the SRP and sequence stimulus pairs, with ticks denoting the onset of phase reversed (flip and flop) and orientation-shifted (A and B) images. C) Comparing VEP magnitudes elicited by the second stimulus in each pair (‘flop’ vs. ‘B’) indicates that potentiation over days is exaggerated for the orientation-shifted compared to phase-shifted stimulus (two-way RM ANOVA, Stimulus by Day interaction, F3,15 = 4.81, p = 0.015; Sidak’s posthoc comparisons of SRP and sequence VEPs on d1, p = 0.92; d2, p = 0.0036; d3, p = 0.050; d4, p = 0.011). We conclude that in addition to potentiation driven by familiarity with the identity of each oriented grating, during familiar visual sequences the brain predictively modulates responses to each cued stimulus, further enhancing VEP magnitude. * < 0.05, ** < 0.01, n.s. non-significant.

Comment in

References

    1. Squire LR (1992). Declarative and nondeclarative memory: multiple brain systems supporting learning and memory. J. Cogn. Neurosci 4, 232–243. - PubMed
    1. Mishkin M, Suzuki WA, Gadian DG & Vargha-Khadem F (1997). Hierarchical organization of cognitive memory. Philos. Trans. R. Soc. Lond. B Biol. Sci 352, 1461–1467. - PMC - PubMed
    1. Nissen MJ, Knopman DS & Schacter DL (1987). Neurochemical dissociation of memory systems. Neurology 37, 789–794. - PubMed
    1. Squire LR (2004). Memory systems of the brain: a brief history and current perspective. Neurobiol. learn. and mem 82, 171–177. - PubMed
    1. Donato F, Alberini CM, Amso D, Dragoi G, Dranovsky A, & Newcombe NS (2021). The Ontogeny of Hippocampus-Dependent Memories. J. Neurosci 41, 920–926. - PMC - PubMed

Publication types

LinkOut - more resources